. 2016 Dec;44(12):3553-3567.
doi: 10.1007/s10439-016-1682-7. Epub 2016 Jun 27.

Regional Mapping of Flow and Wall Characteristics of Intracranial Aneurysms

Affiliations

Regional Mapping of Flow and Wall Characteristics of Intracranial Aneurysms

Juan R Cebral et al. Ann Biomed Eng. 2016 Dec.

Abstract

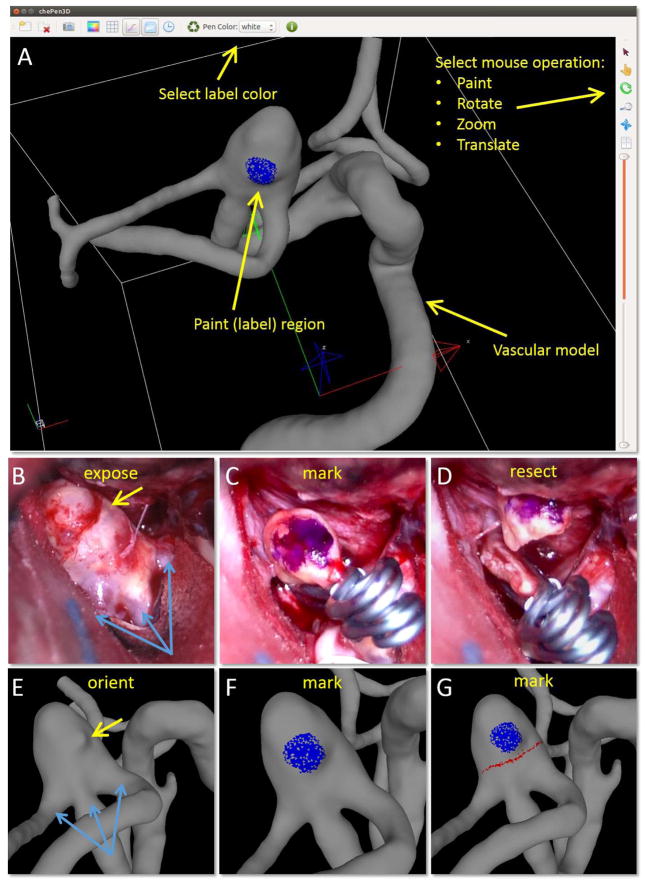
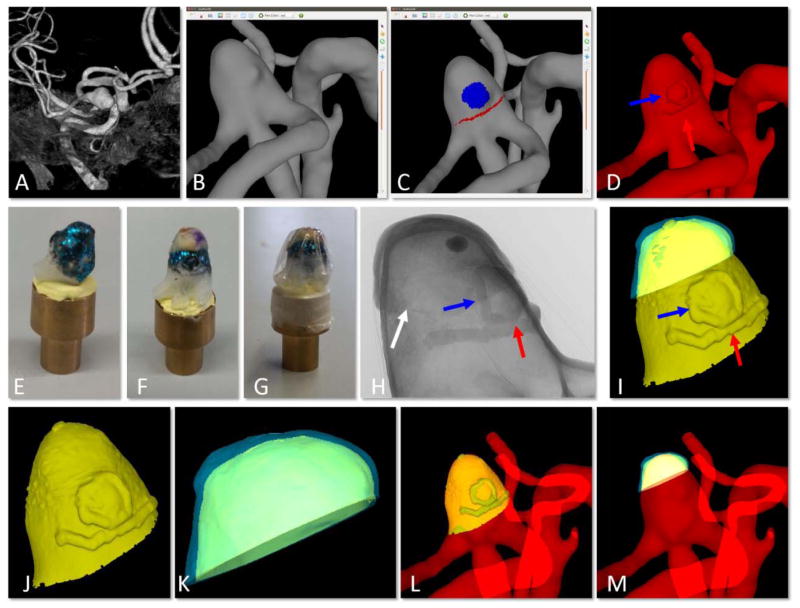
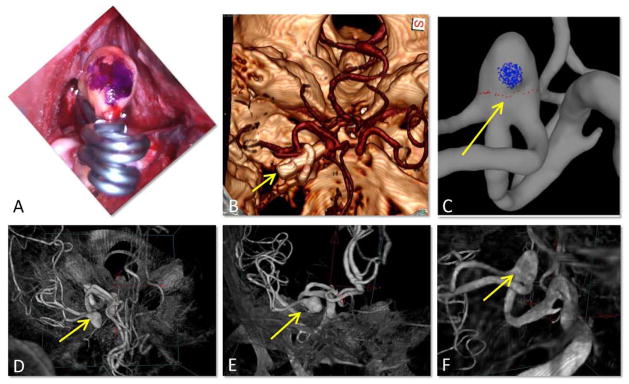
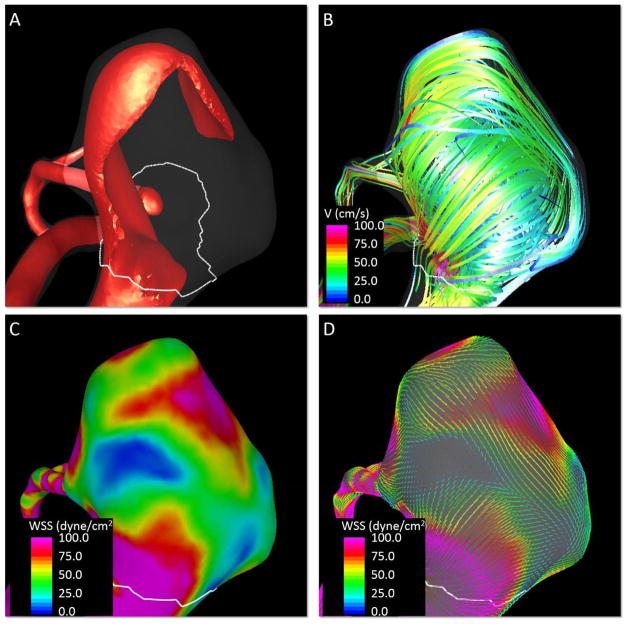
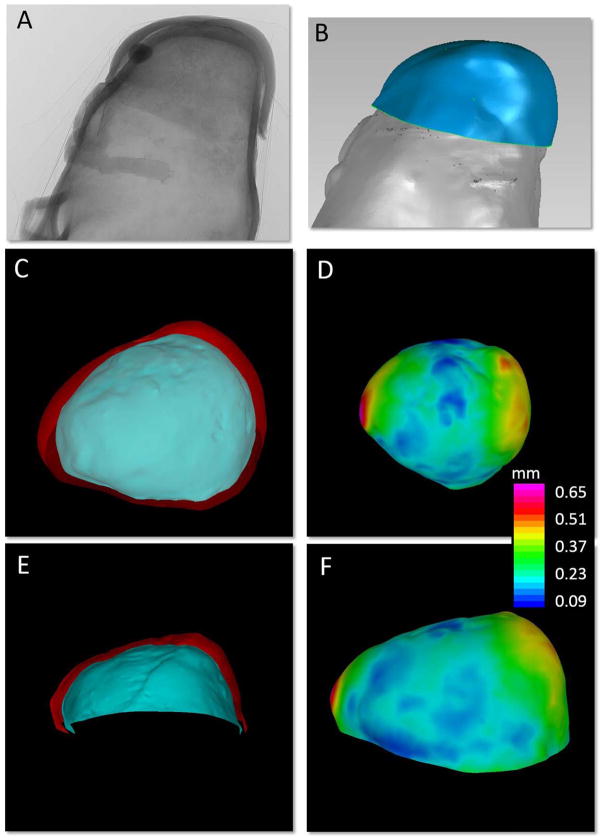
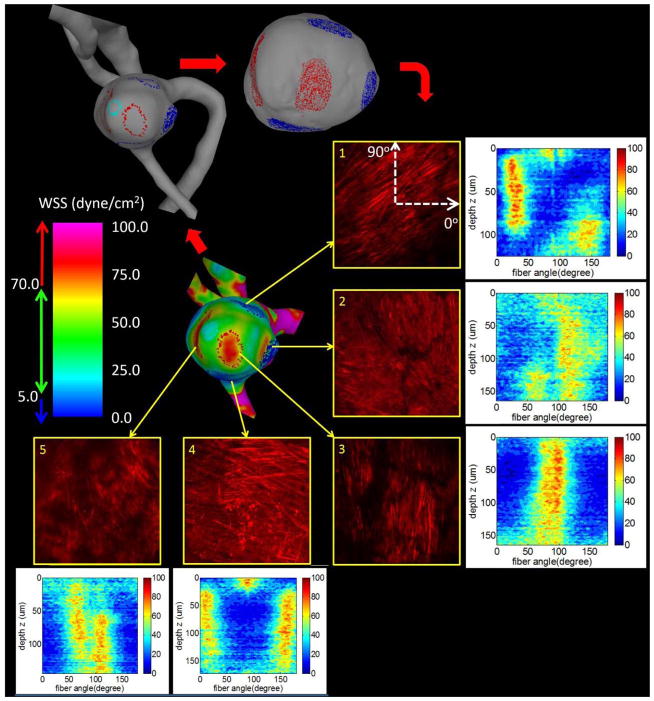
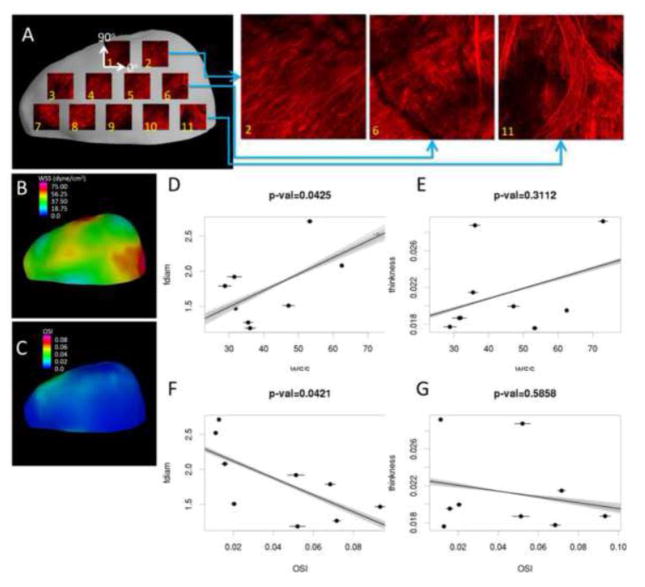
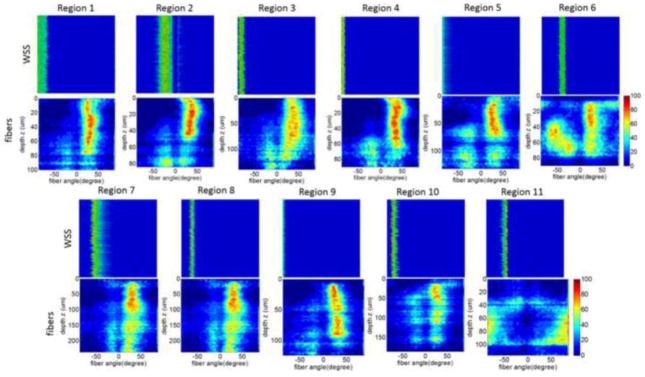
The evolution of intracranial aneurysms (IAs) is thought to be driven by progressive wall degradation in response to abnormal hemodynamics. Previous studies focused on the relationship between global hemodynamics and wall properties. However, hemodynamics, wall structure and mechanical properties of cerebral aneurysms can be non-uniform across the aneurysm wall. Therefore, the aim of this work is to introduce a methodology for mapping local hemodynamics to local wall structure in resected aneurysm specimens. This methodology combines image-based computational fluid dynamics, tissue resection, micro-CT imaging of resected specimens mounted on 3D-printed aneurysm models, alignment to 3D vascular models, multi-photon microscopy of the wall, and regional mapping of hemodynamics and wall properties. This approach employs a new 3D virtual marking tool for surgeons to delineate the location of the resected specimen directly on the 3D model, while in the surgical suite. The case of a middle cerebral artery aneurysm is used to illustrate the application of this methodology to the assessment of the relationship between local wall shear stress and local wall properties including collagen fiber organization and wall geometry. This methodology can similarly be used to study the relationship between local intramural stresses and local wall structure.

Keywords: Cerebral aneurysms; Collagen architecture; Computational fluid dynamics; Hemodynamics; Micro-CT; Multi-photon microscopy; Specimen resection.


Figures

Figure 1
Figure 1
Procedure for marking vascular model using a tool (ChenPen3D) for labeling aneurysm features observed during surgery (A): orient vascular model (E) to same alignment as exposed aneurysm (B) using anatomical features for guidance (bleb-yellow arrow, vessels-blue arrows), mark vascular model (F-blue dot) as aneurysm during surgery (C), and delineate clip line on vascular model (G-red line) following the surgical cut (D).
Figure 2
Figure 2
Creation of virtual model of physical tissue sample on virtual 3D-printed IA model and alignment to 3D vascular model. A) pre-operative 3D image, B) reconstruction of vascular model from 3D image, C) ChenPen3D image, with clinical features noted as explained in Figure 1, D) introduction of small extrusions visible in the 3D-printed model for later alignment (red and blue arrows point to extrusions corresponding to red and blue markings in C, white arrow points to small incision made to reference MPM imaging regions), E) 3D-printed aneurysm model with metallic coating, F) tissue sample placed on 3D-printed IA aligned using markings on tissue and small extrusions, G) wrapping to prevent dehydration, H) 2D image of micro-CT scan of tissue sample mounted on 3D-printed aneurysm shown in G, I) reconstruction of combined virtual model of 3D-printed IA and tissue sample from micro-CT data, J) segmentation of virtual 3D-printed aneurysm, K) segmentation of virtual tissue sample, L) alignment of virtual 3D-printed IA back to 3D vascular model showing alignment of extruded features, and M) final alignment of virtual tissue sample to original vascular model (B) using prior alignments in (I) and (L).
Figure 3
Figure 3
Verification of sample orientation: A) surgical mark (blue dot) aligned with clip ends, B) post-operative CT image showing the clips, yellow arrow points in the line of sight of the surgeon (as in A), C) vascular model with virtual marks, D, E, F) Gradual rotation of the pre-operative 3DRA image from the CTA view point to the surgeon’s view point, verifying correct placement of the virtual marks on the vascular model.
Figure 4
Figure 4
Quantification of aneurysm flow characteristics at peak systole. A) Visualization of aneurysm inflow jet, B) visualization of aneurysm streamlines, C) contours of wall shear stress magnitude, D) visualization of wall shear stress vectors.
Figure 5
Figure 5
Quantification of sample wall thickness. A) 2D projected micro-CT image of tissue sample mounted on 3D-printed aneurysm model, B) segmented virtual IA sample and virtual 3D-printed aneurysm, C, E) inner (blue) and outer (red) surfaces of the tissue sample, and D, F) contour map of wall thickness distribution, thickness computed as the distance map between the inner and outer surfaces of the virtual tissue sample.
Figure 6
Figure 6
Assessment of collagen fiber architecture in regions of low (blue) and high (red) WSS. Five regions of hemodynamic interest are identified on the surface of the CFD model and marked on the vascular model (top left) and virtual tissue sample (top right). These selected regions are then imaged with MPM. Projected MPM stacks are shown along with corresponding histograms of fiber orientations as a function of the imaging depth from the abluminal side.
Figure 7
Figure 7
Comparing collagen fiber diameter and wall thickness with mean WSS and OSI. Physical tissue sample is MPM imaged in a grid pattern and results are mapped back to virtual tissue sample (A). WSS and OSI results are mapped to the virtual tissue sample reconstruction (B, E). Mean WSS and OSI are plotted against mean fiber diameter and wall thickness for each region (C, D, E, and F). Error bars indicate variability of hemodynamic parameters with respect to different tissue alignments. Lines illustrate variability of linear regressions for different tissue sample alignments.
Figure 8
Figure 8
Comparing collagen fiber orientation with WSS orientation at selected regions of the dome as in Figure 7. Fiber orientation histograms for different depths (vertical axis) are presented as colormaps for each region of the tissue sample (bottom row). Colormaps of orientation of WSS vector for different sample alignments (vertical axis) next to the fiber orientations for each region.

References

    1. Barbe MF, Adiga R, Gordiienko O, Pleshko N, Selzer ME, Krynska B. Microcomputed tomography assessment of vertebral column defects in retinoic acid-induced rat model of myelomeningocele. Birth Defects Res A Clin Mol Teratol. 2014;100:453–462. - PubMed
    1. Broderick JP, Brown RD, Jr, Sauerbeck L, Hornung R, Huston J, 3rd, Woo D, Anderson C, Rouleau G, Kleindorfer D, Flaherty ML, Meissner I, Foroud T, Moomaw EC, Connolly ES. Greater rupture risk for familial as compared to sporadic unruptured intracranial aneurysms. Stroke. 2009;40:1952–1957. - PMC - PubMed
    1. Cebral JR, Castro MA, Appanaboyina S, Putman CM, Millan D, Frangi AF. Efficient pipeline for image-based patient-specific analysis of cerebral aneurysm hemodynamics: Technique and sensitivity. IEEE Trans Med Imag. 2005;24:457–467. - PubMed
    1. Cebral JR, Castro MA, Putman CM, Alperin N. Flow-area relationship in internal carotid and vertebral arteries. Physiol Meas. 2008;29:585–594. - PMC - PubMed
    1. Cebral JR, Duan X, Chung BJ, Putman CM, Aziz K, Robertson AM. Wall mechanical properties and hemodynamics of unruptured intracranial aneurysms. AJNR Am J Neuroradiol. 2015;36:1695–1703. - PMC - PubMed

Publication types

LinkOut - more resources