. 2016 Jun 28:6:28693.
doi: 10.1038/srep28693.

Mitochondrial phosphoenolpyruvate carboxykinase (PEPCK-M) and serine biosynthetic pathway genes are co-ordinately increased during anabolic agent-induced skeletal muscle growth

Affiliations

Mitochondrial phosphoenolpyruvate carboxykinase (PEPCK-M) and serine biosynthetic pathway genes are co-ordinately increased during anabolic agent-induced skeletal muscle growth

D M Brown et al. Sci Rep. .

Abstract

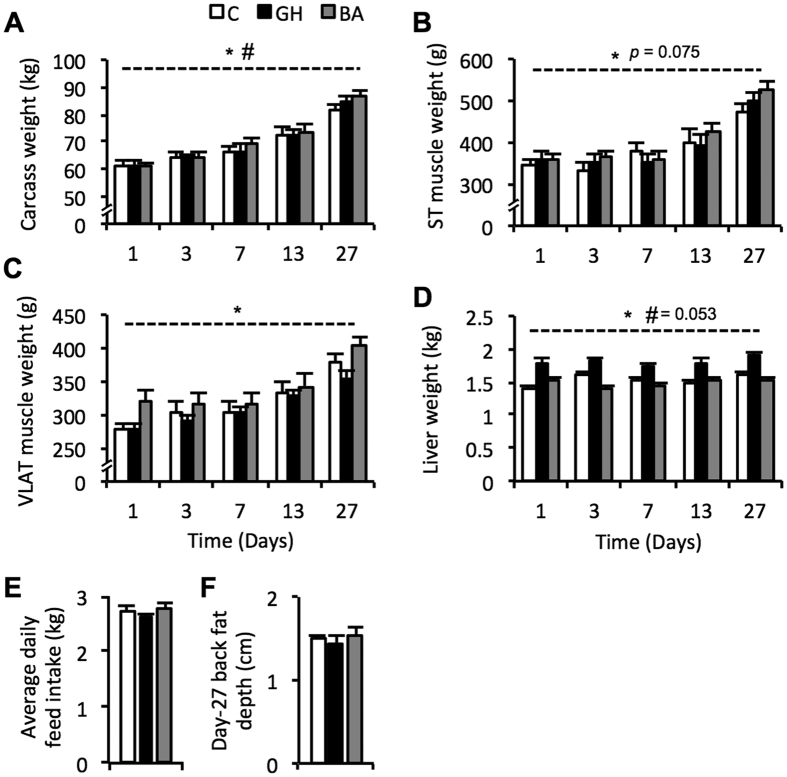
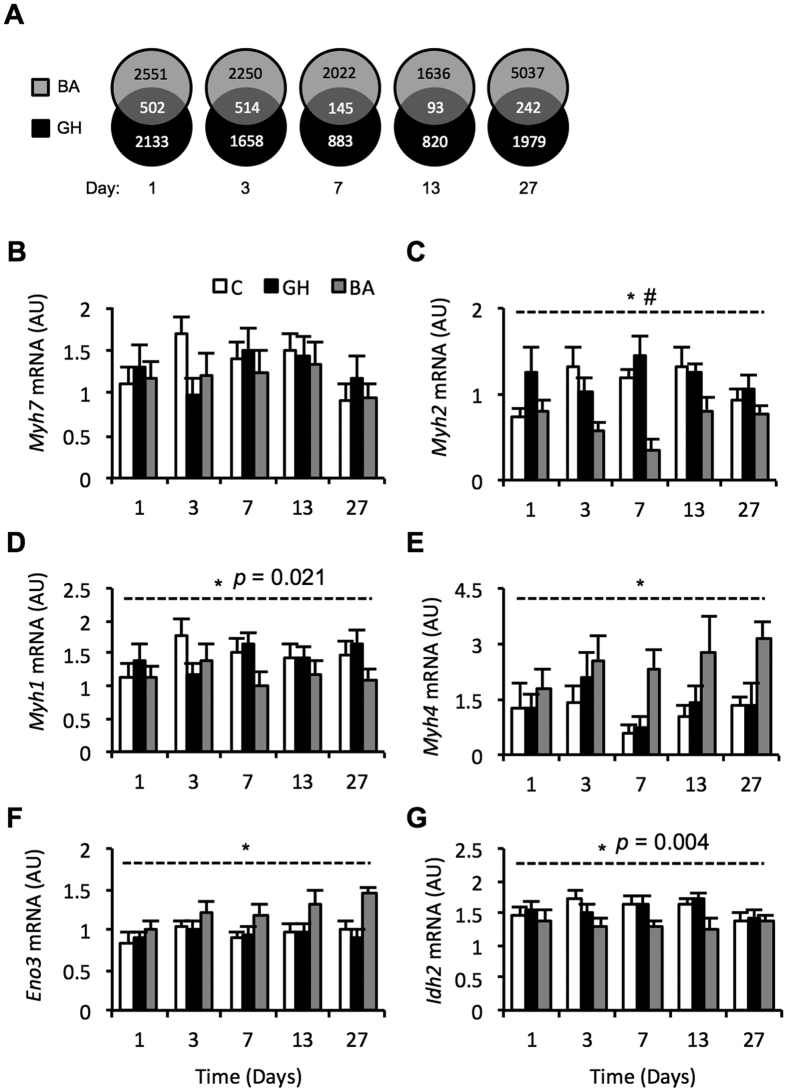
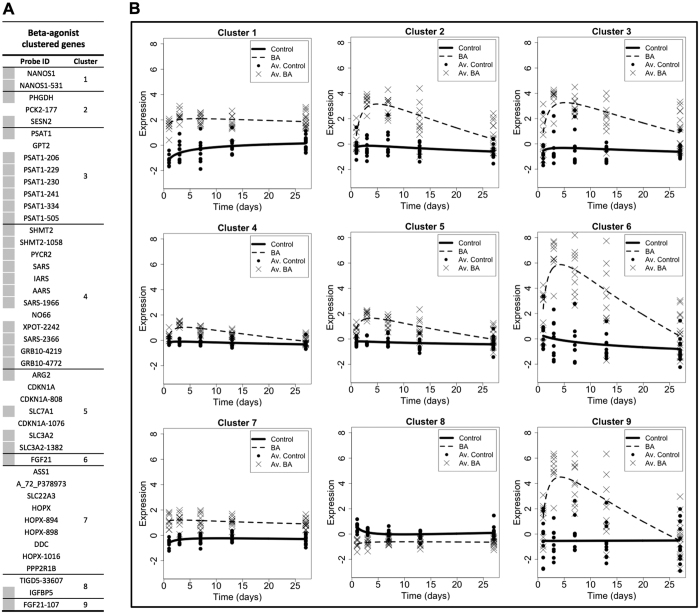
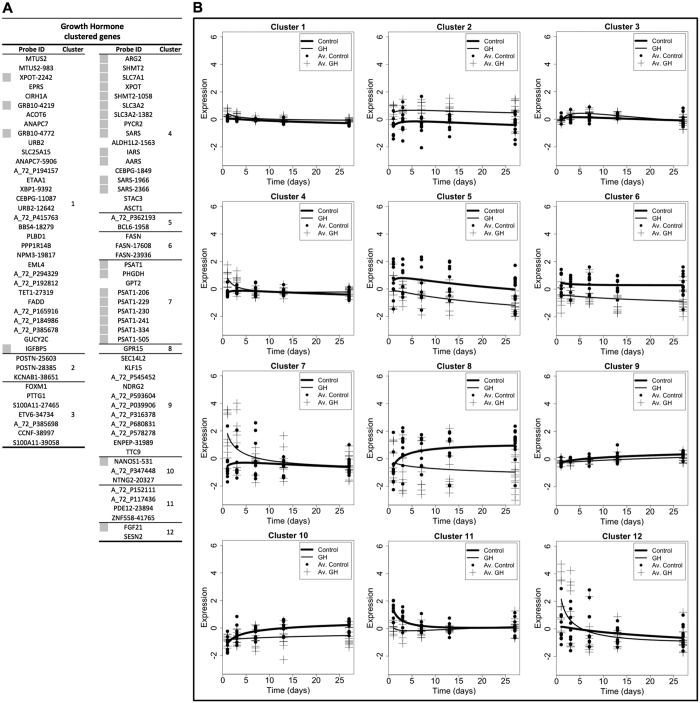
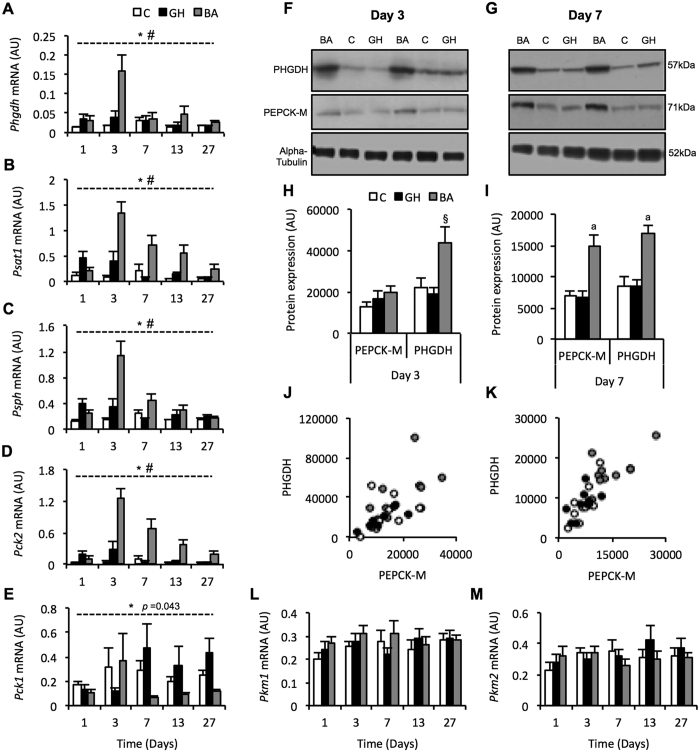
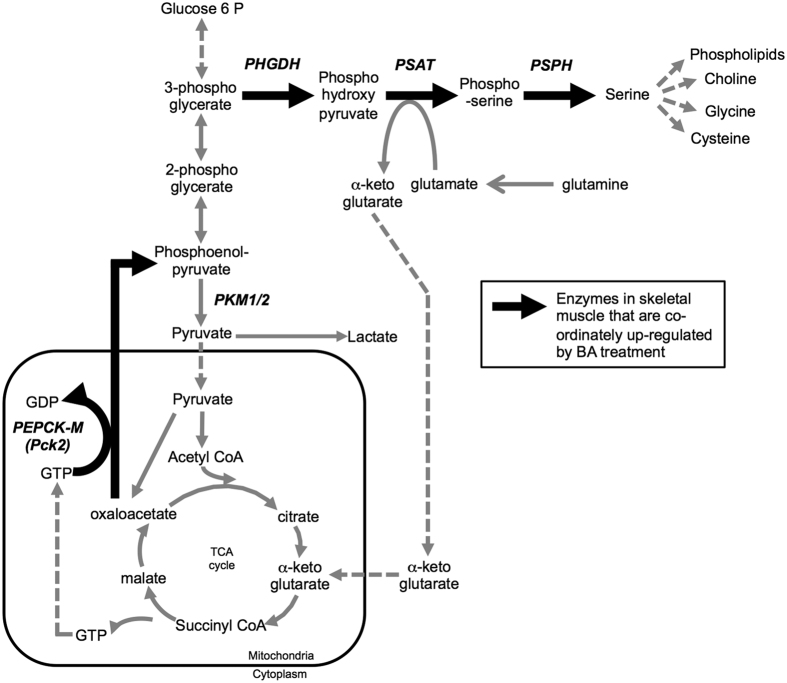
We aimed to identify novel molecular mechanisms for muscle growth during administration of anabolic agents. Growing pigs (Duroc/(Landrace/Large-White)) were administered Ractopamine (a beta-adrenergic agonist; BA; 20 ppm in feed) or Reporcin (recombinant growth hormone; GH; 10 mg/48 hours injected) and compared to a control cohort (feed only; no injections) over a 27-day time course (1, 3, 7, 13 or 27-days). Longissimus Dorsi muscle gene expression was analyzed using Agilent porcine transcriptome microarrays and clusters of genes displaying similar expression profiles were identified using a modified maSigPro clustering algorithm. Anabolic agents increased carcass (p = 0.002) and muscle weights (Vastus Lateralis: p < 0.001; Semitendinosus: p = 0.075). Skeletal muscle mRNA expression of serine/one-carbon/glycine biosynthesis pathway genes (Phgdh, Psat1 and Psph) and the gluconeogenic enzyme, phosphoenolpyruvate carboxykinase-M (Pck2/PEPCK-M), increased during treatment with BA, and to a lesser extent GH (p < 0.001, treatment x time interaction). Treatment with BA, but not GH, caused a 2-fold increase in phosphoglycerate dehydrogenase (PHGDH) protein expression at days 3 (p < 0.05) and 7 (p < 0.01), and a 2-fold increase in PEPCK-M protein expression at day 7 (p < 0.01). BA treated pigs exhibit a profound increase in expression of PHGDH and PEPCK-M in skeletal muscle, implicating a role for biosynthetic metabolic pathways in muscle growth.


Figures

Figure 1
Figure 1. Porcine growth characteristics during 1–27 days of treatment with a beta-adrenergic agonist (grey bars; BA) or recombinant growth hormone (black bars; GH), compared to a control cohort (white bars; C).
Changes in carcass weight (A), Semitendinosus (ST) muscle weight (B), Vastus Lateralis (VLAT) muscle weight (C) and liver weight (D) were measured. Average daily feed intake (E) and back fat depth (F) were measured following 27 days of treatment with beta-adrenergic agonist (BA) or growth hormone (GH) compared to a control cohort. Data is mean ± SEM. *Indicates a significant treatment effect with p < 0.005 (unless otherwise stated). #Indicates a significant treatment x time interaction with p < 0.01 (unless otherwise stated).
Figure 2
Figure 2. Differentially expressed microarray probes (p < 0.05) and changes in muscle fibre type-specific gene expression in porcine Longissimus Dorsi muscle during 1–27 days of treatment with anabolic agents.
Numbers in the overlapping section of the venn diagrams represent shared differentially expressed probes by treatment with a beta-adrenergic agonist (grey circles; BA) and recombinant growth hormone (black circles; GH) (A). Porcine Longissimus Dorsi muscle transcript abundance of myosin heavy chain isoform genes during 1–27 days exposure to beta-adrenergic agonist (grey bars; BA) or recombinant growth hormone (black bars; GH) treatment compared to a control cohort (white bars; C); Myosin heavy chain I: Myh7 (B), Myosin heavy chain IIA: Myh2 (C), Myosin heavy chain IIX: Myh1 (D), myosin heavy chain IIB: Myh4 (E). Metabolic genes Enolase 3: Eno3 (F), and Isocitrate dehydrogenase 2: Idh2 (G), were measured as indicators of glycolytic and oxidative gene expression, respectively. Data is mean ± SEM. n = 10 for days 1, 3, 7 and 13, whilst n = 15 for day 27. *Indicates a significant treatment effect with p < 0.001 (unless otherwise stated). #Indicates a significant treatment x time interaction with p < 0.05.
Figure 3
Figure 3. MaSigPro clustering of differentially expressed microarray probes (p < 0.05) generated using RNA from beta-adrenergic agonist (thin dashed line; BA) treated Longissimus Dorsi (LD) muscle, compared to non-treated controls (solid thick line).
Clustering of probes was conducted using a significance of p < 0.05 and a stringency R2 value of 0.5. The table of clustered microarray probes (A) displays the Probe ID (with gene name if known), the cluster group, and a grey square if that probe was also clustered in the equivalent analysis for growth hormone treated samples (see Fig. 4). The 9 clustered probe plots (B) display time on the x-axis (spanning the treatment duration of 1–27 days) with relative expression on the y-axis. Each plot depicts the expression profile of the microarray probes within that cluster for beta-adrenergic agonist (BA) treated and non-treated control animals. n = 10 for days 1, 3, 7 and 13, whilst n = 15 for day 27. Av. indicates average.
Figure 4
Figure 4. MaSigPro clustering of differentially expressed microarray probes (p < 0.05) generated using RNA from growth hormone (solid thin line; GH) treated Longissimus Dorsi (LD) muscle, compared to non-treated controls (solid thick line).
Clustering of probes was conducted using a significance of p < 0.05 and a stringency R2 value of 0.2. The table of clustered microarray probes (A) displays the Probe ID (with gene name if known), the cluster group, and a grey square if that probe was also clustered in the equivalent analysis for beta-adrenergic agonist treated samples (see Fig. 3). The 12 clustered probe plots (B) display time on the x-axis (spanning the treatment duration of 1–27 days) with relative expression on the y-axis. Each plot depicts the expression profile of the microarray probes within that cluster for growth hormone (GH) treated and non-treated control animals. n = 10 for days 1, 3, 7 and 13, whilst n = 15 for day 27. Av. indicates average.
Figure 5
Figure 5. Validating expression of enzymes involved in the biosynthesis of anabolic intermediates to confirm genes that were identified as differentially expressed in the maSigPro clustering analysis.
Porcine Longissimus Dorsi muscle transcript abundance of the following genes was determined by quantitative-RT-PCR to establish the effects of a beta-adrenergic agonist (grey bars; BA) or recombinant growth hormone (black bars; GH) treatment for 1–27 days, compared to a control cohort (white bars; C); Phosphoglycerate Dehydrogenase: Phgdh (A), Phosphoserine aminotransferase: Psat1 (B), Phosphoserine Phosphatase: Psph (C), the mitochondrial isoform of phosphoenolpyruvate carboxykinase: Pck2 (D), the cytosolic isoform of phosphoenolpyruvate carboxykinase: Pck1 (E), the muscle isoform of Pyruvate Kinase variant 1: Pkm1 (L), and Pyruvate Kinase variant 2, Pkm2 (M). Representative western blots (F,G) and quantification (H,I) of beta-adrenergic agonist (BA) and growth hormone (GH) treatment effects on Longissimus Dorsi (LD) muscle protein expression of Phosphoglycerate Dehydrogenase: PHGDH, and mitochondrial isoform of phosphoenolpyruvate carboxykinase: PEPCK-M, following 3 (F,H) and 7 (G,I) days of treatment. Alpha-tubulin was used as a loading control. Relationship between PHGDH and PEPCK-M protein expression in porcine Longissimus Dorsi muscle following treatment with a beta-adrenergic agonist (grey circles), growth hormone (black circles) or no treatment (white circles) following 3 (J) and 7 (K) days. Data is mean ± SEM. n = 10 for days 1, 3, 7 and 13, whilst n = 15 for day 27. *Indicates a treatment effect with p < 0.001 (unless otherwise stated). #Indicates a treatment x time interaction with p < 0.001. a Indicates a treatment effect with p < 0.01. §Indicates a treatment effect with p < 0.05.
Figure 6
Figure 6. A schematic illustrating the relationship between glycolysis, the TCA cycle and pathways associated with serine/one-carbon/glycine (SOG) biosynthesis.
Bold black arrows indicate enzymes that were up-regulated at the mRNA (Pck2, Phgdh, Psat1, Psph) and/or protein level (PEPCK-M and PHGDH) by beta-adrenergic agonist treatment.

References

    1. Sandri M. Signaling in Muscle Atrophy and Hypertrophy. Physiology 23, 160–170 (2008). - PubMed
    1. Buttery P. J. & Dawson J. M. Growth promotion in farm animals. Proc. Nutr. Soc. 49, 459–66 (1990). - PubMed
    1. Lynch G. S. & Ryall J. G. Role of beta-adrenoceptor signaling in skeletal muscle: implications for muscle wasting and disease. Physiol. Rev. 88, 729–767 (2008). - PubMed
    1. Dunshea F. R., King R. H., Campbell R. G., Sainz R. D. & Kim Y. S. Interrelationships between sex and ractopamine on protein and lipid deposition in rapidly growing pigs. J. Anim. Sci. 71, 2919–30 (1993). - PubMed
    1. Boisclair Y. R., Bauman D. E., Bell A. W., Dunshea F. R. & Harkins M. Nutrient utilization and protein turnover in the hindlimb of cattle treated with bovine somatotropin. J Nutr 124, 664–673 (1994). - PubMed

Publication types

MeSH terms