. 2016 Jun 28:6:28646.
doi: 10.1038/srep28646.

Electroacupuncture ameliorates memory impairments by enhancing oligodendrocyte regeneration in a mouse model of prolonged cerebral hypoperfusion

Affiliations

Electroacupuncture ameliorates memory impairments by enhancing oligodendrocyte regeneration in a mouse model of prolonged cerebral hypoperfusion

Sung Min Ahn et al. Sci Rep. .

Abstract

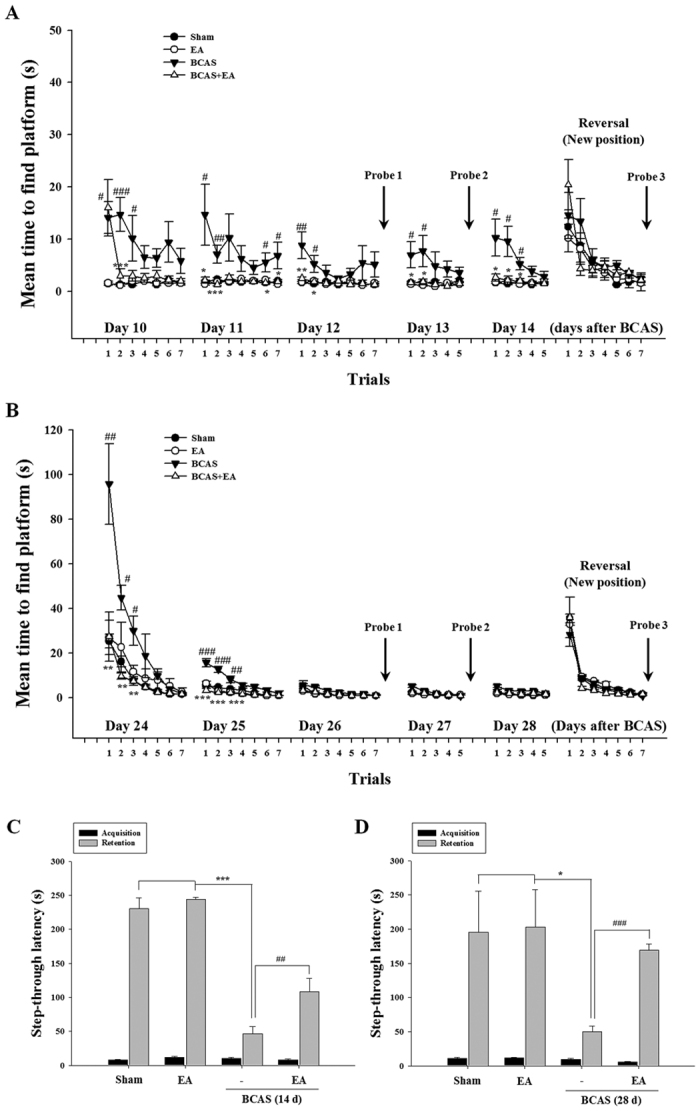
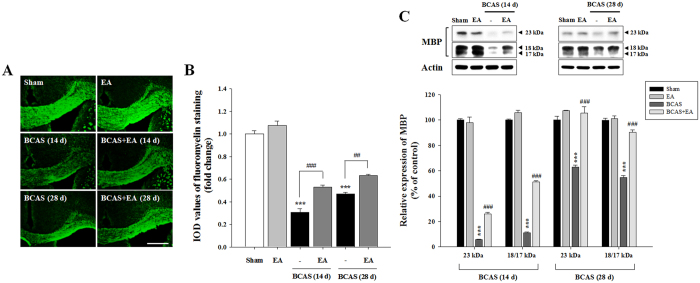
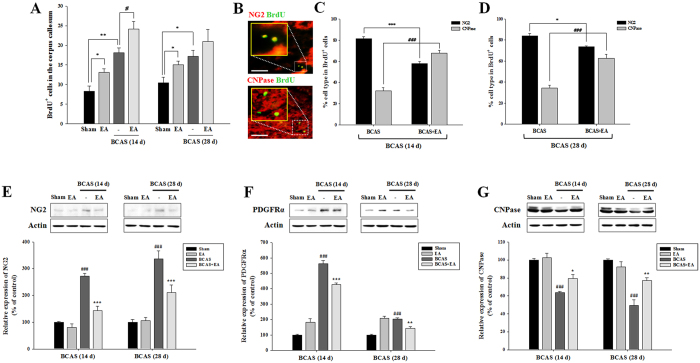
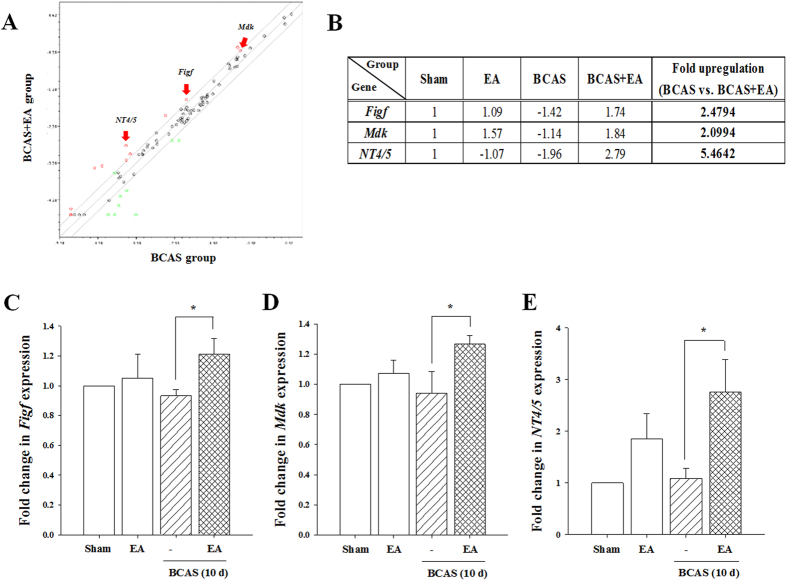
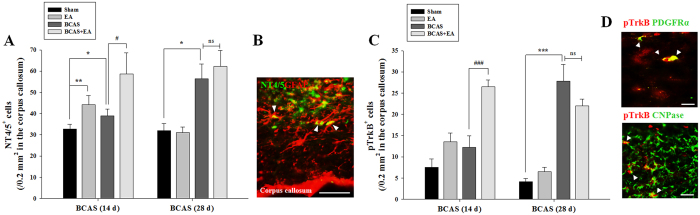
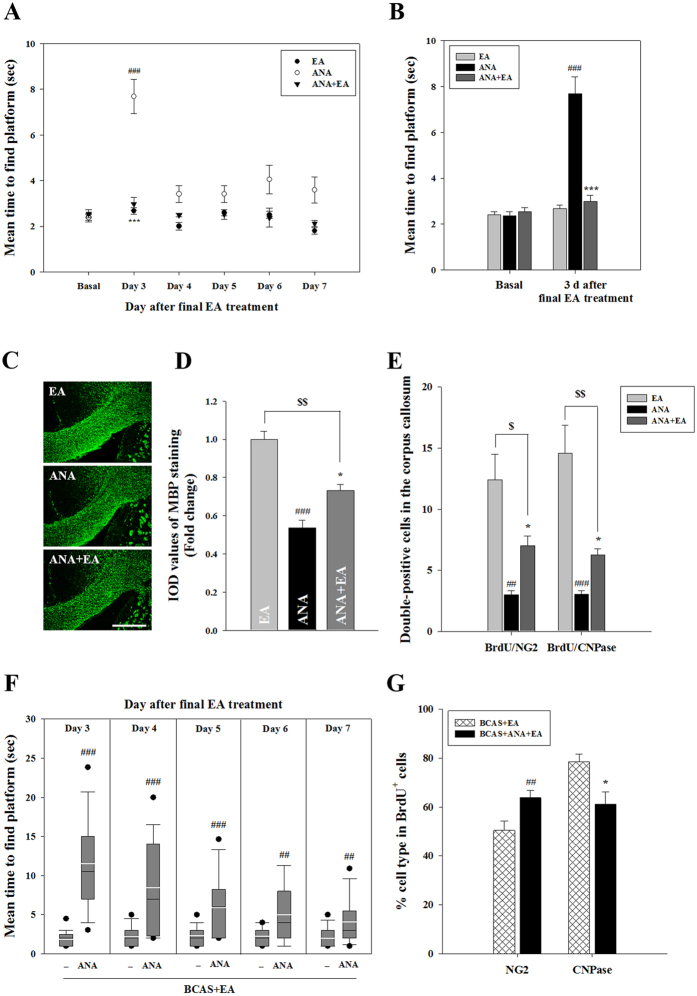
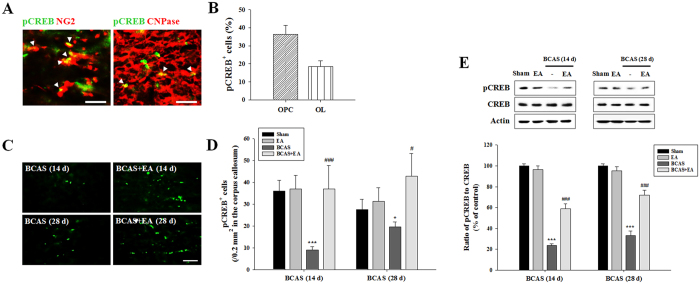
We modeled prolonged cerebral hypoperfusion in mice using bilateral common carotid artery stenosis (BCAS) and electroacupuncture (EA) stimulation was applied at two acupoints, Baihui (GV20) and Dazhui (GV14). In behavioral tests of memory, BCAS produced impairments in spatial and short-term memory in mice that were attenuated by therapeutic EA stimulation. Therapeutic use of EA in BCAS also enhanced oligodendrocyte (OL) differentiation from oligodendrocyte precursor cells (OPCs), in association with white matter improvements in the corpus callosum (CC). In PCR analyses of growth factor gene expression, significant positive changes in 3 genes were observed following EA stimulation in BCAS, and here we highlight alterations in neurotrophin-4/5 (NT4/5). We confirmed EA-mediated positive changes in the expression of NT4/5 and its receptor, tyrosine receptor kinase B (TrkB). Treatment of naïve and BCAS + EA animals with a selective TrkB antagonist, ANA-12, produced losses of myelin and cognitive function that were ameliorated by EA therapy. Moreover, following BCAS we observed an EA-dependent increase in phospho-activated CREB (a downstream mediator of NT4/5-TrkB signaling) in OPCs and OLs of the CC. Our results suggest that EA stimulation promotes the recovery of memory function following white matter injury via a mechanism that promotes oligodendrocyte regeneration and involves NT4/5-TrkB signaling.


Figures

Figure 1
Figure 1. EA stimulation improves cognitive impairments following prolonged cerebral hypoperfusion.
(A,B) Morris water maze test. Downward arrows indicate probe trials. #P < 0.05, ##P < 0.01, and ###P < 0.001 vs. sham control; *P < 0.05, **P < 0.01, and ***P < 0.001 vs. BCAS group. (C,D) Passive avoidance test. *P < 0.05 and ***P < 0.001 vs. sham control or EA group; ##P < 0.01 and ###P < 0.001 vs. BCAS group. Data expressed as the mean (±SEM).
Figure 2
Figure 2. EA stimulation ameliorates white matter injury in the corpus callosum following prolonged cerebral hypoperfusion.
(A,B) Representative fluoromyelin images at days 14 and 28 post-BCAS induction and histogram analyses. Scale bar = 400 μm. (C) Western blot images and histogram analyses of MBP expression at days 14 and 28 post-BCAS induction. The histogram indicates the mean (±SEM) for 3 independent experiments. ***P < 0.001 vs. sham control; ##P < 0.01 and ###P < 0.001 vs. BCAS group.
Figure 3
Figure 3. EA stimulation enhances OL differentiation from OPCs in association with recovered myelination in the corpus callosum.
(A) Numbers of BrdU-positive (BrdU+) cells at days 14 and 28 post-BCAS induction. Data expressed as the mean (±SEM). *P < 0.05 and **P < 0.01 vs. sham control; #P < 0.05 vs. BCAS group. (B) Double immunofluorescent staining for BrdU and NG2 (a marker for OPCs) or CNPase (a marker for OLs) in the sham control condition. Scale bar = 50 μm. (C,D) Ratio of BrdU/NG2 or BrdU/CNPase double-labeled cells in total BrdU+ cells at days 14 (C) and 28 (D) post-BCAS induction. Data expressed as the mean (±SEM). *P < 0.05, ***P < 0.001, or ###P < 0.001 vs. BCAS group. (E–G) Western blotting analysis of OPCs protein NG2 (E) or PDGFRα (F), and OLs protein CNPase (G) from corpus callosum lysates. Data expressed as the mean (±SEM). ###P < 0.001 vs. sham control; *P < 0.05, **P < 0.01, and ***P < 0.001 vs. BCAS group.
Figure 4
Figure 4. Gene expression profiles in corpus callosum extracts from BCAS and BCAS + EA groups.
Gene expression profiles were evaluated using the Mouse Growth Factors RT2 profiler PCR array. (A) Scatter plot summarizing gene expression analyses. The middle diagonal gray line indicates 1-fold change (no change of gene expression between both groups). Circles above this gray line indicate an increase gene expression, and circles below indicate a decrease in expression, BCAS + EA versus BCAS group. The two outer gray lines indicate a 2-fold change. The 11 red circles represent genes that showed a >2-fold incrsease in expression in the BCAS + EA versus BCAS group comparison. 3 genes (Figf, Mdk, and NT4/5) are indicated by arrows. (B) The table shows select genes (Figf, Mdk, and NT4/5), that demonstrated differential expression between the BCAS and BCAS + EA groups. Numbers in bold indicate upregulated genes. (C–E) Fold change in expression of the 3 selected genes as detected by quantitative real-time PCR analysis. Figf, c-fos induced growth factor; Mdk, midkine; NT4/5, neurotrophin-4/5. Data expressed as the mean (±SEM). *P < 0.05 vs. BCAS group.
Figure 5
Figure 5. EA stimulation promotes NT4/5-TrkB expression in the corpus callosum following prolonged cerebral hypoperfusion.
(A) Numbers of NT4/5-positive (NT4/5+) cells at days 14 and 28 post-BCAS induction. Data expressed as the mean (±SEM). *P < 0.05, and **P < 0.01 vs. sham control; #P < 0.05 vs. BCAS group. (B) NT4/5/GFAP double-labeled cells (arrowheads) in the BCAS + EA group at day 14. Scale bar = 50 μm. (C) Numbers of pTrkB-positive (pTrkB+) cells at days 14 and 28 post-BCAS induction. Data expressed as the mean (±SEM). ***P < 0.001 vs. sham control; ###P<0.001 vs. BCAS group. (D) pTrkB-positive cells with PDGFRα (a marker for OPCs) or CNPase (a marker for OLs) (arrowheads) in the BCAS + EA group at day 14 post-BCAS induction. Scale bar = 25 μm.
Figure 6
Figure 6. The effect of TrkB antagonist ANA-12 on the beneficial effects of EA.
(A-E) The effect of TrkB antagonist ANA-12 in naïve animals. (A,B) Morris water maze test. Mean time to locate the platform in the ANA-12 group was significantly reduced by EA treatment 3 days following the cessation of therapy. (C,D) Representative MBP-stained images of the corpus callosum and MBP histogram analysis. Data expressed as the mean (±SEM). ###P < 0.001, or $$P < 0.01 vs. EA group; *P < 0.05 vs. ANA-12 group. Scale bar = 400 μm. (E) Double immunofluorescent staining of BrdU and NG2 or CNPase in the corpus callosum. Data expressed as the mean (±SEM). ##P < 0.01, ###P < 0.001, $P < 0.05, and $$P < 0.01 vs. EA group; *P < 0.05 vs. ANA-12 group. (F,G) The effect of TrkB antagonist ANA-12 in BCAS + EA group. (F) Morris water maze test. ANA-12-treated BCAS + EA mice showed a significant increase in mean time to locate the platform compared to BCAS + EA mice. The box plot indicates the medians (black lines), the mean (white lines), 25th–75th percentiles (box), and 5th–95th percentiles (whiskers). (G) Double immunofluorescent staining of BrdU and NG2 or CNPase in the corpus callosum. Data expressed as the mean (±SEM). ##P < 0.01, ###P < 0.001 and *P < 0.05 vs. BCAS + EA group.
Figure 7
Figure 7. EA stimulation promotes CREB activation in the corpus callosum following prolonged cerebral hypoperfusion.
(A,B) Double immunofluorescent staining of pCREB and NG2 or CNPase in the sham control condition and histogram analysis of pCREB-positive cells also identified as OPCs and OLs. Arrowheads indicate double-labeled cells. Scale bar = 25 μm. (C,D) Numbers of pCREB-positive (pCREB+) cells at days 14 and 28 post-BCAS induction and pCREB histogram analysis. Scale bar = 100 μm. (E) pCREB Western blot images. The histogram indicates the mean (±SEM) of 3 independent experiments. Data expressed as the mean (±SEM). *P < 0.05, and ***P < 0.001 vs. sham control; #P < 0.05, or ###P < 0.001 vs. BCAS group.

References

    1. Iadecola C. The pathobiology of vascular dementia. Neuron 80, 844–866 (2013). - PMC - PubMed
    1. Ihara M. & Tomimoto H. Lessons from a mouse model characterizing features of vascular cognitive impairment with white matter changes. J. Aging Res. 2011, 978761 (2011). - PMC - PubMed
    1. Miyamoto N. et al.. Oxidative stress interferes with white matter renewal after prolonged cerebral hypoperfusion in mice. Stroke 44, 3516–3521 (2013). - PMC - PubMed
    1. Dong Y. F. et al.. Attenuation of brain damage and cognitive impairment by direct renin inhibition in mice with chronic cerebral hypoperfusion. Hypertension 58, 635–642 (2011). - PubMed
    1. Chen J. et al.. Increased oligodendrogenesis by humanin promotes axonal remyelination and neurological recovery in hypoxic/ischemic brains. Hippocampus 25, 62–71 (2015). - PubMed

Publication types

MeSH terms