. 2016 Jun 28:7:12076.
doi: 10.1038/ncomms12076.

miR-93 regulates Msk2-mediated chromatin remodelling in diabetic nephropathy

Affiliations

miR-93 regulates Msk2-mediated chromatin remodelling in diabetic nephropathy

Shawn S Badal et al. Nat Commun. .

Abstract

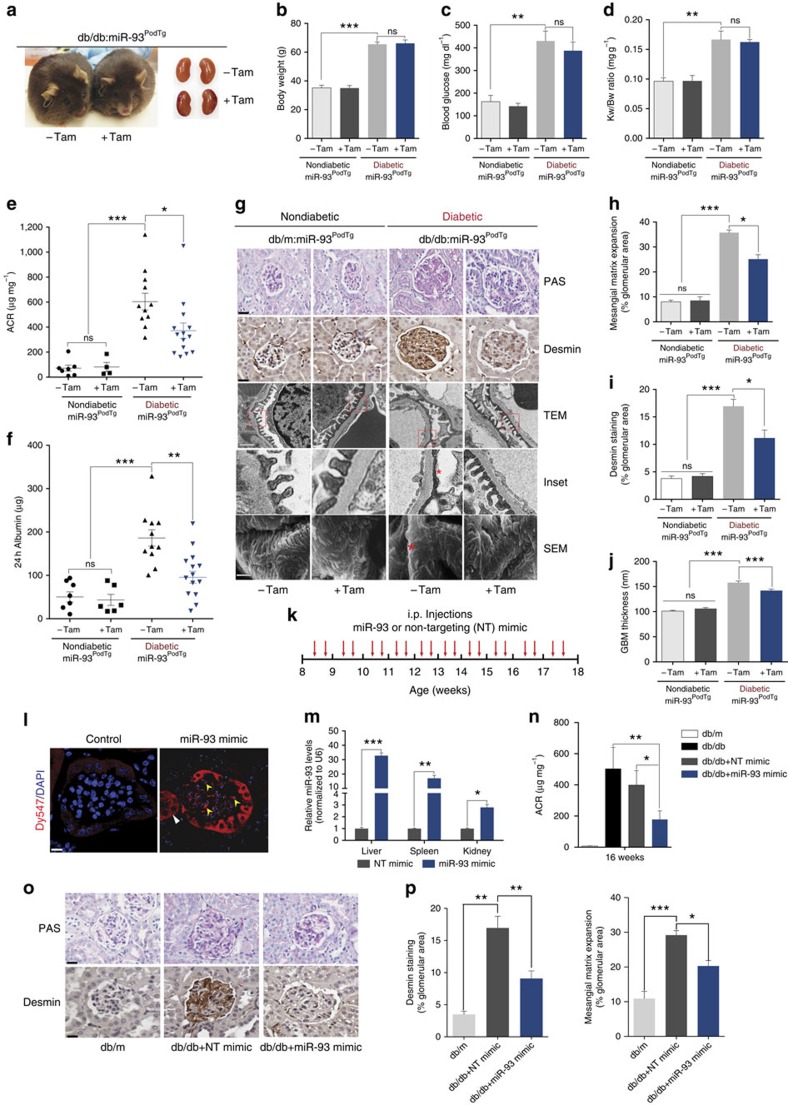
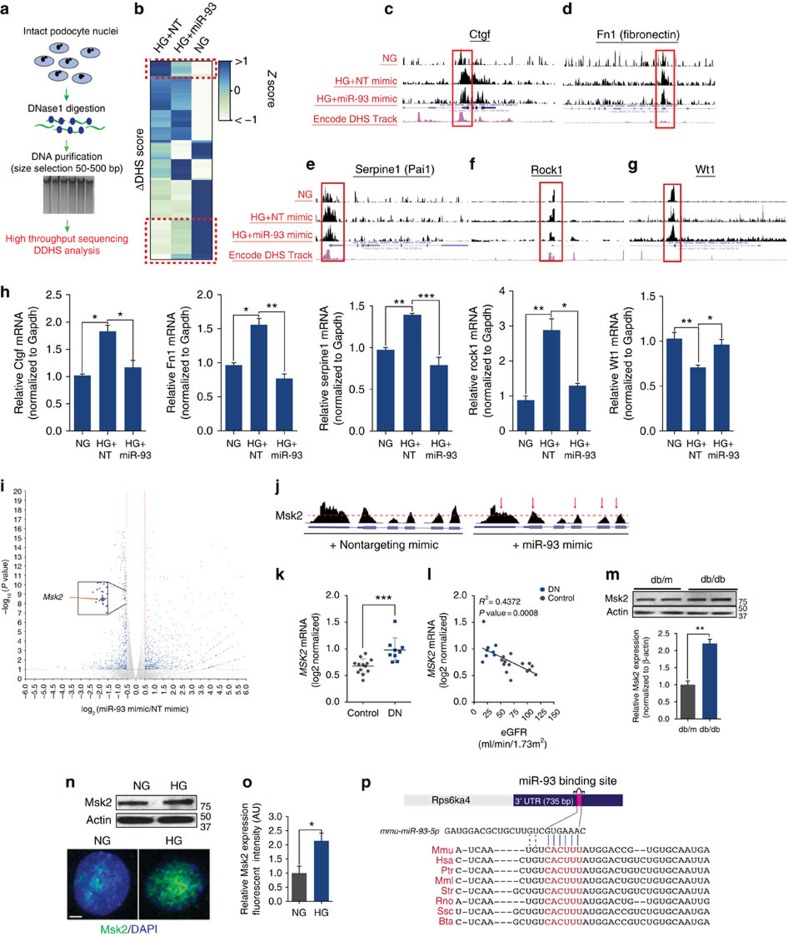
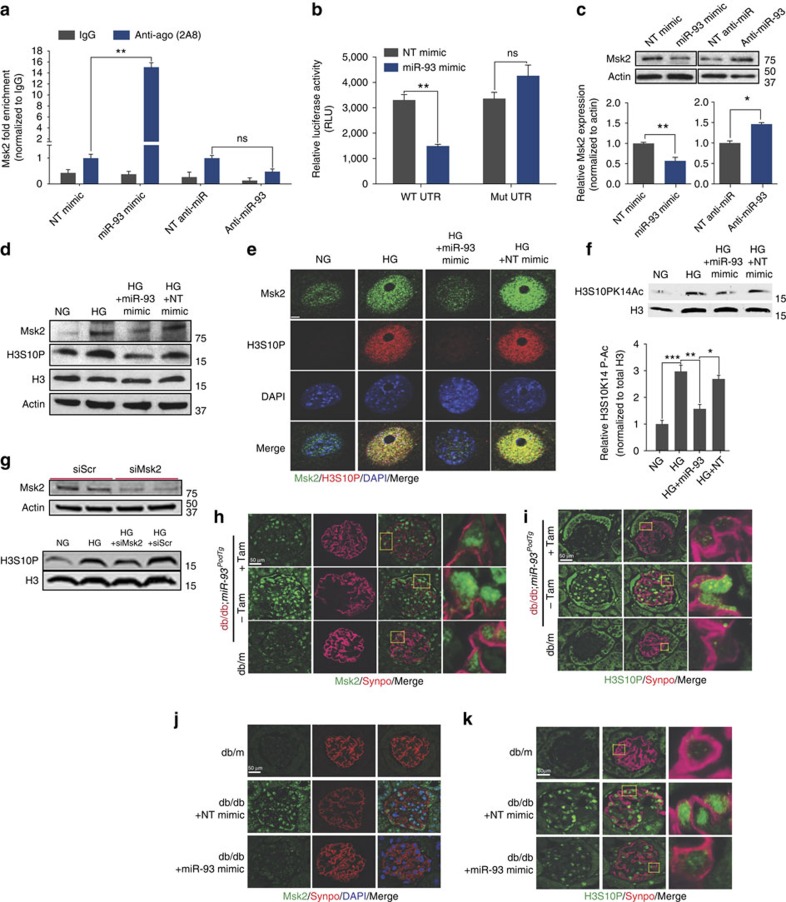
How the kidney responds to the metabolic cues from the environment remains a central question in kidney research. This question is particularly relevant to the pathogenesis of diabetic nephropathy (DN) in which evidence suggests that metabolic events in podocytes regulate chromatin structure. Here, we show that miR-93 is a critical metabolic/epigenetic switch in the diabetic milieu linking the metabolic state to chromatin remodelling. Mice with inducible overexpression of a miR-93 transgene exclusively in podocytes exhibit significant improvements in key features of DN. We identify miR-93 as a regulator of nucleosomal dynamics in podocytes. miR-93 has a critical role in chromatin reorganization and progression of DN by modulating its target Msk2, a histone kinase, and its substrate H3S10. These findings implicate a central role for miR-93 in high glucose-induced chromatin remodelling in the kidney, and provide evidence for a previously unrecognized role for Msk2 as a target for DN therapy.


Figures

Figure 1
Figure 1. Characterization of mice with inducible expression of miR-93 in podocytes.
(a) Schematic design of the LB2-FLIP-GFP-miR-93Tg lentivirus used to generate floxed miR-93Tg mice. The construct was designed so that Cre induction could be used to mediate the inversion of pre-miR-93 into a sense orientation. Construct elements: LTR: long terminal repeat, Pur: puromycin, Ubic: Ubiquitin-C promoter, bGHpA: bovine growth hormone polyadenylation signal; and insulator elements (SAR: scaffold attached regions, WPRE: Woodchuck hepatitis virus post-transcriptional response element, and #40 element). (b) Immunofluorescence micrographs of kidney sections collected from control (sesame oil) or tamoxifen-injected mTmG/+; Pod-CreERT2 reporter mice. Scale bars, 50 μM. (c) Flow cytometry analysis of kidney single cell suspension from control or tamoxifen-injected mTmG/+; Pod-iCreERT2 mice (n=3 mice/group). (d) Breeding scheme that was used to generate db/db:miR-93PodTg mice. (e) Top, representative genotyping PCR detecting transgenic miR-93, transgenic Pod-iCreERT2, and db alleles. Boxes highlight representative genotypes from mice carrying the three desired alleles. Bottom, a representative image of miR-93PodTg mice with or without tamoxifen injections. (f) qPCR analysis for miR-93 expression levels in mouse podocytes isolated from control or tamoxifen-injected miR-93PodTg mice. All values normalized to U6 snRNA internal controls. (n=6 mice/group). (g) Top, representative light micrographs of miR-93PodTg kidney sections stained with PAS from control or tamoxifen-treated mice. Bottom, representative transmission electron micrographs of miR-93PodTg kidneys from control or tamoxifen-treated mice. Scale bars denote 50 μM and 500 nm, respectively. (hk) Baseline phenotyping of control mice and tamoxifen-injected miR-93PodTg mice for (h) body weight, (i) blood glucose, (j) ACR and (k) systolic blood pressure (n=5 mice/group). Data expressed as mean±s.e.m. ns: no significance, *P<0.05. Student's t-test was employed for comparisons between two groups.
Figure 2
Figure 2. miR-93 overexpression attenuates features associated with DN.
(a) Representative images of db/db:miR-93PodTg mice and kidneys from control and tamoxifen-injected groups at 24 weeks of age. (bd) Phenotyping of non-diabetic miR-93PodTg from control (n=7) and tamoxifen-injected mice (n=6) and diabetic miR-93PodTg mice from control (n=11) and tamoxifen-injected (n=14) (b) body weight, (c) blood glucose and (d) kidney weight/body weight (KW/BW) ratio. (e) ACR of non-diabetic miR-93PodTg from control (n=7) and tamoxifen-injected mice (n=6) and diabetic miR-93PodTg mice from control (n=11) and tamoxifen-injected (n=14). (f) The 24-h albumin excretion rate (AER) from mice as in (e). (g) Representative images of PAS staining (first row); desmin staining (second row); TEM micrographs (third and fourth rows with magnified inset) and SEM micrographs (fifth row). Red asterisks on TEM and SEM micrographs denote effaced podocyte foot processes. Scale bars denote 50 μM (first row); 200 μM (second row); 0.5 μM (third row); and 1 μM (fourth row). (h) Quantification of mesangial matrix expansion, (i) glomerular area positive for desmin staining, and (j) GBM thickness in non-diabetic and diabetic miR-93PodTg mice from control and tamoxifen-injected groups. (n=4–7 mice/group). (k) miRNA mimics injection protocol. (l) Fluorescent micrographs of kidney sections from vehicle-injected and 3′-Dy547-miR-93 mimic-injected mice. White arrows specify tubular localization and yellow arrows specify glomerular localization. Scale bars, 50 μM. (m) qRT-PCR analysis of liver, spleen and kidney RNAs from NT mimic and miR-93 mimic-injected mice. All values were normalized to U6 snRNA internal controls (n=3 mice/group). (n) ACR measurements at 16 weeks of age in listed groups (n=8 mice/group). (o) Top, representative PAS staining of kidney sections and bottom, representative desmin staining, respectively of kidney sections from each group. Scale bars denote 50 μM and 200 μM, respectively. (p) Quantification of mesangial matrix index and glomerular area positive for desmin staining for each group (n=8 mice/group). Data expressed as mean±s.e.m. ns: no significance, *P<0.05, **P<0.01. one-way analysis of variance with Tukey's post test for multiple comparisons was used for groups of three or more.
Figure 3
Figure 3. RNA-seq analysis implicates miR-93 in chromatin remodelling.
(a) Top, human miR-93 localized to intron 13 of the MCM7 gene on chromosome 7. Bottom, sequence conservation of the mature miR-93 sequence in several species. Hsa: Homo Sapien, Mmu: Mus musculus, Rno: Rattus norvegicus, Dre: Danio rerio, Bta: Bos taurus, Rhe: Rhesus (b) MCM7 expression values in patients with DN for two independent gene array probes obtained from publicly available datasets from Nephroseq (www.nephroseq.org). Data expressed as log2 median-centered intensity values. (c) miR-93 expression level in biopsy samples from control (n=8) and DN patients (n=7). (d) Left, experimental approach employed to generate transcriptome-wide RNA-Seq data. Right, heatmap of differentially regulated genes in NT and miR-93 mimic transfected podocytes. Heatmaps represents hierarchical clustering of the genes, which were significantly differentially regulated (log2 FC±1.0) .(e,f) GSEA analysis of (e) significantly upregulated and (f) significantly downregulated genes upon miR-93 overexpression in mouse podocytes (k/K indicates the number of miR-93 responsive genes over the number of genes in a given gene set). Red highlighted gene sets suggest that miR-93 may play a role in modulating expression of genes regulated by various chromatin remodelers. Data expressed as mean±s.e.m. ns: no significance, *P<0.05, **P<0.01, ***P<0.001. Student's t-test was employed for comparisons between two groups. Cuffdiff2 was used to identify features differentially expressed between conditions for RNA-Seq analysis. A 0.05 false discovery rate was used in selecting significant genes. To further define differentially regulated genes, a cutoff of −log10 (P value) >1 and a log2 fold change (FC) of <0.5 or >0.5 was employed.
Figure 4
Figure 4. HG-induced chromatin remodelling is reversed by miR-93 overexpression.
(a) Experimental approach employed for DNase-Seq. (b) Hierarchical clustering analysis of ΔDHS scores for NG, HG+ NT mimic, and HG+ miR-93 mimics. Dashed red lines surround regions that demonstrate a reversal in HG-induced changes in hypersensitivity, following miR-93 overexpression. P value <0.05 for all comparisons. (cg) Examples of chromatin accessibility that highlight differences in DNase hypersensitivity at the (c) Ctgf, (d) Fn1, (e) Serpine1 (f) Rock1 and (g) Wt1 loci. As reference, DHS signal tracks from the Encode project are depicted in pink. Each data track shows tag density from DNase-Seq assays from podocytes treated with NG, HG+NT mimics or HG+miR-93 mimics (h) Gene expression analysis of the aforementioned genes. All values normalized to internal Gapdh controls. (i) Volcano plot highlighting differentially regulated genes by miR-93. (j) mRNA tag density at exons 13–18 and 3′-UTR of murine Msk2 in podocytes transfected with miR-93 mimics or NT controls. (k) MSK2 expression values from patients with DN obtained from publicly available datasets from Nephroseq (nephroseq.org). Data expressed as log2 median-centered intensity values. (l) Linear regression analysis of relative Msk2 mRNA levels from patients in (k) correlated with estimated glomerular filtration rate values obtained from Nephroseq. (m) Top, western blot and densitometric quantification of total Msk2 expression levels in podocytes isolated from 24-week-old db/m and db/db mice, (n=5 mice/group). (n) Top, western blot of total Msk2 expression levels from whole cell lysates in podocytes cultured under NG or HG conditions. Bottom, immunofluorescence micrographs from podocytes cultured in NG or HG conditions. Scale bar, 10 μm. (o) Quantification of nuclear fluorescent intensity of Msk2 expression in podocytes cultured under NG or HG conditions. (p) Evolutionary conservation of the miR-93 seed site within the 3′-UTR of Msk2. Mmu: Mus musculus, Hsa: Homo sapiens, Ptr: Pan troglodytes, Mml: Macaca multta, Str: Spermophilus tridecemlineatus, Rno: Rattus norvegicus, Ssc: Sus scrofa, Bta: Bos taurus. Data expressed as mean±s.e.m. ns: no significance, *P<0.05, **P<0.01, ***P<0.001. Student's t-test was employed for comparisons between two groups, one-way analysis of variance with Tukey's post test for multiple comparisons was used for groups of three or more.
Figure 5
Figure 5. miR-93 targets Msk2.
(a) Msk2 RNA in RISC complexes from RNA-immunoprecipitation experiments in mouse podocytes transfected with miR-93 mimics or anti-miR-93. (b) Luciferase activity in HEK293T cells co-transfected with either 3.1-luc-Msk2 wild-type 3′-UTR (WT-UTR) or a 3.1-luc-Msk2 mutant 3′ UTR (Msk2 mut) and NT or miR-93 mimics, respectively. Luciferase activity levels were normalized to β-gal activities. (c) Western blot and corresponding densitometric analysis for total Msk2 expression in podocytes transfected with miR-93 mimics or anti-miR-93 inhibitors. (d) Western blot analysis from HG-cultured podocytes transfected with miR-93 mimic or a NT mimic with antibodies directed against Msk2, H3S10P, total H3 and actin. (e) Immunofluorescence against H3S10P and Msk2 in HG-cultured podocytes transfected with miR-93 mimic or a NT mimic. Scale bar, 10 μm. (f) Western blot analysis of cultured podocytes exposed to HG and transfected with miR-93 mimic or a NT mimic with bivalent antibodies against H3S10K14-P-Ac and total H3. (g) Top panel, western blot analysis of Msk2 protein levels in podocytes transfected with a NT siRNA or siRNA specific to Msk2. Bottom panel, western blot analysis of H3S10P and total H3 protein levels in podocytes transfected with siMsk2 or siScr in HG conditions. (h,i) Representative immunofluorescence micrographs of kidney sections from db/m (n=3), control db/db;miR-93PodTg (n=4) and tamoxifen-induced db/db;miR-93PodTg mice (n=4) stained with anti-Synaptopodin and anti-Msk2 or anti-H3S10P antibodies. Sections were counterstained with DAPI. Sections were counterstained with DAPI (j,k) Representative immunofluorescence micrographs of kidney sections from db/m control (n=2) and db/db mice allocated to miR-93 mimic (n=3) or NT mimic (n=3) injections with anti-synaptopodin, anti-Msk2 and/or anti-H3S10P antibodies. Merged images are meant to highlight podocyte-specific staining and insets are meant to highlight podocyte-specific localization of Msk2 or H3S10. Sections were counterstained with DAPI. h–k Scale bars, 50μm. Data expressed as mean±s.e.m. ns: no significance, *P<0.05, **P<0.01, ***P<0.001. Student's t-test was employed for comparisons between two groups; one-way analysis of variance with Tukey's post test for multiple comparisons was used for groups of three or more.
Figure 6
Figure 6. Targeting Msk2 in vivo prevents progression of DN.
(a) Left, representative western blot analysis for Msk2 levels in podocytes isolated from non-diabetic (db/m) (n=4), db/db+shCtl (n=3), and db/db+shMsk2 (n=5) mice treated with shMsk2. Right, densitometric quantification of western blots to quantify Msk2 levels. (b) ACR of non-diabetic (db/m), db/db+shCtl (n=3) and db/db+shMsk2 (n=5). (c) Representative images of TEM micrographs, PAS staining and WT1 staining from shMsk2-treated mice. Scale bars, 0.5 μM (first column) or 50 μM (second and third columns). (dh) Quantification of (d) mesangial matrix expansion, (e) WT1+ cells, (f) GBM thickness, (g) Foot process density and (h) Foot process width in shMsk2-treated mice and controls. (i) Representative immunofluorescence micrographs of kidney sections from shMsk2-treated mice and controls from a, stained with anti-synaptopodin and anti-H3S10P. Sections were counterstained with DAPI. Merged images are meant to highlight podocyte-specific staining and insets are meant to highlight podocyte-specific localization of H3S10P. Scale bars, 50 μM. (j) qPCR analysis of podocyte-specific genes, Wt1, podocin and nephrin from podocytes isolated from shMsk2-treated mice and controls. All expression values were normalized to Gapdh internal controls. (k) Schematic describing mode of action and general design of LNA-modified long RNA gapmers (l) Top, western blot analysis of podocytes transfected with Msk2 or Scramble, negative control gapmers with antibodies directed against Msk2, Msk1 and actin. Bottom, study design used for the administration of Msk2 or Scramble, negative control gapmers in db/db mice. (m) Western blot analysis of kidney cortices from db/m and db/db mice administered gapmers directed against Msk2 or Scramble, negative control gapmers, all values normalized to actin (n=5 mice/group). (n) ACR of non-diabetic (db/m), db/db mice administered gapmers directed against Msk2 or Scramble, negative control gapmers (n=5 mice/group). (o) ACR of 24-week-old db/m;Msk2+/+ (n=3), db/m;Msk2−/− (n=5), db/db;Msk2+/+ (n=6), and db/db;Msk2−/− (n=6) mice. Data expressed as mean±s.e.m. ns: no significance, *P<0.05, **P<0.01, ***P<0.001. One-way analysis of variance with Tukey's post test for multiple comparisons was used for groups of three or more.

Comment in

References

    1. U.S. Renal Data System. USRDS 2013 Annual Data Report: Atlas of Chronic Kidney Disease and End-Stage Renal Disease in the United States. (National Institutes of Health, National Institute of Diabetes and Digestive and Kidney Diseases, 2013).
    1. Grueter C. E. et al. A cardiac microRNA governs systemic energy homeostasis by regulation of MED13. Cell 149, 671–683 (2012). - PMC - PubMed
    1. van Rooij E. et al. Control of stress-dependent cardiac growth and gene expression by a microRNA. Science 316, 575–579 (2007). - PubMed
    1. Trajkovski M. et al. MicroRNAs 103 and 107 regulate insulin sensitivity. Nature 474, 649–653 (2011). - PubMed
    1. Calin G. A. et al. Frequent deletions and down-regulation of micro- RNA genes miR15 and miR16 at 13q14 in chronic lymphocytic leukemia. Proc. Natl Acad. Sci. USA 99, 15524–15529 (2002). - PMC - PubMed

Publication types