. 2016 Oct;64(4):1202-1216.
doi: 10.1002/hep.28704. Epub 2016 Jul 30.

Inhibition of mast cell-secreted histamine decreases biliary proliferation and fibrosis in primary sclerosing cholangitis Mdr2(-/-) mice

Affiliations

Inhibition of mast cell-secreted histamine decreases biliary proliferation and fibrosis in primary sclerosing cholangitis Mdr2(-/-) mice

Hannah Jones et al. Hepatology. 2016 Oct.

Abstract

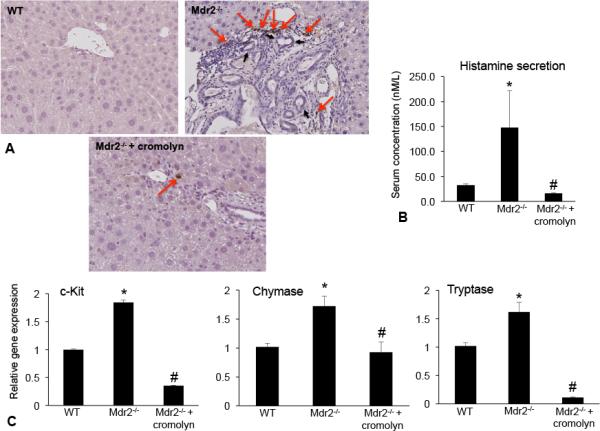
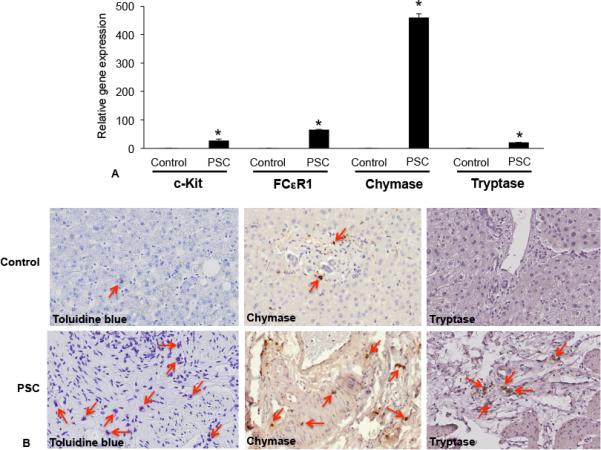
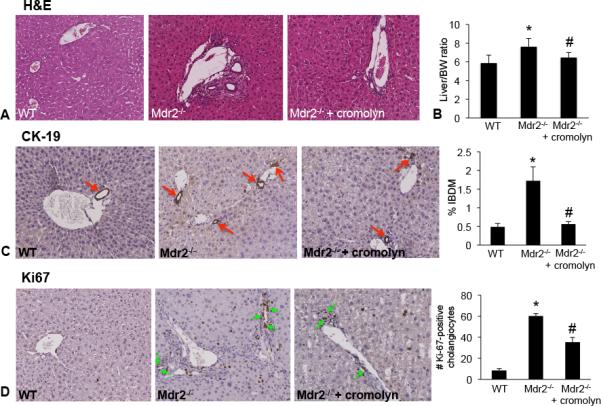
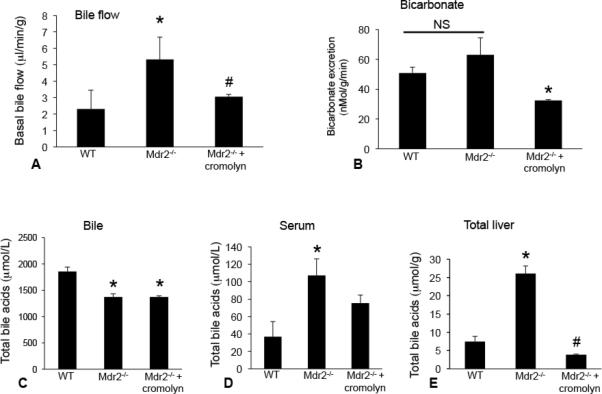
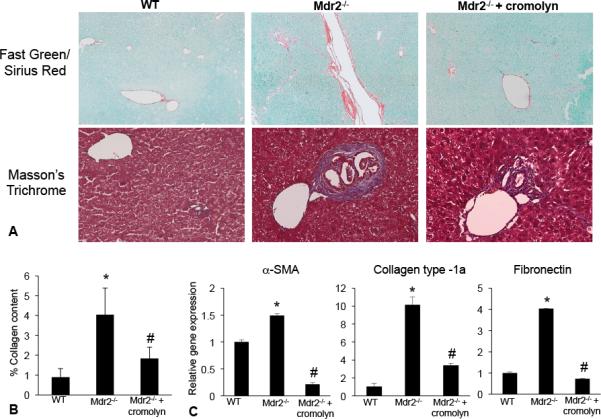
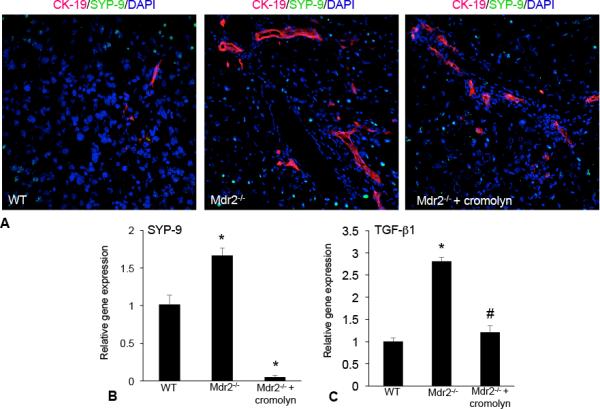
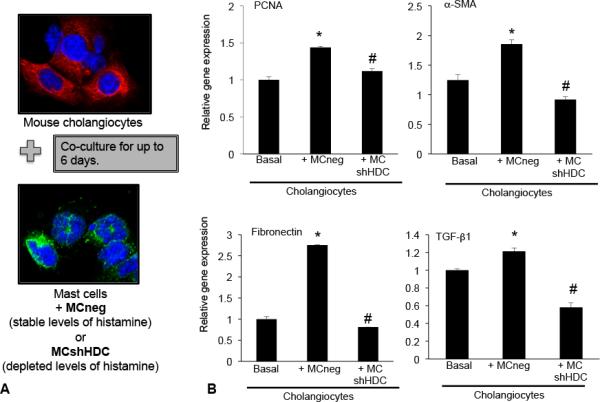
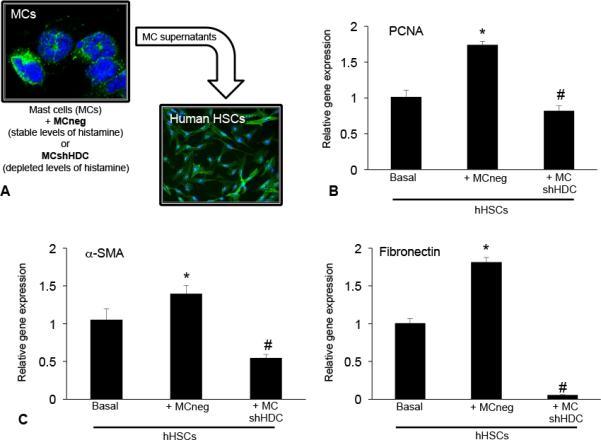
Hepatic fibrosis is marked by activation of hepatic stellate cells (HSCs). Cholestatic injury precedes liver fibrosis, and cholangiocytes interact with HSCs promoting fibrosis. Mast cells (MCs) infiltrate following liver injury and release histamine, increasing biliary proliferation. We evaluated if inhibition of MC-derived histamine decreases biliary proliferation and fibrosis. Wild-type and multidrug resistance 2 knockout mice (9-11 weeks) were treated with cromolyn sodium for 1 week to block MC-derived histamine. Biliary mass and proliferation were evaluated by immunohistochemistry for cytokeratin 19 and Ki-67. Bile flow, bicarbonate excretion, and total bile acids were measured in all mice. Fibrosis was evaluated by sirius red/fast green staining and by quantitative polymerase chain reaction for alpha-smooth muscle actin, fibronectin, collagen type 1a, and transforming growth factor-beta 1. HSC activation was evaluated by quantitative polymerase chain reaction in total liver and immunofluorescent staining in tissues for synaptophysin 9. Histamine serum secretion was measured by enzymatic immunoassay. Mouse liver and human liver samples from control or primary sclerosing cholangitis patients were evaluated for MC markers by quantitative polymerase chain reaction and immunohistochemistry. In vitro, cultured MCs were transfected with histidine decarboxylase short hairpin RNA to decrease histamine secretion and subsequently cocultured with cholangiocytes or HSCs prior to measuring fibrosis markers, proliferation, and transforming growth factor-beta 1 secretion. Treatment with cromolyn sodium decreased biliary proliferation, fibrosis, histamine secretion, and bile flow in multidrug resistance 2 knockout mice. Primary sclerosing cholangitis mice and patients have increased MCs. Knockdown of MC histidine decarboxylase decreased cholangiocyte and HSC proliferation/activation.

Conclusion: MCs are recruited to proliferating cholangiocytes and promote fibrosis. Inhibition of MC-derived histamine decreases fibrosis, and regulation of MC mediators may be therapeutic for primary sclerosing cholangitis. (Hepatology 2016;64:1202-1216).


Figures

Figure 1
Figure 1
Mast cells were found in close proximity to bile ducts in Mdr2−/− mice. (A) The number of mMCPT-1-positive mast cells (found close to large bile ducts) increased in Mdr2−/− mice compared to WT and treatment with cromolyn sodium decreased the number of infiltrating mast cells. (A) Mast cells are indicated with red arrows and large bile ducts are marked with black arrows. Images are 20× magnification. Histamine secretion was measured by EIA in serum from WT, Mdr2−/− and Mdr2−/− + cromolyn sodium. (B) Histamine levels increased in Mdr2−/− mice, but decreased in Mdr2−/− mice treated with cromolyn sodium compared to WT. (C) c-Kit, chymase and tryptase gene expression are increased in Mdr2−/− mice compared to WT, whereas treatment with cromolyn sodium decreased the gene expression in Mdr2−/− mice. Data are expressed as mean ± SEM of at least 6 experiments for real-time PCR and 12 experiments for EIA. *p<0.05 versus WT mice; #p<0.05 versus Mdr2−/− mice.
Figure 2
Figure 2
Mast cell presence was assessed in human liver biopsy samples from control (no disease) and PSC patients (late and advanced PSC) by real-time PCR, toluidine blue staining and immunohistochemistry for mast cell markers (chymase and tryptase). (A) The gene expression of c-Kit, FCεR1, chymase and tryptase increased in samples from advanced and late stage PSC when compared to normal, non-diseased tissues. (B) By immunostaining (toluidine blue) and immunohistochemistry (chymase and tryptase), there is an infiltration of mast cells found surrounding damaged bile ducts in PSC patients compared to normal tissue (red arrows depict mast cells). Data are expressed as mean ± SEM of at least 6 experiments for real-time PCR. *p<0.05 versus control. Images are 20× magnification
Figure 3
Figure 3
(A) Liver damage was assessed by H&E staining in liver sections from all groups. Inflammation, necrosis and lobular damage increased in Mdr2−/− mice compared to WT mice and these features were reduced in Mdr2−/− mice treated with cromolyn sodium. Images are 20× magnification. (B) Liver weight and body weights were recorded for each animal and the ratio was calculated. Mdr2−/− mice have increased liver/BW ratio compared to WT and treatment with cromolyn sodium significantly decreases liver/BW ratio compared to Mdr2−/−. (C) Bile duct mass and (D) Ki-67 were evaluated in liver sections from WT, Mdr2−/− mice and Mdr2−/− mice treated with cromolyn sodium. We found that bile duct mass (CK-19 staining, red arrows) and Ki-67 increased in Mdr2−/− mice compared to WT mice, whereas treatment with cromolyn sodium decreased both bile duct mass (red arrows) and the number of proliferating cholangiocytes (green arrows). Data has been semi-quantitated. Data are expressed as mean ± SEM of at least 10 experiments. *p<0.05 versus WT mice; #p<0.05 versus Mdr2−/− mice.
Figure 4
Figure 4
In vivo, we measured the effects of cromolyn sodium treatment on bile flow, bicarbonate excretion and total bile acid (TBA) concentration. In Mdr2−/− mice there was increased bile flow; however, treatment with cromolyn sodium significantly reduced bile flow (A). Bicarbonate excretion was unchanged between WT and Mdr2−/− mice (NS = not significant), but was reduced in Mdr2−/− mice treated with cromolyn sodium compared to Mdr2−/− mice (B). Total bile acid composition in bile was reduced in Mdr2−/− mice treated with or without cromolyn sodium compared to WT (C), whereas serum bile acids (D) and total liver homogenate bile acids (E) were increased in Mdr2−/− mice compared to WT and treatment with cromolyn sodium decreased both serum and total liver homogenate bile acid levels. Data are expressed as mean ± SEM of at least 6 experiments from each animal for bile flow; 6 experiments from each animal for bicarbonate excretion, 4 experiments for bile TBA, 10 experiments for serum TBA and 4 experiments for total liver TBA. *p<0.05 versus WT; #p<0.05 versus Mdr2−/− mice.
Figure 5
Figure 5
Fibrosis and collagen content was evaluated by immunostaining and real-time PCR in WT, Mdr2−/− mice and Mdr2−/− mice treated with cromolyn sodium. (A) Staining for Fast Green/Sirius Red and Masson's Trichrome demonstrate an increase in collagen content in Mdr2−/− mice compared to WT. (B) Treatment with cromolyn sodium decreased collagen content and the fibrotic reaction in Mdr2−/− mice as shown by semi-quantification of Fast Green/Sirius Red staining. (C) The expression of α-SMA, collagen-type 1a and fibronectin were increased in total liver mRNA from Mdr2−/− mice compared to WT and treatment with cromolyn sodium decreased these fibrotic genes. Data are expressed as mean ± SEM of at least 9 experiments. *p<0.05 versus WT mice; #p<0.05 versus Mdr2−/− mice. Images are 20× magnification.
Figure 6
Figure 6
HSC activation was evaluated by immunofluorescence and real-time PCR for the expression of SYP-9 in WT, Mdr2−/− mice and Mdr2−/− mice treated with cromolyn sodium. (A) SYP-9 expression (green staining) was increased in Mdr2−/− mice compared to WT; whereas, treatment with cromolyn sodium decreased SYP-9 expression in Mdr2−/− mice (bile ducts are depicted by red staining). (B) Further, the gene expression of SYP-9 increased in total liver mRNA from Mdr2−/− mice compared to WT and treatment with cromolyn sodium decreased SYP-9 expression. The expression of TGF-β1 was measured by real-time PCR in total liver from WT, Mdr2−/− mice and Mdr2−/− mice treated with cromolyn sodium. (C) TGF-β1 expression significantly increased in total liver mRNA from Mdr2−/− mice compared to WT and decreased after treatment with cromolyn sodium. Data are expressed as mean ± SEM of at least 6 experiments for real-time PCR. *p<0.05 versus WT mice; #p<0.05 versus Mdr2−/− mice.
Figure 7
Figure 7
(A) In vitro, we measured the effects of mast cells transfected with empty vector (MCneg) or HDC shRNA (MCshHDC) on cholangiocytes in culture. (B) Following co-culture with mast cells containing stable levels of histamine (MCneg), cholangiocyte PCNA, fibronectin and α-SMA expression are increased; whereas, in cholangiocytes co-cultured with mast cells containing depleted levels of histamine (MCshHDC), these parameters were decreased. (B) TGF-β1 gene expression was increased in cholangiocytes co-cultured with MCneg compared to basal and was decreased when cholangiocytes were co-cultured with MCshHDC. Data are expressed as mean ± SEM of at least 6 experiments for EIA and real-time PCR. *p<0.05 versus basal cholangiocytes; #p<0.05 versus MCneg.
Figure 8
Figure 8
(A) In vitro, we measured the effects of mast cells transfected with empty vector (MCneg) or HDC shRNA (MCshHDC) on human HSCs (hHSCs) in culture. Following stimulation with supernatants from mast cells containing stable levels of histamine (MCneg), (B) hHSC PCNA, (C) α-SMA and fibronectin expression are increased; whereas, in hHSCs stimulated with supernatants from mast cells containing depleted levels of histamine (MCshHDC), these parameters were decreased. Data are expressed as mean ± SEM of at least 4 experiments for EIA and real-time PCR. *p<0.05 versus basal hHSCs; #p<0.05 versus MCneg.

References

    1. Penz-Osterreicher M, Osterreicher CH, Trauner M. Fibrosis in autoimmune and cholestatic liver disease. Best Pract Res Clin Gastroenterol. 2011;25:245–258. - PMC - PubMed
    1. Angulo P, Peter JB, Gershwin ME, DeSotel CK, Shoenfeld Y, Ahmed AE, Lindor KD. Serum autoantibodies in patients with primary sclerosing cholangitis. J Hepatol. 2000;32:182–187. - PubMed
    1. Osterreicher CH, Trauner M. Animal models of biliary tract injury. Curr Opin Gastroenterol. 2012;28:239–243. - PubMed
    1. Lazaridis KN, Strazzabosco M, Larusso NF. The cholangiopathies: disorders of biliary epithelia. Gastroenterology. 2004;127:1565–1577. - PubMed
    1. Trauner M, Fickert P, Wagner M. MDR3 (ABCB4) defects: a paradigm for the genetics of adult cholestatic syndromes. Semin Liver Dis. 2007;27:77–98. - PubMed

Substances