

Regional distributions of brain glutamate and glutamine in normal subjects
- PMID: 27351339
- PMCID: PMC4962701
- DOI: 10.1002/nbm.3575
Regional distributions of brain glutamate and glutamine in normal subjects
Abstract
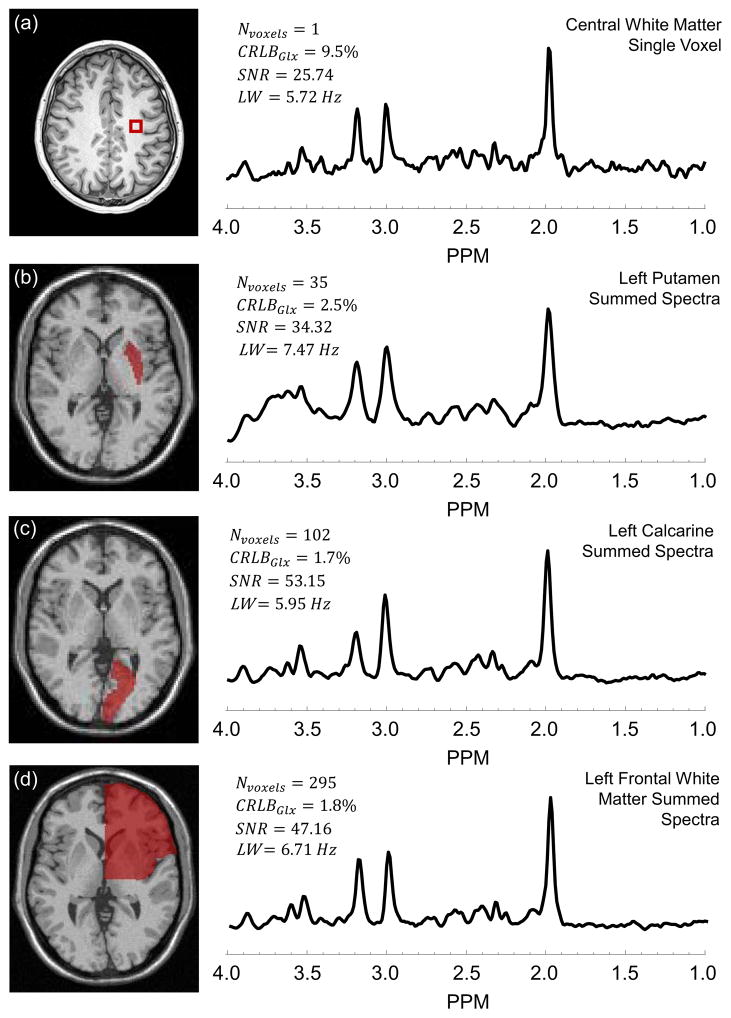
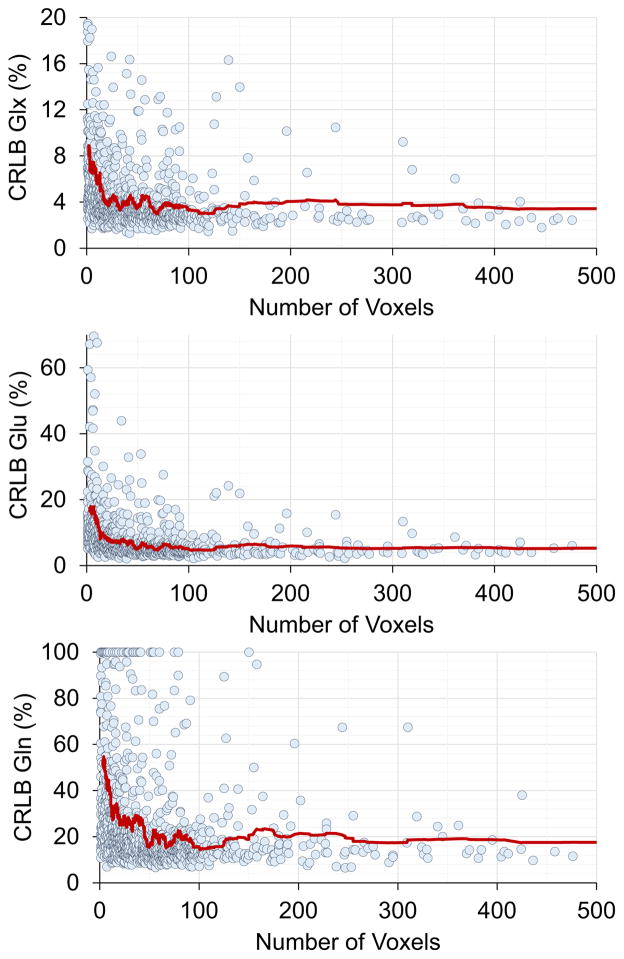
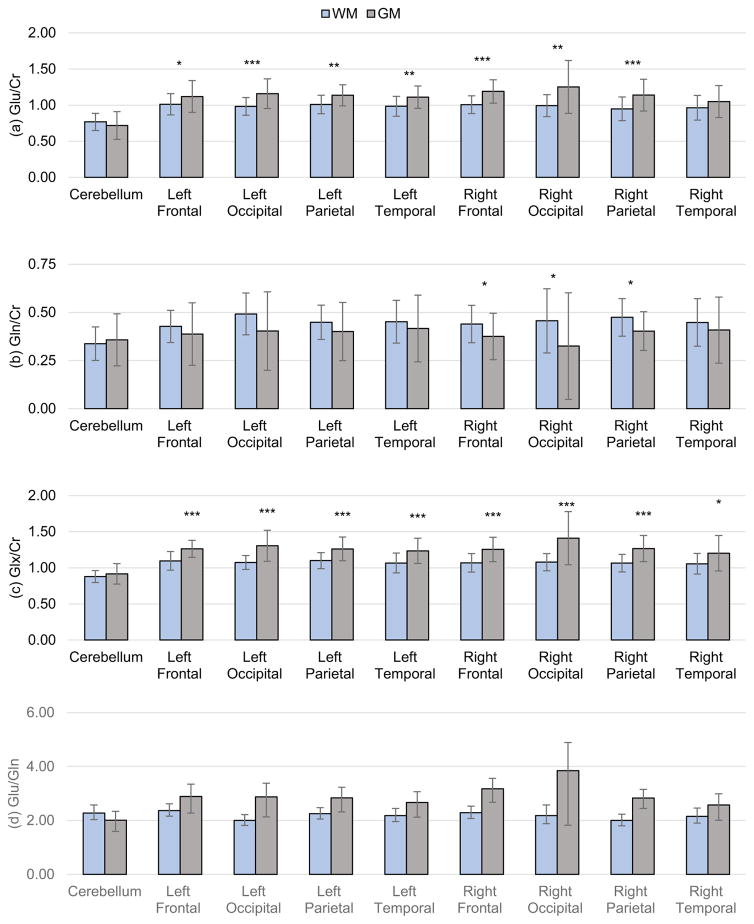
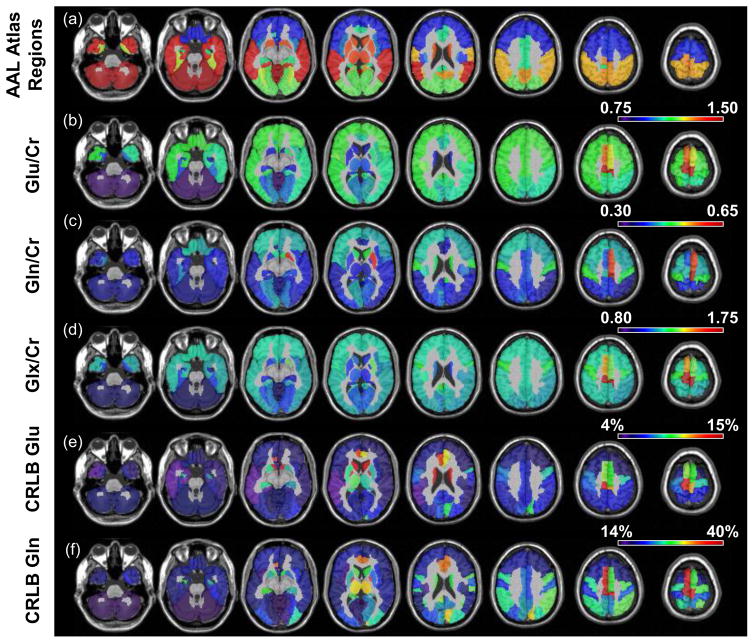
Glutamate (Glu) and glutamine (Gln) play an important role in neuronal regulation and are of value as MRS-observable diagnostic biomarkers. In this study the relative concentrations of these metabolites have been measured in multiple regions in the normal brain using a short-TE whole-brain MRSI measurement at 3 T combined with a modified data analysis approach that used spatial averaging to obtain high-SNR spectra from atlas-registered anatomic regions or interest. By spectral fitting of high-SNR spectra this approach yielded reliable measurements across a wide volume of the brain. Spectral averaging also demonstrated increased SNR and improved fitting accuracy for the sum of Glu and Gln (Glx) compared with individual voxel fitting. Results in 26 healthy controls showed relatively constant Glu/Cr and Gln/Cr throughout the cerebrum, although with increased values in the anterior cingulum and paracentral lobule, and increased Gln/Cr in the superior motor area. The deep gray-matter regions of thalamus, putamen, and pallidum show lower Glu/Cr compared with cortical white-matter regions. Lobar measurements demonstrated reduced Glu/Cr and Gln/Cr in the cerebellum as compared with the cerebrum, where white-matter regions show significantly lower Glu/Cr and Gln/Cr as compared with gray-matter regions across multiple brain lobes. Regression analysis showed no significant effect of gender on Glu/Cr or Gln/Cr measurement; however, Glx/Cr ratio was found to be significantly negatively correlated with age in some lobar brain regions. In summary, this methodology provides the spectral quality necessary for reliable separation of Glu and Gln at 3 T from a single MRSI acquisition enabling generation of regional distributions of metabolites over a large volume of the brain, including cortical regions. Copyright © 2016 John Wiley & Sons, Ltd.
Keywords: MRSI; aging; glutamate; glutamine; spectroscopy.
Copyright © 2016 John Wiley & Sons, Ltd.
Figures
Similar articles
-
Simultaneous quantification of glutamate and glutamine by J-modulated spectroscopy at 3 Tesla.Magn Reson Med. 2016 Sep;76(3):725-32. doi: 10.1002/mrm.25922. Epub 2015 Sep 12. Magn Reson Med. 2016. PMID: 26361892 Free PMC article.
-
Perturbation of the glutamate-glutamine system in alcohol dependence and remission.Neuropsychopharmacology. 2011 Jun;36(7):1359-65. doi: 10.1038/npp.2011.20. Epub 2011 Mar 9. Neuropsychopharmacology. 2011. PMID: 21389979 Free PMC article.
-
Pathological glutamatergic neurotransmission in Gilles de la Tourette syndrome.Brain. 2017 Jan;140(1):218-234. doi: 10.1093/brain/aww285. Epub 2016 Dec 22. Brain. 2017. PMID: 28007998
-
Glutamate and glutamine: a review of in vivo MRS in the human brain.NMR Biomed. 2013 Dec;26(12):1630-46. doi: 10.1002/nbm.3045. Epub 2013 Oct 4. NMR Biomed. 2013. PMID: 24123328 Free PMC article. Review.
-
MR spectroscopy in amyotrophic lateral sclerosis/motor neuron disease.J Neurol Sci. 1997 Oct;152 Suppl 1:S49-53. doi: 10.1016/s0022-510x(97)00244-x. J Neurol Sci. 1997. PMID: 9419054 Review.
Cited by
-
Magnetic Resonance Spectroscopy of Traumatic Brain Injury and Subconcussive Hits: A Systematic Review and Meta-Analysis.J Neurotrauma. 2022 Nov;39(21-22):1455-1476. doi: 10.1089/neu.2022.0125. Epub 2022 Aug 16. J Neurotrauma. 2022. PMID: 35838132 Free PMC article.
-
Whole-brain high-resolution metabolite mapping with 3D compressed-sensing SENSE low-rank 1 H FID-MRSI.NMR Biomed. 2022 Jan;35(1):e4615. doi: 10.1002/nbm.4615. Epub 2021 Oct 1. NMR Biomed. 2022. PMID: 34595791 Free PMC article.
-
Advanced magnetic resonance spectroscopic neuroimaging: Experts' consensus recommendations.NMR Biomed. 2021 May;34(5):e4309. doi: 10.1002/nbm.4309. Epub 2020 Apr 29. NMR Biomed. 2021. PMID: 32350978 Free PMC article.
-
The potential of 1H-MRS in CNS drug development.Psychopharmacology (Berl). 2021 May;238(5):1241-1254. doi: 10.1007/s00213-019-05344-7. Epub 2019 Sep 5. Psychopharmacology (Berl). 2021. PMID: 31486875 Free PMC article. Review.
-
Spectroscopic MRI-Guided Proton Therapy in Non-Enhancing Pediatric High-Grade Glioma.Tomography. 2023 Mar 9;9(2):633-646. doi: 10.3390/tomography9020051. Tomography. 2023. PMID: 36961010 Free PMC article.
References
-
- Erecinska M, Silver IA. Metabolism and role of glutamate in mammalian brain. Prog Neurobiol. 1990;35(4):245–296. - PubMed
-
- Snyder J, Wilman A. Field strength dependence of PRESS timings for simultaneous detection of glutamate and glutamine from 1.5 to 7T. J Magn Reson. 2010;203(1):66–72. - PubMed
-
- Wijtenburg SA, Knight-Scott J. Very Short Echo Time Improves the Precision of Glutamate Detection at 3T in H-1 Magnetic Resonance Spectroscopy. J Magn Reson Imaging. 2011;34(3):645–652. - PubMed
Publication types
MeSH terms
Substances
Grants and funding
LinkOut - more resources
Full Text Sources
Other Literature Sources
Medical
