Obesity and Multiple Sclerosis: A Mendelian Randomization Study
- PMID: 27351487
- PMCID: PMC4924848
- DOI: 10.1371/journal.pmed.1002053
Obesity and Multiple Sclerosis: A Mendelian Randomization Study
Abstract
Background: Observational studies have reported an association between obesity, as measured by elevated body mass index (BMI), in early adulthood and risk of multiple sclerosis (MS). However, bias potentially introduced by confounding and reverse causation may have influenced these findings. Therefore, we elected to perform Mendelian randomization (MR) analyses to evaluate whether genetically increased BMI is associated with an increased risk of MS.
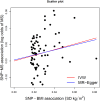
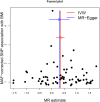
Methods and findings: Employing a two-sample MR approach, we used summary statistics from the Genetic Investigation of Anthropometric Traits (GIANT) consortium and the International MS Genetics Consortium (IMSGC), the largest genome-wide association studies for BMI and MS, respectively (GIANT: n = 322,105; IMSGC: n = 14,498 cases and 24,091 controls). Seventy single nucleotide polymorphisms (SNPs) were genome-wide significant (p < 5 x 10⁻⁸) for BMI in GIANT (n = 322,105) and were investigated for their association with MS risk in the IMSGC. The effect of each SNP on MS was weighted by its effect on BMI, and estimates were pooled to provide a summary measure for the effect of increased BMI upon risk of MS. Our results suggest that increased BMI influences MS susceptibility, where a 1 standard deviation increase in genetically determined BMI (kg/m2) increased odds of MS by 41% (odds ratio [OR]: 1.41, 95% CI 1.20-1.66, p = 2.7 x 10⁻⁵, I2 = 0%, 95% CI 0-29). Sensitivity analyses, including MR-Egger regression, and the weighted median approach provided no evidence of pleiotropic effects. The main study limitations are that, while these sensitivity analyses reduce the possibility that pleiotropy influenced our results, residual pleiotropy is difficult to exclude entirely.
Conclusion: Genetically elevated BMI is associated with risk of MS, providing evidence for a causal role for obesity in MS etiology. While obesity has been associated with many late-life outcomes, these findings suggest an important consequence of childhood and/or early adulthood obesity.
Conflict of interest statement
GDS is a member of the Editorial Board of
Figures


Comment in
-
Weighing Evidence from Mendelian Randomization-Early-Life Obesity as a Causal Factor in Multiple Sclerosis?PLoS Med. 2016 Jun 28;13(6):e1002054. doi: 10.1371/journal.pmed.1002054. eCollection 2016 Jun. PLoS Med. 2016. PMID: 27351631 Free PMC article.
References
-
- Trisolini M, Honeycutt A, Wiener J, Lesesne S. MS International Federation. In: Global Economic Impact of Multiple Sclerosis. 2010 [cited 21 Apr 2016]. http://www.msif.org/wp-content/uploads/2014/09/Global_economic_impact_of...
Publication types
MeSH terms
Grants and funding
LinkOut - more resources
Full Text Sources
Other Literature Sources
Medical

