Randomized Controlled Trial
. 2016 Jun 28;11(6):e0157825.
doi: 10.1371/journal.pone.0157825. eCollection 2016.

Eye Movement Training and Suggested Gaze Strategies in Tunnel Vision - A Randomized and Controlled Pilot Study

Affiliations
Randomized Controlled Trial

Eye Movement Training and Suggested Gaze Strategies in Tunnel Vision - A Randomized and Controlled Pilot Study

Iliya V Ivanov et al. PLoS One. .

Abstract

Purpose: Degenerative retinal diseases, especially retinitis pigmentosa (RP), lead to severe peripheral visual field loss (tunnel vision), which impairs mobility. The lack of peripheral information leads to fewer horizontal eye movements and, thus, diminished scanning in RP patients in a natural environment walking task. This randomized controlled study aimed to improve mobility and the dynamic visual field by applying a compensatory Exploratory Saccadic Training (EST).

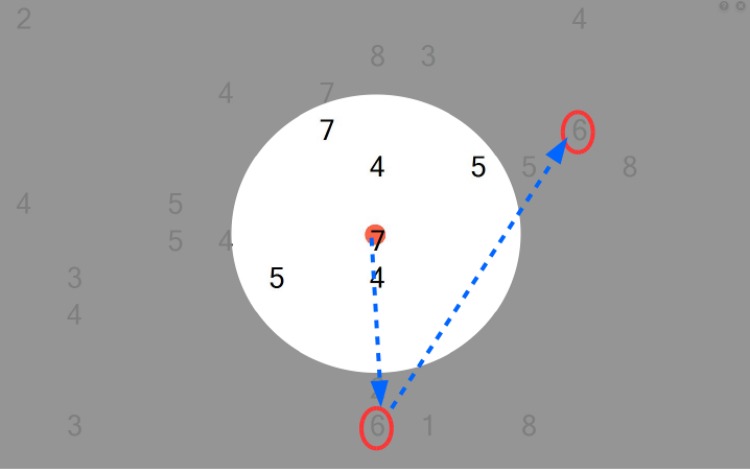
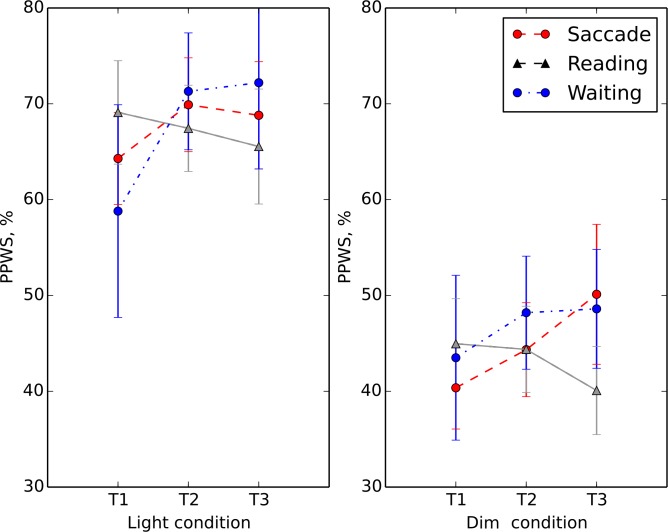
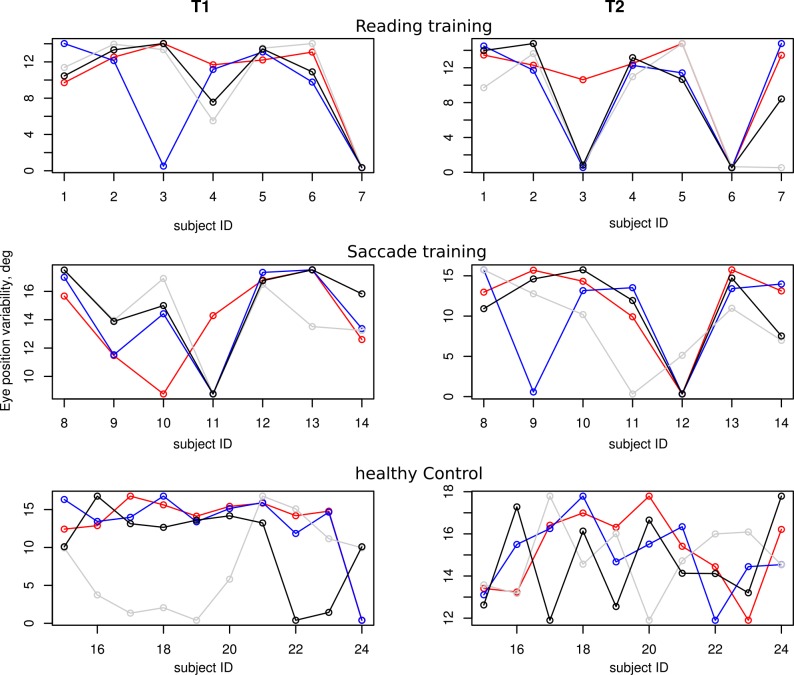
Methods: Oculomotor responses during walking and avoiding obstacles in a controlled environment were studied before and after saccade or reading training in 25 RP patients. Eye movements were recorded using a mobile infrared eye tracker (Tobii glasses) that measured a range of spatial and temporal variables. Patients were randomly assigned to two training conditions: Saccade (experimental) and reading (control) training. All subjects who first performed reading training underwent experimental training later (waiting list control group). To assess the effect of training on subjects, we measured performance in the training task and the following outcome variables related to daily life: Response Time (RT) during exploratory saccade training, Percent Preferred Walking Speed (PPWS), the number of collisions with obstacles, eye position variability, fixation duration, and the total number of fixations including the ones in the subjects' blind area of the visual field.

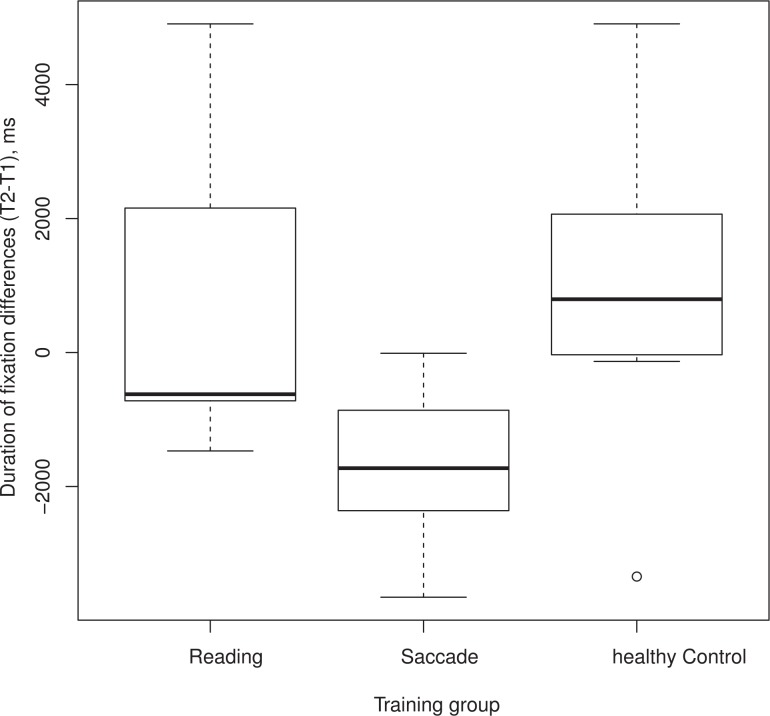
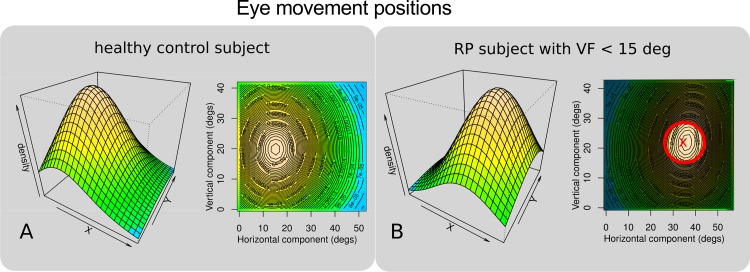
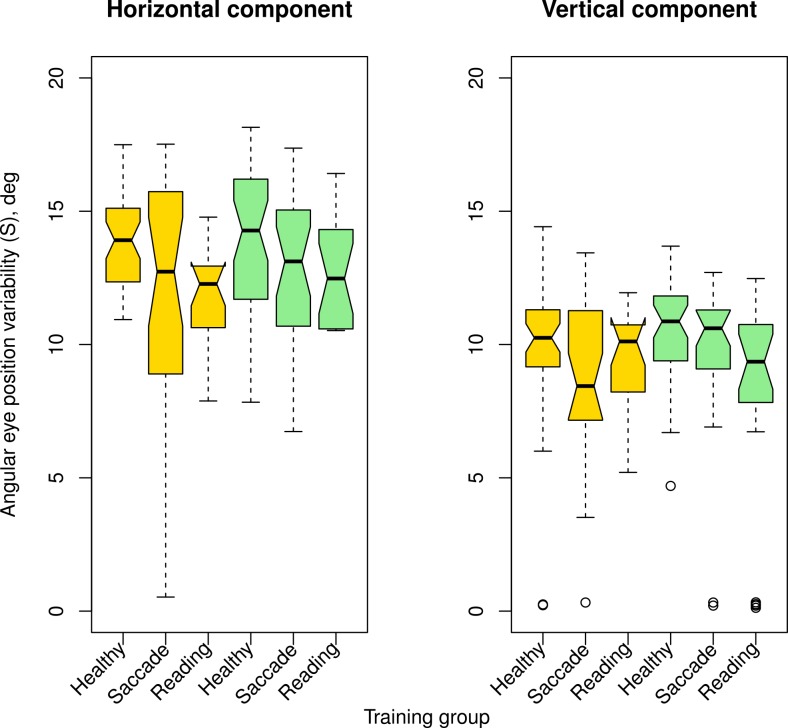
Results: In the saccade training group, RTs on average decreased, while the PPWS significantly increased. The improvement persisted, as tested 6 weeks after the end of the training. On average, the eye movement range of RP patients before and after training was similar to that of healthy observers. In both, the experimental and reading training groups, we found many fixations outside the subjects' seeing visual field before and after training. The average fixation duration was significantly shorter after the training, but only in the experimental training condition.

Conclusions: We conclude that the exploratory saccade training was beneficial for RP patients and resulted in shorter fixation durations after the training. We also found a significant improvement in relative walking speed during navigation in a real-world like controlled environment.


Conflict of interest statement

Competing Interests: The authors have declared that no competing interests exist.

Figures

Fig 1
Fig 1. A schematic illustrating the visual search training task.
In this screen shot, the targets (number 6) are embedded among a random array of digits as distracters. It was possible that multiple targets simultaneously appeared on the screen. After initial fixation of the central red dot, subjects were required to perform saccades (indicated by the blue arrows) outside their seeing visual field (gray area) to find all the targets (in the schematic surrounded by the red ovals). Each screen was presented until all targets were detected. The time-out period between the different screens was determined by the subjects.
Fig 2
Fig 2. Separate plots present the light (left plot) and dim (right plot) conditions for the saccade (red circles), reading (gray triangles) and waiting list (blue circles) training groups.
The average percentage of preferred walking speed (PPWS) is plotted on the ordinate as function of the different times relative to the training–pre (T1)-, post (T2)- and follow-up (T3). Error bars represent +/-1 SEM.
Fig 3
Fig 3. Box plot comparison of patients’ eye movements with healthy control observers before (T1) and after (T2) training.
The abscissa represents the three training groups (reading, saccade or healthy control). The ordinate shows the duration of fixations for each training group, calculated as differences between the durations of fixations performed after and before training (T2-T1). Negative numbers indicate that fixation durations were shorter after training.
Fig 4
Fig 4. Horizontal eye position variability [degrees] pre- (T1) and post-training (T2) for the different training conditions: reading, saccade and healthy control groups on the vertical axes, while the horizontal axes represent different observers.
Blue circles represent the light condition, red the dim condition, and black and gray the values for the two walks without obstacles(S2 Table provides a table with all values along the horizontal and vertical axes). In most patients (saccadic and reading group) the eye position variability is in a similar range as in the healthy observers.
Fig 5
Fig 5. Perspective and contour plots of two-dimensional kernel density estimations of horizontal and vertical eye movement positions.
Eye positions (horizontal and vertical on the abscissa and ordinate, respectively) and visual field horizontal diameters are given in degrees. Density represents the time the eye spent at any particular position (x,y) during the whole walk and are given in percentages. In 5A typical eye movement positions of a normal observer in the light condition are shown. In 5B are shown the typical eye movement positions of an RP patient (visual field depicted by the red circle surrounded by the shaded gray area) in the light condition.
Fig 6
Fig 6. Box plots of horizontal eye position variability in degrees.
The horizontal component is plotted on the left, the vertical component is shown on the right. Different training groups are plotted on the abscissa for the pre-training (gold symbols) and post-training (green symbols) conditions. Boxes represent the median and the 25th to 75th percentile of the distributions; whiskers represent 1.5* IQR excluding outliers. This shows that the range of horizontal eye movements amplitudes was significantly larger than that of the vertical eye movements.

References

    1. Turano KA, Yu D, Hao L, Hicks JC. Optic-flow and egocentric-direction strategies in walking: Central vs peripheral visual field. Vis. Res. 2005; 45, 3117–3132. - PubMed
    1. Vargas-Martin F, Peli E. Eye movements of patients with tunnel vision while walking. Inv. Ophthalmol. and Vis. Sci. 2006; 47(12). - PMC - PubMed
    1. Hoffman JE, Subramaniam B. The role of visual attention in saccadic eye movements. Percept Psychophys. 1995; 57(6), 787–95. - PubMed
    1. Curtis CE, Connolly JD. Saccade preparation signals in the human frontal and parietal cortices. J Neurophysiol 2008; 99, 133–145. - PMC - PubMed
    1. Nakayama K, Mackeben M. Sustained and transient components of focal visual attention. Vis.Res. 1998; 29, 1631–1647. - PubMed

Publication types