. 2016 Jun 28;5(6):e329.
doi: 10.1038/mtna.2016.46.

Fructose Promotes Uptake and Activity of Oligonucleotides With Different Chemistries in a Context-dependent Manner in mdx Mice

Affiliations

Fructose Promotes Uptake and Activity of Oligonucleotides With Different Chemistries in a Context-dependent Manner in mdx Mice

Limin Cao et al. Mol Ther Nucleic Acids. .

Erratum in

Abstract

Antisense oligonucleotide (AO)-mediated exon-skipping therapeutics shows great promise in correcting frame-disrupting mutations in the DMD gene for Duchenne muscular dystrophy. However, insufficient systemic delivery limits clinical adoption. Previously, we showed that a glucose/fructose mixture augmented AO delivery to muscle in mdx mice. Here, we evaluated if fructose alone could enhance the activities of AOs with different chemistries in mdx mice. The results demonstrated that fructose improved the potency of AOs tested with the greatest effect on phosphorodiamidate morpholino oligomer (PMO), resulted in a 4.25-fold increase in the number of dystrophin-positive fibres, compared to PMO in saline in mdx mice. Systemic injection of lissamine-labeled PMO with fructose at 25 mg/kg led to increased uptake and elevated dystrophin expression in peripheral muscles, compared to PMO in saline, suggesting that fructose potentiates PMO by enhancing uptake. Repeated intravenous administration of PMO in fructose at 50 mg/kg/week for 3 weeks and 50 mg/kg/month for 5 months restored up to 20% of wild-type dystrophin levels in skeletal muscles with improved functions without detectable toxicity, compared to untreated mdx controls. Collectively, we show that fructose can potentiate AOs of different chemistries in vivo although the effect diminished over repeated administration.


Figures
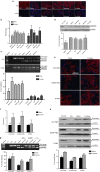
Figure 1
Figure 1
Evaluation of different AOs in hexose solutions in mdx mice intramuscularly. Dystrophin expression following one single intramuscular injection of 5 µg peptide nucleic acid (PNA), 2'OMe AOs or 2 µg M12-PMO, 1 µg B-MSP-PMO, or 1 µg R-PMO in hexose solutions in adult mdx mice. (a) Immunohistochemistry for dystrophin protein expression in mdx mice treated with PNA or 2'OMe AOs in different solutions, respectively. Data from control normal C57BL6 and untreated mdx mice were shown (scale bar = 100 μm). (b) Quantitative analysis of dystrophin-positive fibres in TA muscles from mdx mice treated with different combinations. The comparison was normalized to the corresponding saline group and presented as fold change relative to saline. Significant improvement was detected in TA muscles treated with PNA in galactose, GF, or fructose compared with PNA in saline (n = 3, two-tailed t-test, *P < 0.05). (c) RT-PCR analysis to detect dystrophin exon-skipping transcripts in the treated tissues with PNA AOs in different solutions, respectively. ▵exon 23 is for exon 23 skipped bands. Significant increases were observed in the levels of exon skipping in TA muscles treated with PNA in GF or fructose compared with PNA in saline (n = 3, two-tailed t-test, *P < 0.05). (d) Western blot to detect dystrophin protein expression in the indicated muscle groups from treated mdx mice compared with C57BL6 and untreated mdx mice. Total protein (5 μg) from tibialis anterior of C57BL6 and treated and untreated mdx mice (50 μg) were loaded with α-actinin used as a loading control (n = 3). (e) Immunohistochemistry for dystrophin protein expression in mdx mice treated with M12-PMO, B-MSP-PMO, or R-PMO in 5% fructose (scale bar=100 μm). (f) Quantitative analysis of dystrophin-positive fibres in TA muscles from mdx mice treated with different peptide-PMO conjugates in fructose. The comparison was normalized to the saline treatment group and presented as fold change relative to saline. Significant improvement was detected in TA muscles treated with M12-PMO or B-MSP-PMO in fructose compared with the corresponding saline groups (n = 3, two-tailed t-test, *P < 0.05). (g) RT-PCR analysis to detect dystrophin exon-skipping transcripts in the treated tissues with different peptide-PMO conjugates in fructose. ▴exon 23 is for exon 23 skipped bands. A significant increase was observed in the level of exon skipping in TA muscles treated with M12-PMO in fructose compared with the saline group (n = 3, two-tailed t-test, *P < 0.05). (h) Western blot to detect dystrophin protein expression in the indicated muscle groups from treated mdx mice compared with C57BL6 and untreated mdx mice. Different amounts of total protein (5, 10, 20 μg) from tibialis anterior of C57BL6 and treated and untreated mdx mice (50 μg) were loaded with α-actinin used as a loading control. Significant increases were detected in the levels of dystrophin expression in TA muscles treated with M12-PMO or B-MSP-PMO in fructose compared with the corresponding saline groups (n = 3, two-tailed t-test, *P < 0.05).
Figure 2
Figure 2
Investigation of the potentiating effect of fructose on PMO, peptide nucleic acid (PNA), and 2'OMe AOs in mdx mice intramuscularly. (a) Immunohistochemistry for dystrophin protein expression in TA muscles from mdx mice treated with 2 µg PMO, 5 µg PNA, and 5 µg 2'OMe AOs in 5% fructose (scale bar = 100 μm). (b) Quantitative analysis of dystrophin-positive fibres in TA muscles from mdx mice treated with PMO, PNA and 2'OMe in fructose, respectively. The comparison was normalized to the saline treatment group and presented as fold change relative to saline. Significant increases were detected in TA muscles treated with PMO or PNA in fructose compared with the corresponding saline groups (n = 3, two-tailed t-test, *P < 0.05, **P < 0.01). (c) RT-PCR analysis to detect dystrophin exon-skipping transcripts in treated TA muscles. ▵exon 23 represents exon 23 skipped bands. Significant increases were detected in the levels of exon skipping in TA muscles treated with PMO or PNA in fructose compared with the corresponding saline groups (n = 3, two-tailed t-test, *P < 0.05, **P < 0.01). Also, there was a significant increase in the level of exon skipping in TA muscles treated with PMO-F compared with PNA in fructose (n = 3, two-tailed t-test, P = 0.023). (d) Western blot to detect dystrophin protein expression in TA muscles from treated mdx mice compared with C57BL6 and untreated mdx mice. Total protein (5 μg) from tibialis anterior of C57BL6 and treated and untreated mdx mice (50 μg) were loaded with α-actinin used as a loading control. Significant increases were detected in TA muscles treated with PMO or PNA in fructose compared with the corresponding saline groups (n = 3, two-tailed t-test, *P < 0.05, **P < 0.01).
Figure 3
Figure 3
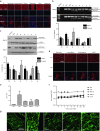
Evaluation of tissue distribution and exon-skipping activity of lissamine-labeled PMO-F in mdx mice. Lissamine-labeled PMO-F was injected intravenously into mdx mice at 25 mg/kg/day for 3 days. (a) Tissue distribution of lissamine-labeled PMO in mdx mice 4 days after three daily intravenous injections of either PMO-F or PMO-S at the 25 mg/kg/day doses. NC represents untreated mdx controls. A, abdominal muscle; Q, quadriceps; TA, tibialis anterior; G, gastrocnemius; T, triceps; H, heart; L, liver, and K, kidney (n = 4). (b) Quantitative evaluation of fluorescence intensity in body-wide tissues with IVIS spectrum series. The comparison was normalized to the corresponding saline group and presented as fold change relative to saline. (c) RT-PCR analysis to detect dystrophin exon skipping transcripts in the treated TA muscles. ▵exon 23 represents exon 23 skipped bands. (d) Quantitative analysis of exon 23 skipping efficiency in muscles from mdx mice treated with PMO-F or PMO-S. Significant increases were detected in abdominal, quadriceps or gastrocnemius muscles treated with PMO-F compared with counterparts treated with PMO-S (n = 4, two-tailed t-test, **P < 0.01). (e) Western blot to detect dystrophin protein expression in muscles from treated mdx mice compared with C57BL6 and untreated mdx mice. Total protein (0.5 μg) from tibialis anterior of C57BL6 and treated and untreated mdx mice (50 μg) were loaded with α-actinin used as a loading control (n = 4).
Figure 4
Figure 4
Sustained dystrophin expression and functional improvement in mdx mice following repeated administration of PMO-F at 50 mg/kg/week for 3 weeks and 50 mg/kg/month for 5 months. (a) Immunohistochemistry for dystrophin protein expression in indicated muscles from mdx mice treated with repeated intravenous injections of PMO-F at 50 mg/kg/week for 3 weeks and 50 mg/kg/month for 5 months (scale bar = 100 μm). (b) RT-PCR analysis to detect dystrophin exon skipping transcripts in the treated muscles from mdx mice treated with PMO-F or PMO-S. ▴exon 23 represents exon 23 skipped bands. A, abdominal muscle; Q, quadriceps; TA, tibialis anterior; G, gastrocnemius; T, triceps, and D, diaphragm. A significant increase was detected in gastrocnemius treated with PMO-F compared with PMO-S (n = 4, two-tailed t-test, *P = 0.041). (c) Western blot to detect dystrophin protein expression in treated muscles from mdx mice treated with either PMO-F or PMO-S compared with C57BL6 and untreated mdx mice. Total protein (5 μg) from tibialis anterior of C57BL6 and treated and untreated mdx mice (50 μg) were loaded with α-actinin used as a loading control. A significant increase was detected in diaphragm treated with PMO-F compared with PMO-S (n = 4, two-tailed t-test, *P = 0.043). (d) Restoration of the dystrophin-associated protein complex (DAPC) was studied to assess dystrophin function and recovery of normal myoarchitecture. DAPC protein components β-dystroglycan, α- and β-sarcoglycan and nNOS were detected by immunostaining in serial tissue cross-sections of quadriceps (scale bar = 50 μm). (e) Measurement of serum creatine kinase (CK) levels as an index of ongoing muscle membrane instability in treated mdx mice compared with untreated control group. Significant falls in serum CK levels were detected in mice treated with PMO-F, PMO-S, and fructose alone (F con) compared to age-matched untreated mdx controls (n = 4, two-tailed t-test, *P < 0.05). (f) Muscle function was assessed using a functional grip strength test to determine the physical improvement of mdx mice treated with PMO-F. There was no statistical difference detected between PMO-F, PMO-S, F con and untreated mdx controls (n = 4, two-tailed t-test, P > 0.05). (g) Analysis of muscle membrane integrity in diaphragm from mdx mice treated with PMO-F, PMO-S, or F con with IgG staining.
Figure 5
Figure 5
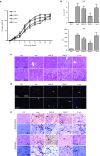
Investigation of potential toxicity and immune activation of repeated administration of PMO-F at 50 mg/kg doses in mdx mice. (a) Body-weight measurements of mdx mice treated with PMO-F or PMO-S over 26 weeks. Data shows a steady body-weight increase and the same pattern of growth with both treatments as untreated mdx controls (n = 4). BW, body weight; F con, fructose alone. (b) Measurement of serum levels of aspartate aminotransferase (AST) and alanine aminotransferase (ALT) enzymes in mdx mice treated with PMO-F compared with untreated mdx mice (two-tailed t-test, P = 0.036, n = 4). (c) H&E staining of liver (upper panel) and kidney (lower panel) tissues sections from mdx mice treated with PMO-F, PMO-S, F con, untreated mdx mice and C57BL6 normal controls. (d) Detection of CD3+ T lymphocytes and CD68+ macrophage in the diaphragms of treated and untreated mdx mice (scale bar = 50 μm). Arrows indicate T lymphocytes detected by CD3+ and CD68+ mouse monoclonal antibodies. (e) Histological and immunohistological examination of quadriceps and gastrocnemius from mdx mice treated with PMO-F, PMO-S, F con, untreated and C57BL6 normal controls. Data shows decrease in the number of CD68+ macrophages in skeletal muscles from mdx mice treated with PMO-F compared with untreated mdx controls.

Similar articles

Cited by

References

    1. Hoffman, EP, Fischbeck, KH, Brown, RH, Johnson, M, Medori, R, Loike, JD et al. (1988). Characterization of dystrophin in muscle-biopsy specimens from patients with Duchenne's or Becker's muscular dystrophy. N Engl J Med 318: 1363–1368. - PubMed
    1. Sicinski, P, Geng, Y, Ryder-Cook, AS, Barnard, EA, Darlison, MG and Barnard, PJ (1989). The molecular basis of muscular dystrophy in the mdx mouse: a point mutation. Science 244: 1578–1580. - PubMed
    1. Alter, J, Lou, F, Rabinowitz, A, Yin, H, Rosenfeld, J, Wilton, SD et al. (2006). Systemic delivery of morpholino oligonucleotide restores dystrophin expression bodywide and improves dystrophic pathology. Nat Med 12: 175–177. - PubMed
    1. Lu, QL, Rabinowitz, A, Chen, YC, Yokota, T, Yin, H, Alter, J, et al. (2005). Systemic delivery of antisense oligoribonucleotide restores dystrophin expression in body-wide skeletal muscles. Proc Natl Acad Sci USA 102: 198–203. - PMC - PubMed
    1. Goemans, NM, Tulinius, M, van den Akker, JT, Burm, BE, Ekhart, PF, Heuvelmans, N et al. (2011). Systemic administration of PRO051 in Duchenne's muscular dystrophy. N Engl J Med 364: 1513–1522. - PubMed