. 2017 Jan;45(1):187-198.
doi: 10.1002/jmri.25356. Epub 2016 Jun 28.

Reproducibility measurement of glutathione, GABA, and glutamate: Towards in vivo neurochemical profiling of multiple sclerosis with MR spectroscopy at 7T

Affiliations

Reproducibility measurement of glutathione, GABA, and glutamate: Towards in vivo neurochemical profiling of multiple sclerosis with MR spectroscopy at 7T

Hetty Prinsen et al. J Magn Reson Imaging. 2017 Jan.

Abstract

Purpose: To determine the reproducibility of a comprehensive single-session measurement of glutathione (GSH), γ-aminobutyric acid (GABA), glutamate, and other biochemicals implicated in the pathophysiology of multiple sclerosis (MS) in the human brain with 1 H magnetic resonance spectroscopy (MRS).

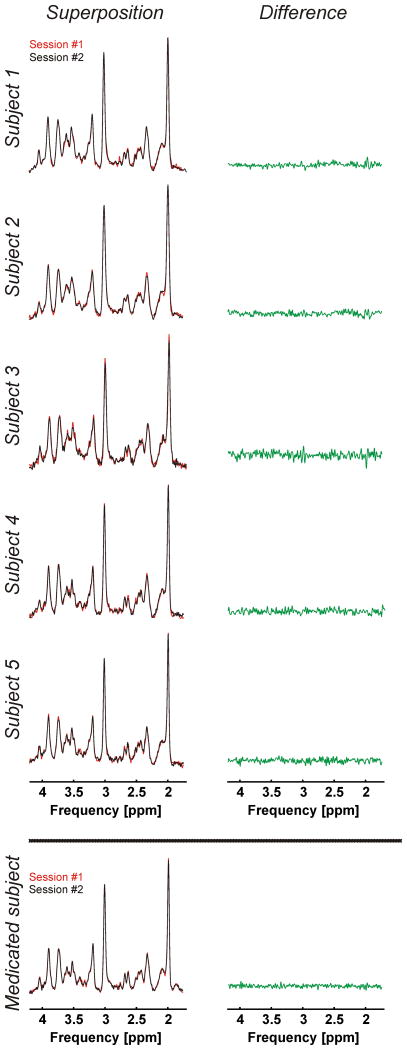
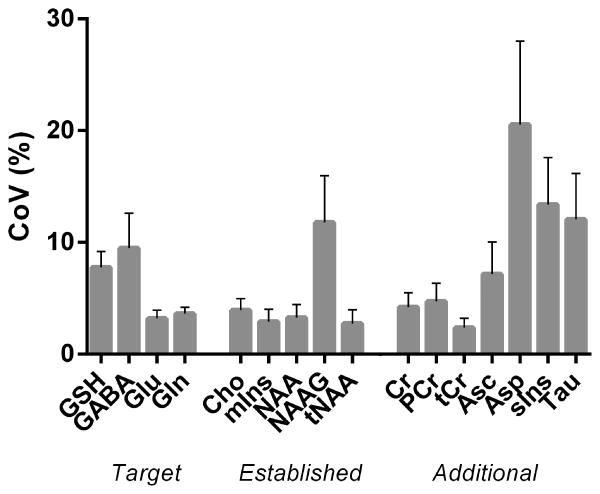
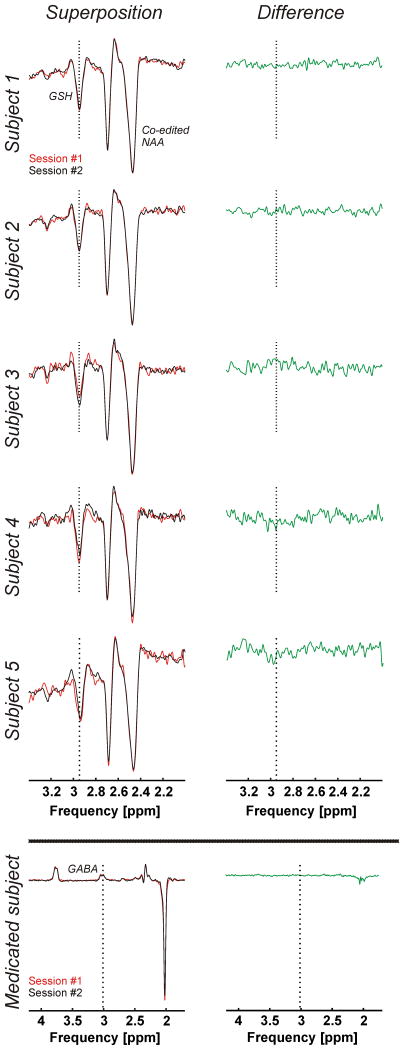
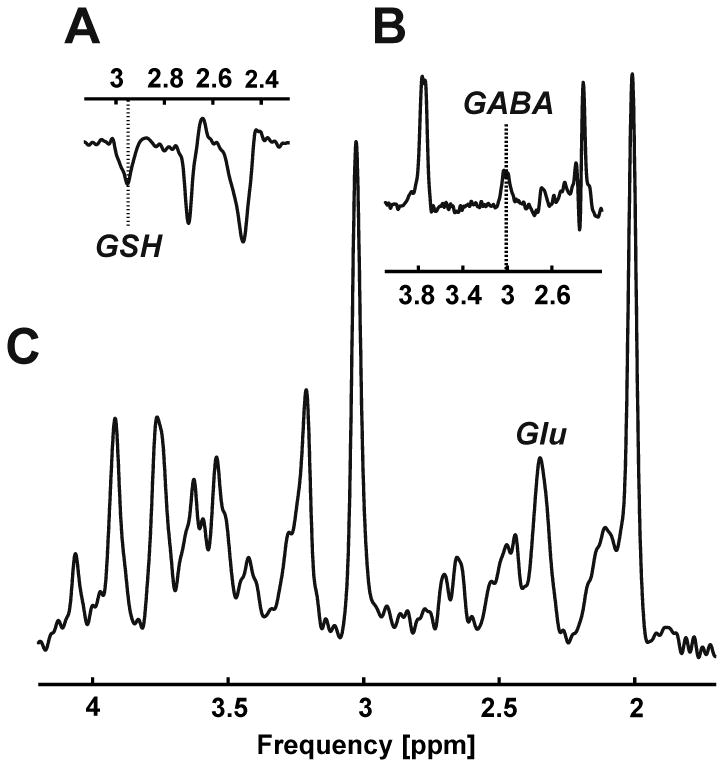
Materials and methods: Five healthy subjects were studied twice in separate 1-hour sessions at 7T. One MS patient was also scanned once. GSH and GABA were measured with J-difference editing using a semilocalized by adiabatic selective refocusing sequence (semi-LASER, TE = 72 msec). A stimulated echo acquisition mode sequence (STEAM, TE = 10 msec) was used to detect glutamate along with the overall biochemical profile. Spectra were quantified with LCModel. Quantification accuracy was assessed through Cramer-Rao lower bounds (CRLB). Reproducibility of the metabolite quantification was tested using coefficients of variation (CoV).

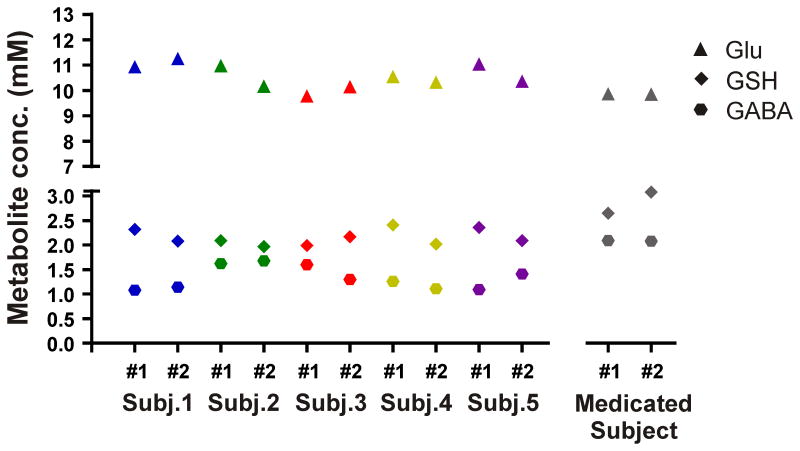
Results: CRLB were ≤7% for GSH, GABA, and glutamate and average CoV of 7.8 ± 3.2%, 9.5 ± 7.0%, and 3.2 ± 1.7% were achieved, respectively. The average test/retest concentration differences at this measurement reproducibility and quantification accuracy were smaller for GABA and glutamate than intersubject variations in metabolite content with CoV ratios of 0.6 and 0.8, respectively. As proof of principle, GSH, GABA, and glutamate were also detected in an MS patient.

Conclusion: GSH, GABA, glutamate, and other metabolites relevant in MS can be quantified at 7T with high accuracy and reproducibility in a single 1-hour session. This methodology might serve as a clinical research tool to investigate biochemical markers associated with MS.

Level of evidence: 2 J. Magn. Reson. Imaging 2017;45:187-198.

Keywords: 7 Tesla; brain; human; magnetic resonance spectroscopy; multiple sclerosis; reproducibility.


Figures

Figure 1
Figure 1
Anatomical image in the axial plane (A) used for both voxel positioning on the midline occipital cortex and for brain segmentation (B).
Figure 2
Figure 2
JDE of GSH consisting of an edited condition (A, red) and a non-inverted reference (A, black) was performed using a semi-LASER sequence (voxel size 3×3×3 cm3, TR 3 s, TE 72 ms, 64 averages per JDE condition, acquisition time 7 min). The difference spectrum (B, scaling factor 3.3) exhibits expected co-edited NAA at 2.49 and 2.67 ppm and allows the isolation of the GSH CH2 signal of the cysteine moiety at 2.95 ppm (dotted vertical line).
Figure 3
Figure 3
JDE of GABA consisting of an edited condition (A, red) and a non-inverted reference (A, black) was performed using a semi-LASER sequence (voxel size 3×3×3 cm3, TR 3 s, TE 72 ms, 128 averages per JDE condition, acquisition time 13 min). The difference spectrum (B, scaling factor 1.1) exhibits expected co-edited glutamate and glutamine at 3.74 ppm and allows the isolation of the GABA 2CH2 signal at 3.01 ppm (dotted vertical line).
Figure 4
Figure 4
1H MRS of target metabolites glutamate and glutamine along with additional metabolites choline, myo-inositol, NAA, creatine, ascorbate, aspartate, scyllo-inositol, and taurine measured with STEAM (A, voxel size 2×2×2 cm3, TR 3 s, TE 10 ms, mixing time 50 ms, 96 averages, acquisition time 5 min). The 4CH2 group of glutamate at 2.34/2.35 ppm could clearly be separated from both the 4CH2 group of glutamine at 2.43/2.46 ppm and the 3CH2 group of NAA at 2.49 ppm (B). The overall spectral quality supports the observation of down-field resonances, for instance, the phenylalanine peak at 7.37 ppm (C).
Figure 5
Figure 5
GSH, GABA, and glutamate concentrations (mM) in the occipital cortex of 5 healthy subjects studied twice in different sessions. Metabolite concentrations were also measured twice in a subject on medication known to impact GABA concentrations. GSH and GABA were measured using semi-LASER JDE, and STEAM was used to detect glutamate.
Figure 6
Figure 6
Superposition of test-retest STEAM spectra (voxel size 2×2×2 cm3, TR 3 s, TE 10 ms, mixing time 50 ms, 96 averages, acquisition time 5 min) acquired during the two study sessions (#1 and #2, left) and their difference (right). Extra: Corresponding spectra of a subject on medication known to impact GABA concentrations.
Figure 7
Figure 7
Mean CoV (%) of the target metabolites (GSH, GABA, glutamate and glutamine), the established MS biomarkers (choline, myo-inositol, N-acetylaspartate/ N-acetylaspartylglutamate), and additional metabolites (creatine, phosphocreatine, ascorbate, aspartate, scyllo-inositol, and taurine) quantified twice during different sessions in 5 healthy subjects. Error bars represent standard errors of the mean. GSH and GABA were measured using semi-LASER JDE, and STEAM was used to detect glutamate, glutamine, the established MS biomarkers, and additional metabolites.
Figure 8
Figure 8
Superposition of test-retest difference spectra for JDE of GSH acquired using a semi-LASER sequence (voxel size 3×3×3 cm3, TR 3 s, TE 72 ms, 64 averages per JDE condition, acquisition time 7 min) during the two study sessions (#1 and #2, left) and their difference (right). Extra: Superposition of test-retest difference spectra for JDE of GABA acquired using a semi-LASER sequence (voxel size 3×3×3 cm3, TR 3 s, TE 72 ms, 128 averages per JDE condition, acquisition time 13 min) during the two study sessions (#1 and #2, left) and their difference (right) of a subject on medication known to impact GABA concentrations.
Figure 9
Figure 9
Proof of principle: GSH (A), GABA (B), and glutamate (C, Glu) detection in an MS patient.

References

    1. Goldenberg MM. Multiple sclerosis review. P T. 2012;37:175–184. - PMC - PubMed
    1. Lublin FD, Reingold SC, Cohen JA, et al. Defining the clinical course of multiple sclerosis: the 2013 revisions. Neurology. 2014;83:278–286. - PMC - PubMed
    1. De Stefano N, Filippi M. MR spectroscopy in multiple sclerosis. J Neuroimaging. 2007;17(Suppl 1):31S–35S. - PubMed
    1. Arnold DL, Matthews PM, Francis G, Antel J. Proton magnetic resonance spectroscopy of human brain in vivo in the evaluation of multiple sclerosis: assessment of the load of disease. Magn Reson Med. 1990;14:154–159. - PubMed
    1. Davie CA, Hawkins CP, Barker GJ, et al. Serial proton magnetic resonance spectroscopy in acute multiple sclerosis lesions. Brain. 1994;117(Pt 1):49–58. - PubMed

Publication types