. 2016 Aug;13(4):046019.
doi: 10.1088/1741-2560/13/4/046019. Epub 2016 Jun 28.

Histological evaluation of a chronically-implanted electrocorticographic electrode grid in a non-human primate

Affiliations

Histological evaluation of a chronically-implanted electrocorticographic electrode grid in a non-human primate

Alan D Degenhart et al. J Neural Eng. 2016 Aug.

Abstract

Objective: Electrocorticography (ECoG), used as a neural recording modality for brain-machine interfaces (BMIs), potentially allows for field potentials to be recorded from the surface of the cerebral cortex for long durations without suffering the host-tissue reaction to the extent that it is common with intracortical microelectrodes. Though the stability of signals obtained from chronically implanted ECoG electrodes has begun receiving attention, to date little work has characterized the effects of long-term implantation of ECoG electrodes on underlying cortical tissue.

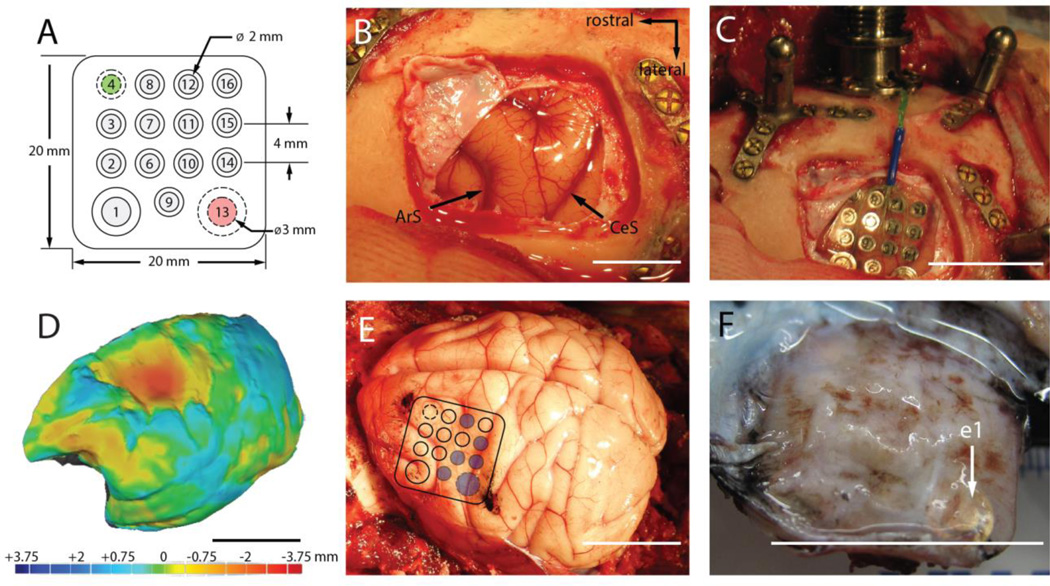
Approach: We implanted and recorded from a high-density ECoG electrode grid subdurally over cortical motor areas of a Rhesus macaque for 666 d.

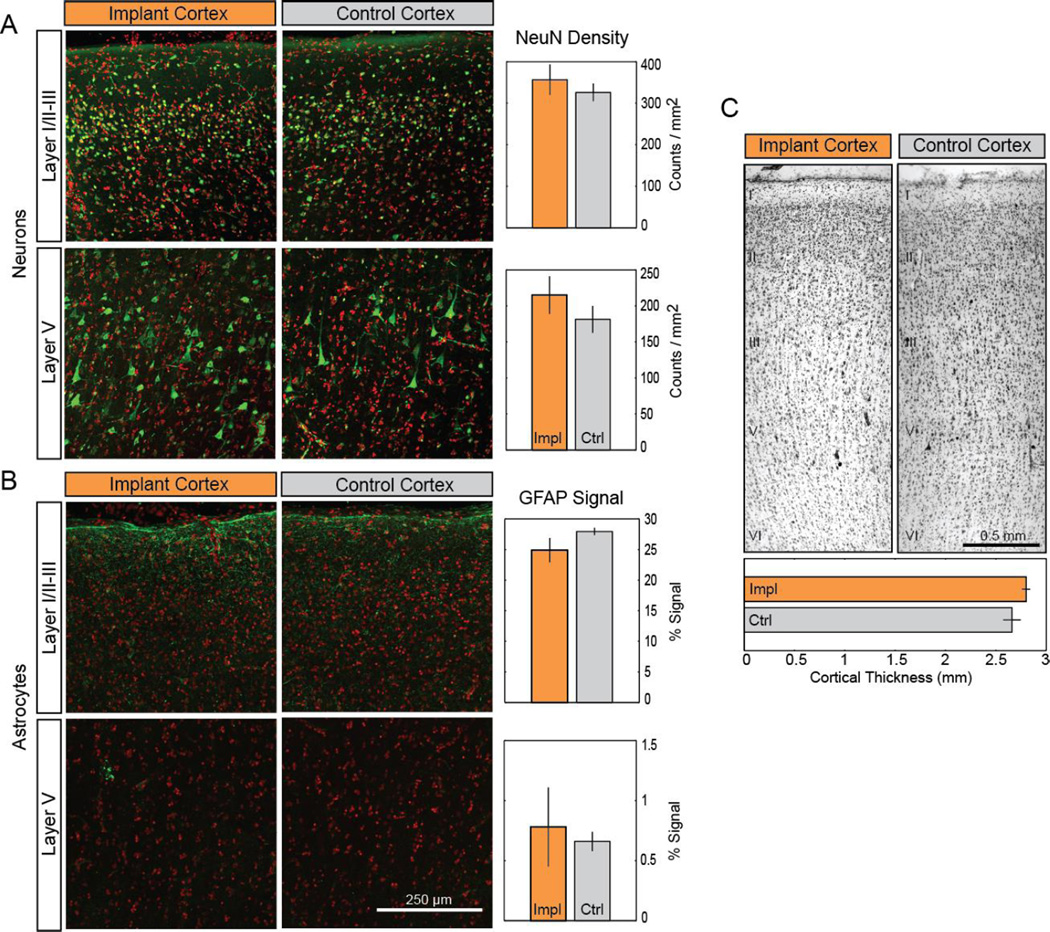
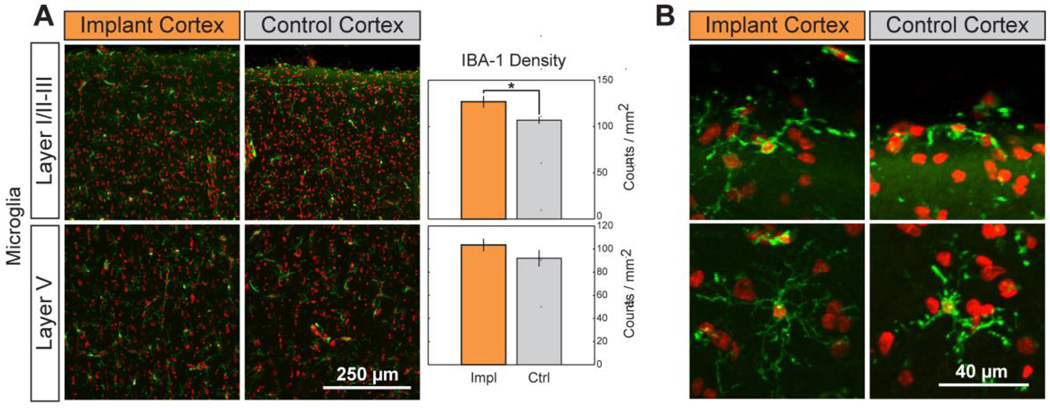
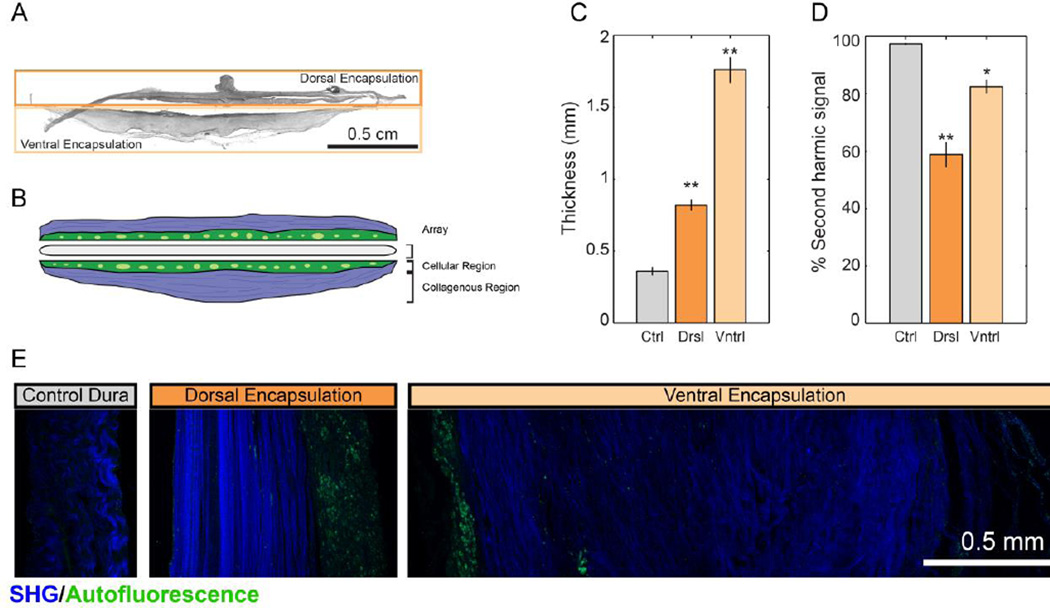
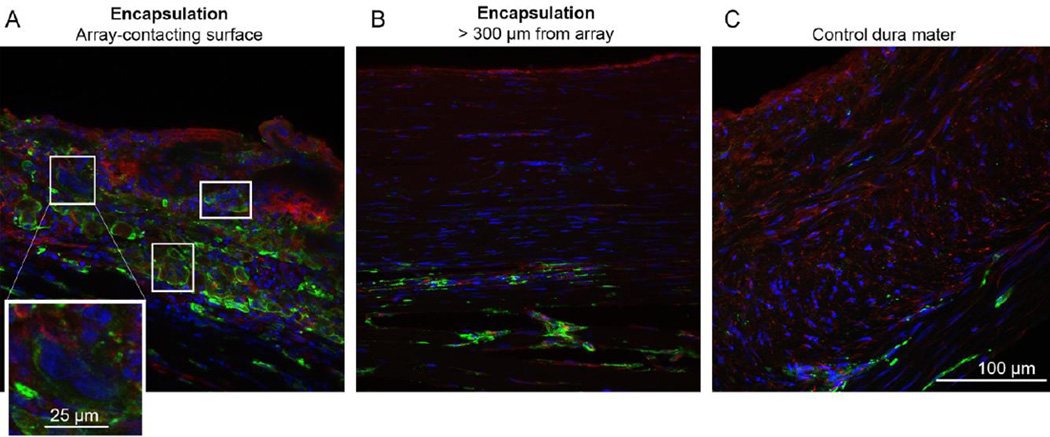
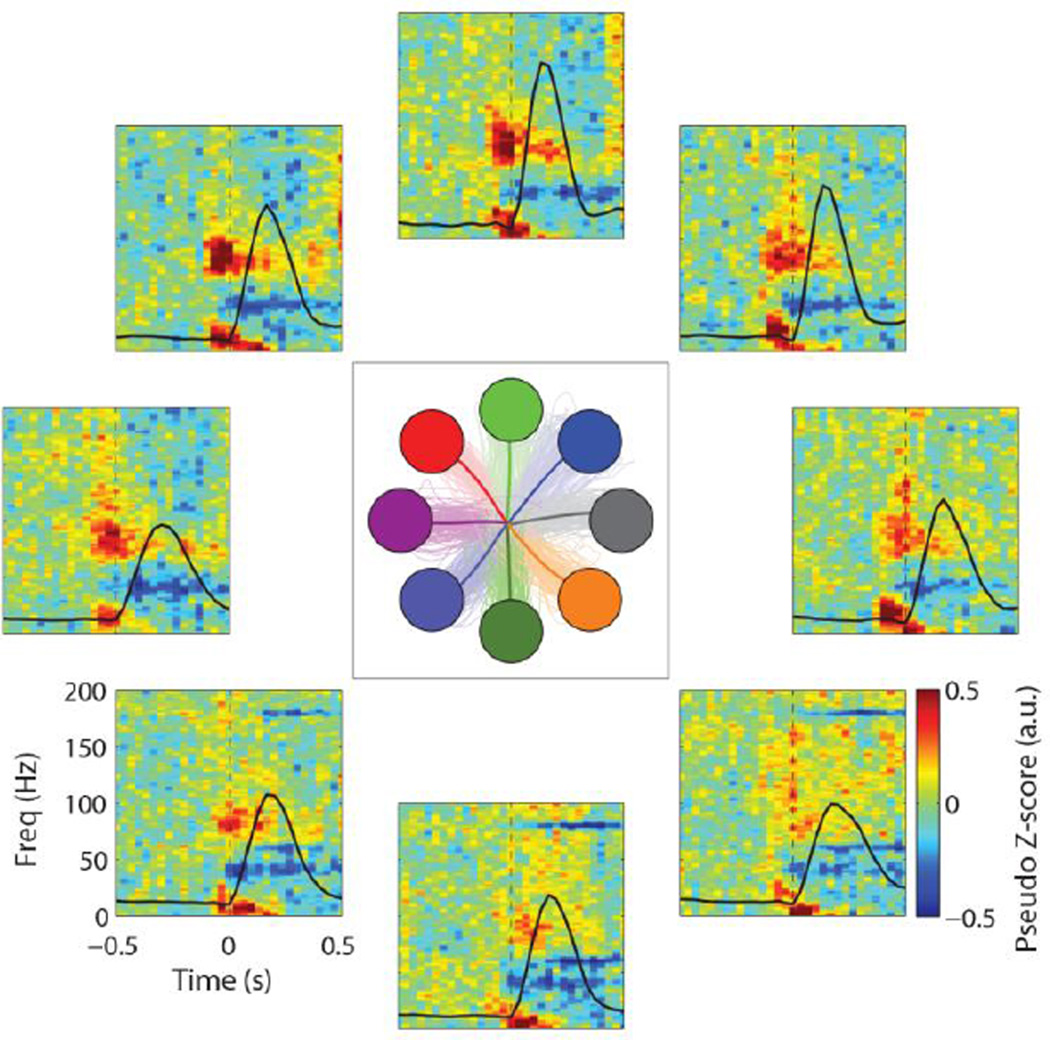
Main results: Histological analysis revealed minimal damage to the cortex underneath the implant, though the grid itself was encapsulated in collagenous tissue. We observed macrophages and foreign body giant cells at the tissue-array interface, indicative of a stereotypical foreign body response. Despite this encapsulation, cortical modulation during reaching movements was observed more than 18 months post-implantation.

Significance: These results suggest that ECoG may provide a means by which stable chronic cortical recordings can be obtained with comparatively little tissue damage, facilitating the development of clinically viable BMI systems.


Figures

Figure 1
Figure 1
(A). Top view of the electrode grid. The neural recording electrodes (gray) face the cortical surface. The reference (#4, green) and ground (#13, red) electrodes face the dura. (B). Exposure of the left motor cortex prior to implantation (ArS: arcuate sulcus, CeS: central sulcus). (C). Placement of the electrode grid. (D). 3D rendering of the left-hemisphere superimposed on the mirror image of the right-hemisphere. Heat map denotes difference in surface topography between hemispheres in mm. (E). ECoG grid location superimposed on the postmortem brain. Blue circles indicate electrode sites targeted for histological analysis. Black ink marks the observed location of the rostral-medial and caudal-lateral corners of the grid. (F). Underside of the encapsulated grid following explantation. The location of electrode 1 (e1) is indicated by the white arrow. All scale bars are approximately 2cm unless otherwise indicated.
Figure 2
Figure 2
Long-term ECoG grid implantation causes minimal changes in cortical cytoarchitecture. (A–B). Neither the density of NeuN-labeled neurons (A; green) nor the signal intensity of GFAP-labeling in astrocytes (B; green) located in layers I/II–III or layer V were significantly affected by implantation. Cell nuclei (red) counterstained with Hoescht 33342. Data presented as mean ± SEM; * denotes significant difference from control (p < 0.05). (C). Comparison of Nissl-stained motor cortex between implanted and control hemispheres. Cortical layers are indicated by roman numerals I– VI. Impl: implanted cortex. Ctl: control cortex.
Figure 3
Figure 3
Chronic implantation yields higher microglial density with no change in cell morphology. (A). The density of microglia (green; nuclei in red) was significantly increased in layers I/II–III but not in layer V following implantation. Data presented as mean ± SEM; * denotes significant difference from control (P < 0.05). (B). Layer I microglia show no morphological indication of inflammatory response. A small population at the cortical surface of implant and control cortices are polarized along the curvature of the brain, all microglia beneath the surface are unresponsive.
Figure 4
Figure 4
Second-harmonic imaging of fibrous encapsulation reveals fibrous, cell-sparse regions and cell-dense regions in both dorsal and ventral aspects of encapsulation. (A). Sample image of full tissue encapsulation slice. (B) Schematic representation of encapsulation components. (C). Comparison of thickness of dorsal and ventral aspects of encapsulation tissue to control dura. (D). Percentage of SHG(+) tissue was significantly reduced in encapsulation tissue. (E). Sample images of dorsal encapsulation, central encapsulation, and control dura with SHG signal shown in blue and tissue autofluorescence shown in green. Data presented as mean ± SEM. Asterisks * and ** denote significant differences from control at p < 0.01 and p < 0.001, respectively.
Figure 5
Figure 5
Immunohistochemical staining of encapsulation tissue. Tissue was stained for nuclei (blue; Hoescht 33342) and antibodies directed to macrophages (green; Iba-1) or macrophages/fibroblasts (red; vimentin). (A). Array-contacting aspects of the encapsulation were highly cell dense, populated with macrophages (vimentin(+ or −)/ Iba-1(+)) as well as fibroblasts (vimentin(+)/Iba-1(−)). Boxes indicate multinucleated giant cells. Inset: Magnification of a multi-nucleated giant cell. (B). Distal portions of encapsulation were hallmarked by elongated fibroblasts and macrophages (vimentin(−)/Iba-1(+)). (C). Control dura mater is largely composed of elongated fibroblasts with infrequent macrophages.
Figure 6
Figure 6
ECoG signal modulation during 8-target center-out reach tasks. Average time-frequency data are shown for a single electrode (e10) for all reach directions. Averaged (thick lines) and individual trajectories (thin lines) for each target are shown in the center panel. Time-frequency data were normalized with respect to the spectral data during a central hold period preceding each trial. Black lines show average speed profiles for each target.

References

    1. Acharya S, Fifer MS, Benz HL, Crone NE, Thakor NV. Electrocorticographic amplitude predicts finger positions during slow grasping motions of the hand. Journal of Neural Engineering. 2010;7(4):046002. - PMC - PubMed
    1. Adeeb N, Mortazavi MM, Tubbs RS, Cohen-Gadol AA. The cranial dura mater: a review of its history, embryology, and anatomy. Child’s Nervous System. 2012;28(6):827–837. - PubMed
    1. Anderson JM. Biological Response to Materials. Annual Review of Materials Research. 2001;31:81–100.
    1. Anderson JM, Rodriguez A, Chang DT. Foreign Body Reaction to Biomaterials. Seminars in Immunology. 2008;20(2):86–100. - PMC - PubMed
    1. Ashmore R, Endler B, Smalianchuk I, Degenhart A, Hatsopoulos N, Tyler-Kabara E, Batista A, Wang W. Stable Online Control of an Electrocorticographic Brain-Computer Interface Using a Static Decoder. Conf Proc IEEE Eng Med Biol Soc. 2012;2012:1740–1744. - PubMed

Publication types

Substances