Review
. 2016 Nov:55:32-51.
doi: 10.1016/j.preteyeres.2016.06.002. Epub 2016 Jun 22.

Structural and molecular bases of rod photoreceptor morphogenesis and disease

Affiliations
Review

Structural and molecular bases of rod photoreceptor morphogenesis and disease

Theodore G Wensel et al. Prog Retin Eye Res. 2016 Nov.

Abstract

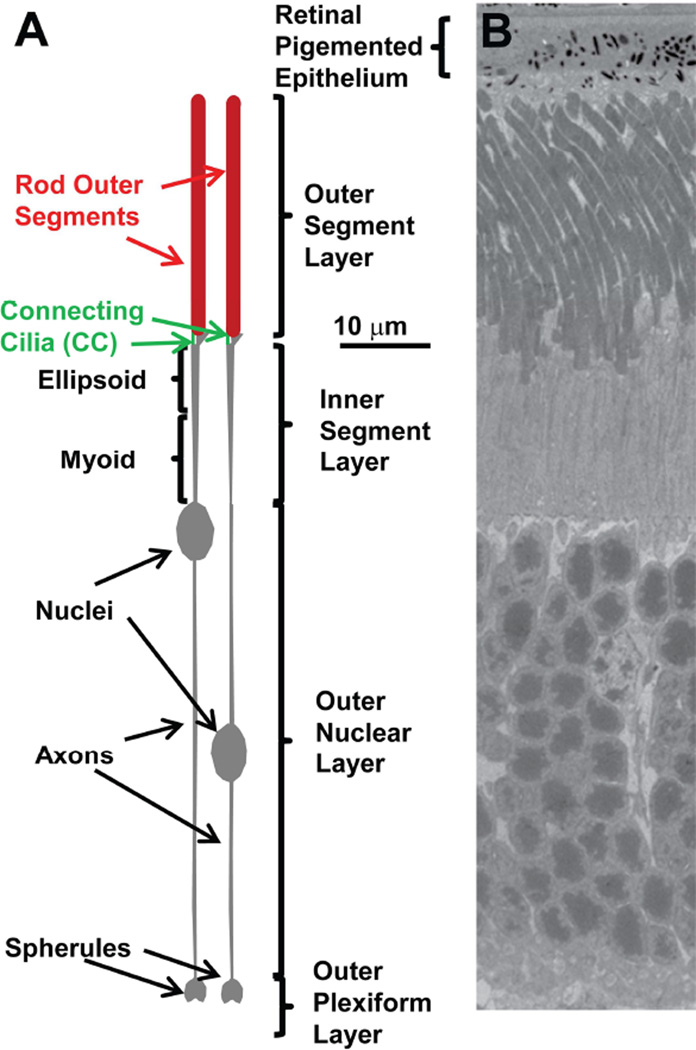
The rod cell has an extraordinarily specialized structure that allows it to carry out its unique function of detecting individual photons of light. Both the structural features of the rod and the metabolic processes required for highly amplified light detection seem to have rendered the rod especially sensitive to structural and metabolic defects, so that a large number of gene defects are primarily associated with rod cell death and give rise to blinding retinal dystrophies. The structures of the rod, especially those of the sensory cilium known as the outer segment, have been the subject of structural, biochemical, and genetic analysis for many years, but the molecular bases for rod morphogenesis and for cell death in rod dystrophies are still poorly understood. Recent developments in imaging technology, such as cryo-electron tomography and super-resolution fluorescence microscopy, in gene sequencing technology, and in gene editing technology are rapidly leading to new breakthroughs in our understanding of these questions. A summary is presented of our current understanding of selected aspects of these questions, highlighting areas of uncertainty and contention as well as recent discoveries that provide new insights. Examples of structural data from emerging imaging technologies are presented.

Keywords: Ciliopathies; Cryo-electron tomography; Disease mechanisms; Photoreceptor; Retinal degeneration; Retinal imaging.


Figures

Figure 1
Figure 1
A. Schematic drawing of mouse rods. Sub-regions of the cell are depicted according to the indicated scale based on dimensions taken from a range of microscopic techniques. This accurate scaling is in contrast to highly distorted scales typically used in cartoons of rods. B. Transmission electron micrograph showing the corresponding retinal layers from a mouse retina. Sample preparation and imaging were as described in (He et al., 2016).
Figure 2
Figure 2
Conventional transmission electron microscopy of mouse rod sensory cilium. Sample preparation and imaging were as described in (He et al., 2016). A. Longitudinal section showing connecting cilium and adjacent regions of outer and inner segments (Labels: d, disks; cc, connecting cilium; bb, basal body complex; a, axoneme; m, mitochondria). B-F, cross-sectional views through the same regions. B, a region where the CC membrane is continuous with the plasma membrane. C, a connecting cilium sectioned near the base of the outer segment (d, disks). D, a centriole next to a connecting cilium from an adjacent cell (y, y-links; bp, base plate or terminal plate, a structure observed within the lumen of the transition zone immediately above the mother centriole). E, a basal body complex (bb), showing the triplet microtubules (t) of one centriole. F. An isolated centriole with visible microtubule triplets (t).
Figure 3
Figure 3
Cryo-ET data from WT mouse rods (Gilliam et al., 2012). A. Projection image through slice of tomogram (grayscale) with overlaid segmented isosurfaces (color) showing the basal body complex (mother centriole, mc; daughter centriole, dc), the base of the connecting cilium/transition zone, with segmented a, b, and c microtubules (colored red, green and blue, respectively), and adjacent intracellular fibers and organelles, including mitochondria (m), electron-dense ribosomes (ri), and ciliary rootlet (rt). B. Partially segmented image, highlighting the a, b, and c microtubules (colored red, green and blue, respectively), and fibers (tan and magenta) connecting the microtubular structures to one another (tan) and to ciliary and cellular membranes (magenta). C. Slice through a tomogram of a rod cell fragment. The outer segment has been isolated from most of the inner segment, and the inner segment membrane has resealed to contain the mother (mc) and daughter (dc) centrioles as well as numerous membrane vesicles. The outer segment is flattened, revealing the disks (d) emanating from the axoneme (ax) above the transition zone (tz). D. Slice through a tomogram showing the highly ordered stack of disks (d) on the edge of a rod outer segment, and their relationship to the OS plasma membrane (pm).
Figure 4
Figure 4
Enhancement of cryo-ET reconstruction of a daughter centriole by sub-tomogram averaging. A. External view perpendicular to the central axis; B. cut-away view with outer half removed to reveal internal structures; C. Cross-sectional views of slices taken at the indicated axial positions. Colors indicate distance from central axis, orange (closest) to blue (furthest).
Figure 5
Figure 5
Reconstruction of a transition zone/connecting cilium base from cryo-electron tomography (Cryo-ET) data, with sub-tomogram averaging used to enhance signal-to-noise. A. Tomogram with segmented region highlighted in light yellow. B. segmented version with color-coding of axial displacements; C-E, cross-sectional views of the maps resulting from sub-tomogram averaging of the nine microtubule doublets and membranes, with axial displacement of each section color-coded as in B.
Figure 6
Figure 6
Super-resolution STORM images of isolated mouse rods. A-F. Centrin 2 immunofluorescence in mouse retinal sections imaged by wide-field fluorescence (A–C) and differential interference contrast (DIC, A), or 3D STORM (D–F). Arrows show the CC in the low-magnification images (B, D) corresponding to the higher magnification views (C, E). The 3D map whose projection is shown in E has been rotated to produce the projection in F, illustrating the nearly isotropic resolution achieved. Each dot in E and F represents a single localization event, corresponding to individual molecule fluorescence. G-I, STORM images at varying magnifications showing rhodopsin immunofluorescence in isolated mouse rods using monoclonal antibody 1-D4, which recognizes the C-terminus of rhodopsin.
Figure 7
Figure 7
A model for the topology of basal disk (s) of mammalian rods. A model consistent with available data proposes that all disks, including the ones nearest to the connecting cilium, are enveloped by the plasma membrane, but that there is continuity with the plasma membrane with the first disk or first few disks, with only a very narrow entry-way into the lumen of the basal disk (s), which would be continuous with the extracellular space. A. Schematic of outside view of basal outer segment, with disks visible through translucent plasma membrane. B. Schematic representation of a section through a tomographic map of an outer segment based, derived from results reported in (Volland et al., 2015). Labeled structures are i, invaginations of plasma membrane; n, nascent disks; d, mature disks, p, plasma membrane
Figure 8
Figure 8
Alternative models of basal body and connecting cilium structure based on cryo-electron tomography of isolated mouse rods. Panel A shows a model for the structural organization of the regions of the rod cell adjacent to the connecting cilium, based on available structural data, largely from various EM techniques. Distinctive features include: intersection of fibers emanating from the axoneme with tubules running along the length of the transition zone giving rise to the characteristic “Y-shaped links” in cross section; absence of clearly-defined triangular “alar sheet” transition fibers, and presence of multiple filaments connecting the microtubules to the plasma and ciliary membranes; vesicles adjacent to and within the lumen of the connecting cilium; filaments extending from the cytoplasm into the cilium lumen; thinning of basal body from minus (triplet) to plus (doublet) end; slight tilt of microtubules with respect to ciliary axis; envelopment of basal disks within plasma membrane (not necessarily to exclusion of some regions of continuity; see text). The arrangement of tubulin dimer units (circles) in doublet microtubules is based on the structure determined by cryo-ET and sub-tomogram averaging of axonemes from Chlamydomonas reinhardtii flagella (Nicastro et al., 2011), and that of the triplet microtubules is based on the basal body structure determined using similar approaches to basal bodies from the same organism (Li et al., 2012). The arrangement of the doublet and triplet microtubules is based on cryo-electron tomography and sub-tomogram averaging of mouse rod centrioles (Figs. 3 and 4 and Zhixian Zhang, Michael F. Schmid, Feng He, Theodore Wensel, unpublished observations). At the base of the outer segment, actin filaments are found within the lumen of the axoneme, and extending out between microtubules to contact the disk membranes (Chaitin and Bok, 1986; Chaitin and Burnside, 1989; Chaitin et al., 1984). Not shown is the daughter centriole invariably associated with the depicted structures. Panel B depicts a standard model of primary cilia, based on reference (Szymanska and Johnson, 2012).

References

    1. Abd-El-Barr MM, Sykoudis K, Andrabi S, Eichers ER, Pennesi ME, Tan PL, Wilson JH, Katsanis N, Lupski JR, Wu SM. Impaired photoreceptor protein transport and synaptic transmission in a mouse model of Bardet-Biedl syndrome. Vision Res. 2007;47:3394–3407. - PMC - PubMed
    1. Adams NA, Awadein A, Toma HS. The retinal ciliopathies. Ophthalmic Genet. 2007;28:113–125. - PubMed
    1. Adekeye A, Haeri M, Solessio E, Knox BE. Ablation of the proapoptotic genes CHOP or Ask1 does not prevent or delay loss of visual function in a P23H transgenic mouse model of retinitis pigmentosa. PLoS One. 2014;9:e83871. - PMC - PubMed
    1. Aguirre G. Hereditary retinal diseases in small animals. The Veterinary clinics of North America. 1973;3:515–528. - PubMed
    1. Aguirre G, Acland G, Chader G. Hereditary retinal degenerations in the dog: specificity of abnormal cyclic nucleotide metabolism to diseases of arrested photoreceptor development. Birth defects original article series. 1982;18:119–133. - PubMed

Publication types

MeSH terms

Substances