. 2016 Jun 27;213(7):1353-74.
doi: 10.1084/jem.20160081.

Mast cells regulate myofilament calcium sensitization and heart function after myocardial infarction

Affiliations

Mast cells regulate myofilament calcium sensitization and heart function after myocardial infarction

Anta Ngkelo et al. J Exp Med. .

Abstract

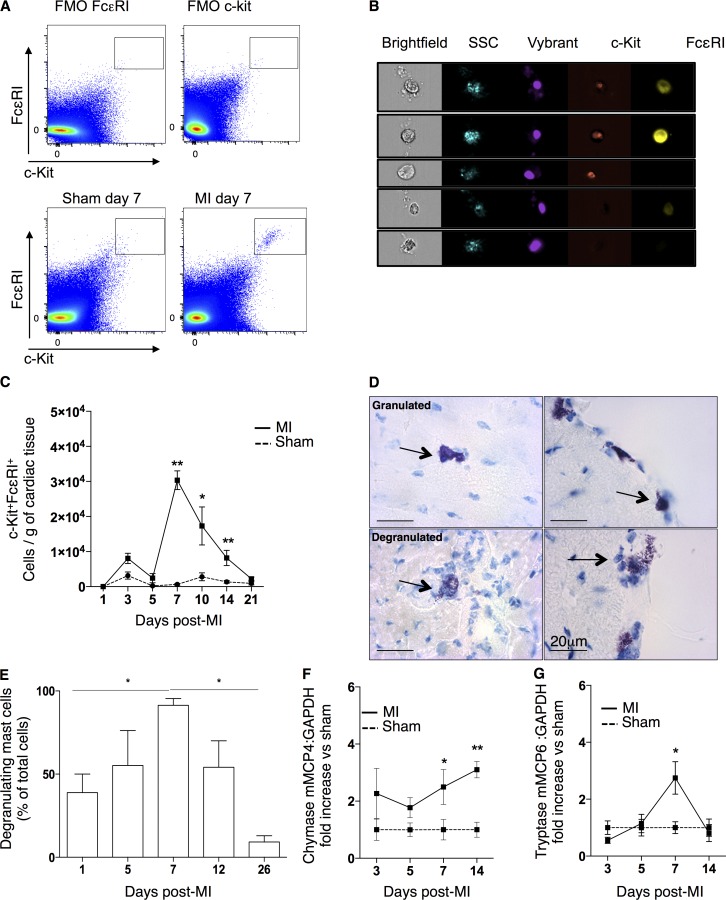
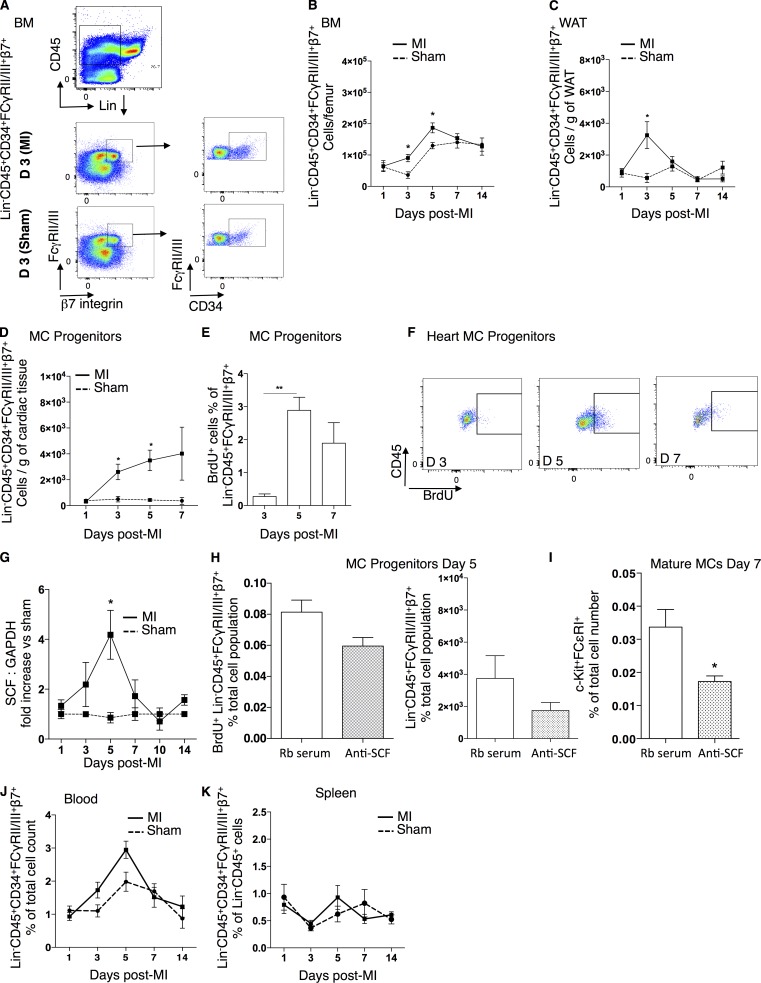
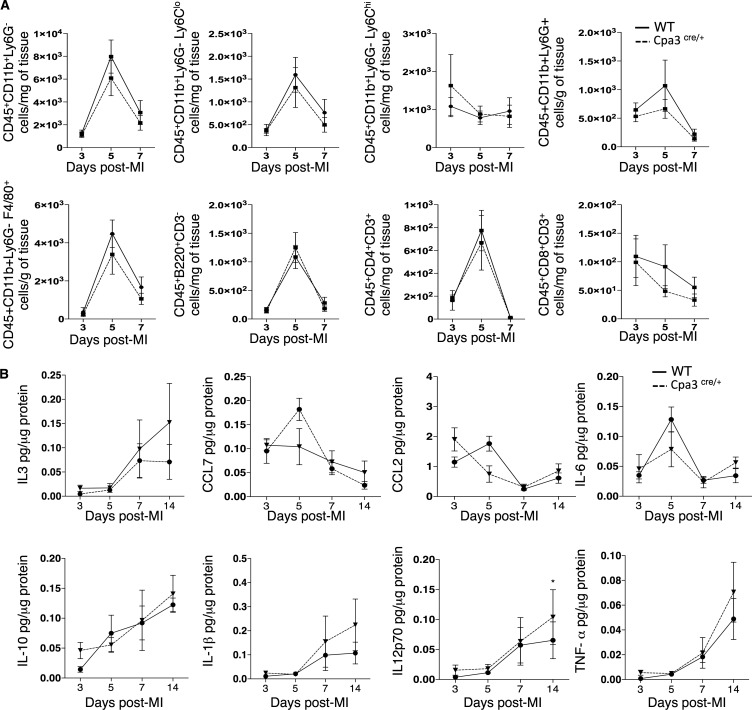
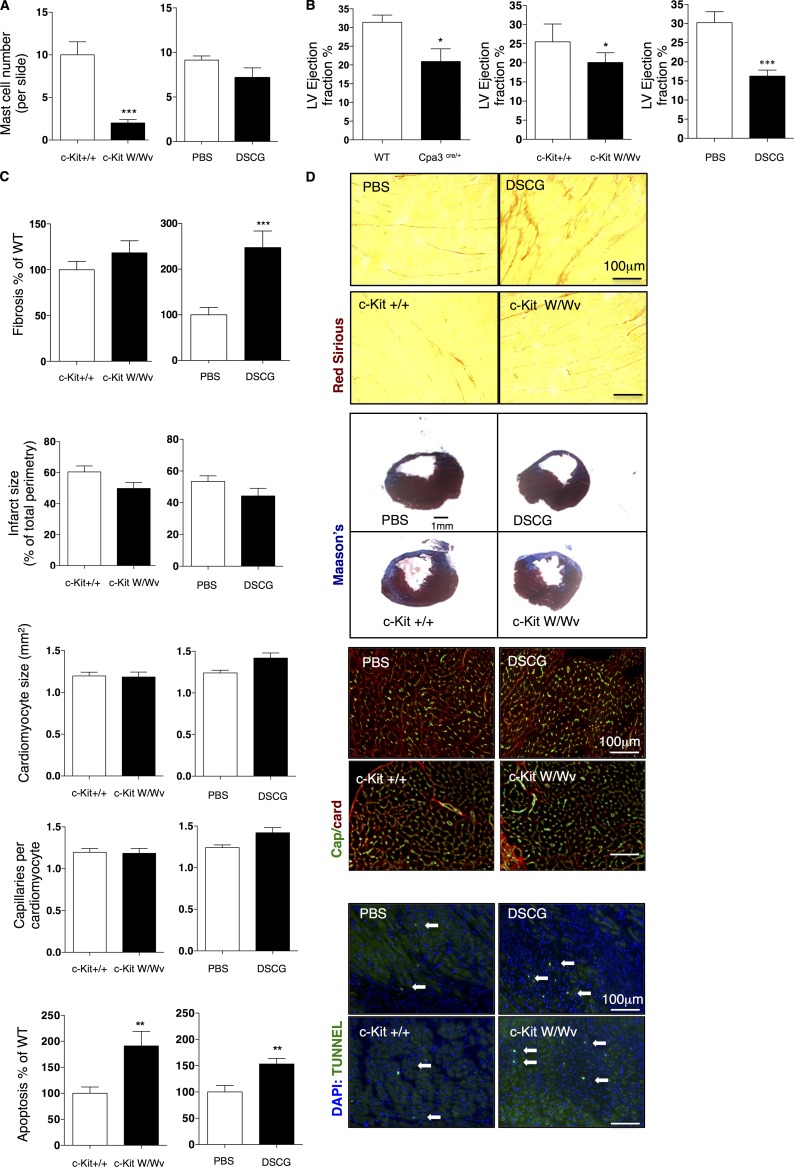
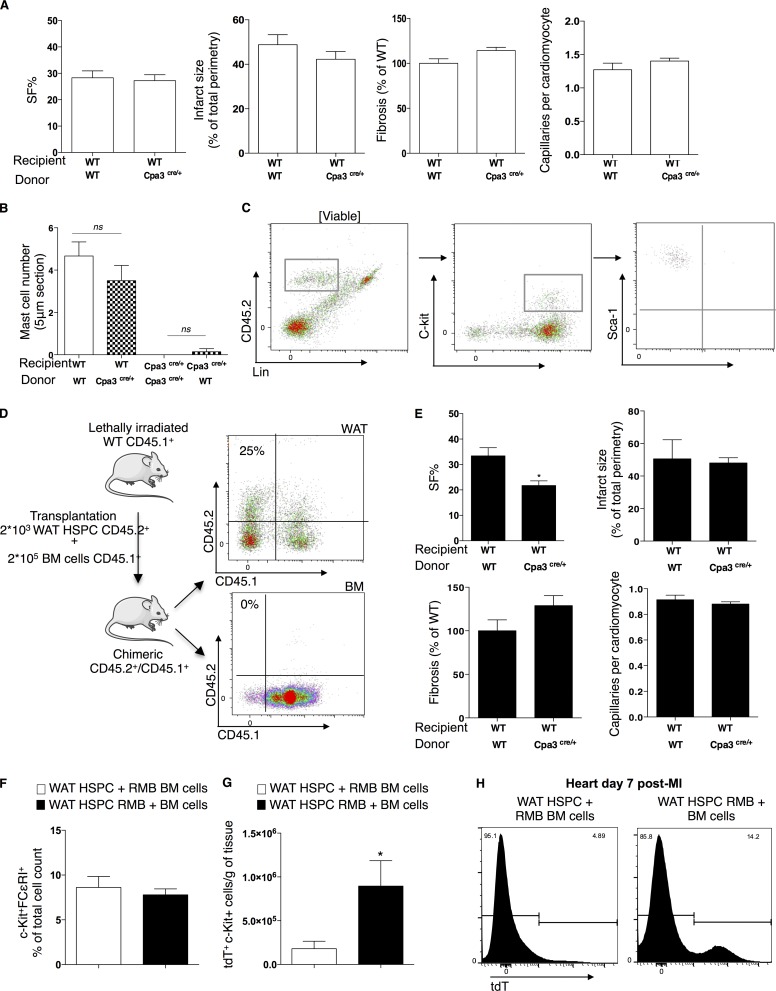
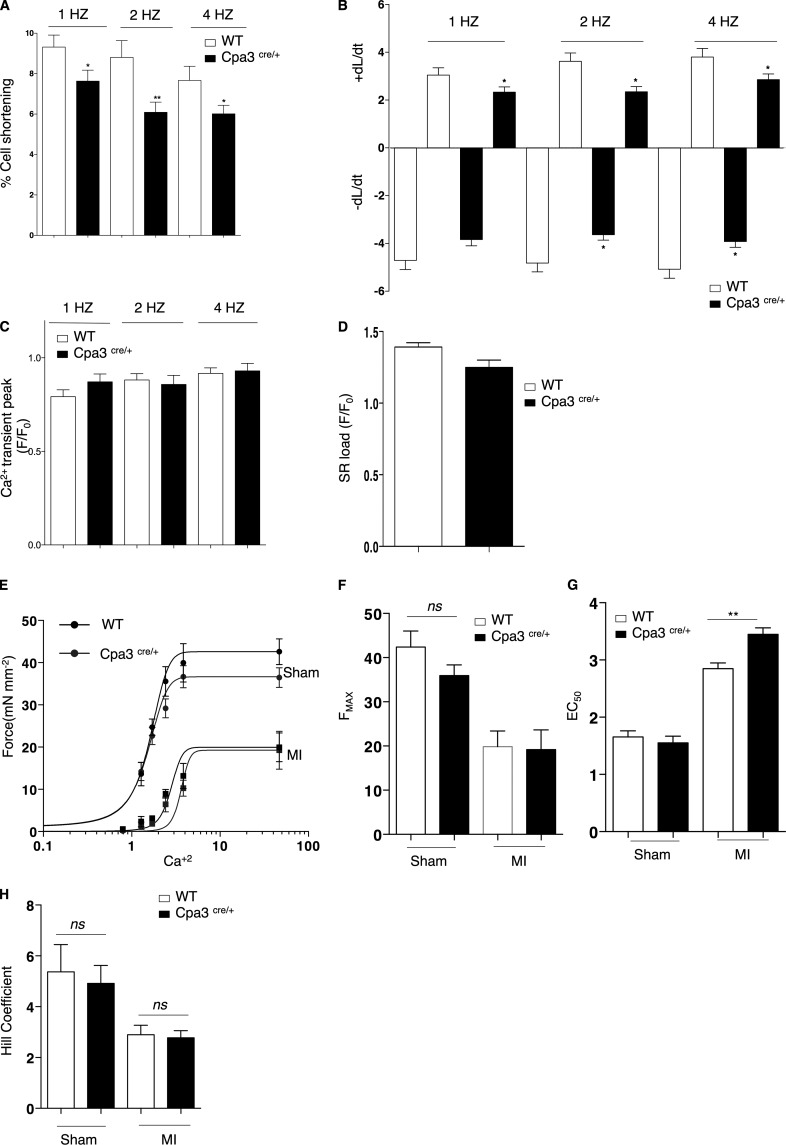
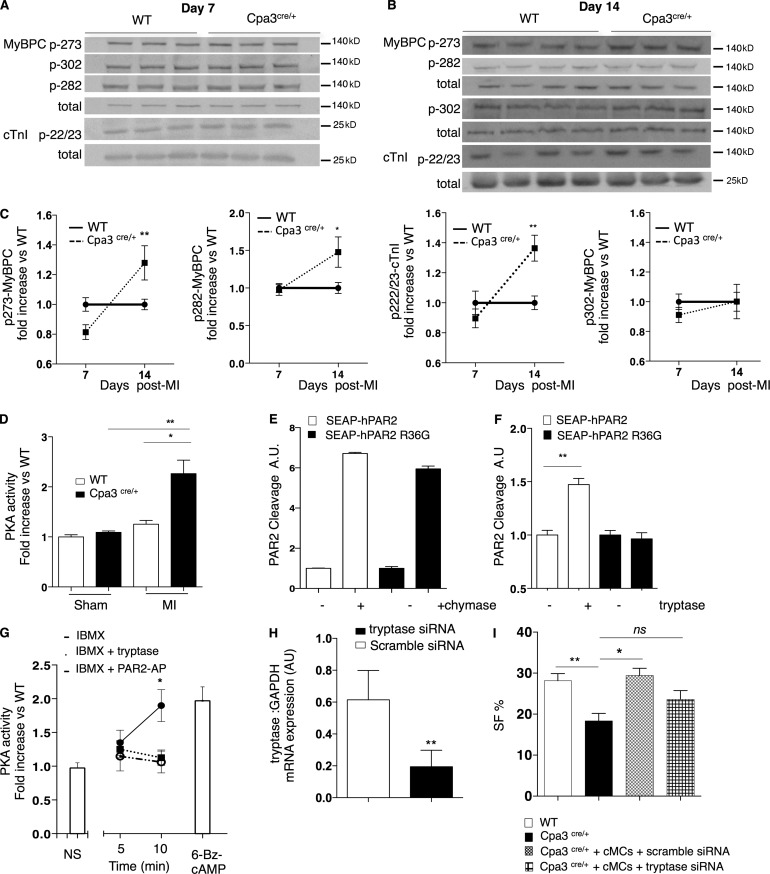
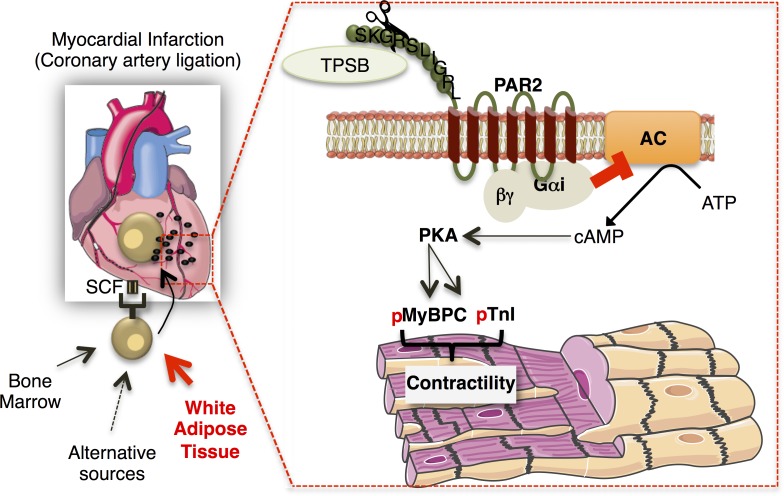
Acute myocardial infarction (MI) is a severe ischemic disease responsible for heart failure and sudden death. Inflammatory cells orchestrate postischemic cardiac remodeling after MI. Studies using mice with defective mast/stem cell growth factor receptor c-Kit have suggested key roles for mast cells (MCs) in postischemic cardiac remodeling. Because c-Kit mutations affect multiple cell types of both immune and nonimmune origin, we addressed the impact of MCs on cardiac function after MI, using the c-Kit-independent MC-deficient (Cpa3(Cre/+)) mice. In response to MI, MC progenitors originated primarily from white adipose tissue, infiltrated the heart, and differentiated into mature MCs. MC deficiency led to reduced postischemic cardiac function and depressed cardiomyocyte contractility caused by myofilament Ca(2+) desensitization. This effect correlated with increased protein kinase A (PKA) activity and hyperphosphorylation of its targets, troponin I and myosin-binding protein C. MC-specific tryptase was identified to regulate PKA activity in cardiomyocytes via protease-activated receptor 2 proteolysis. This work reveals a novel function for cardiac MCs modulating cardiomyocyte contractility via alteration of PKA-regulated force-Ca(2+) interactions in response to MI. Identification of this MC-cardiomyocyte cross-talk provides new insights on the cellular and molecular mechanisms regulating the cardiac contractile machinery and a novel platform for therapeutically addressable regulators.


Figures

Figure 1.
Figure 1.
Characterization of cardiac mature MCs after MI. (A and B) Representative fluorescence minus one control (FMO) and flow cytometry gating for mature cardiac MCs (c-kit+FcεRI+) at day 7 in sham-operated and infarcted myocardium (A) and representative image of ImageStream flow cytometer showing the morphology of Vybrant+c-kit+FcεRI+ cells under brightfield and side scatter (SSC) imaging with corresponding negative controls (B). (C) Time-dependent monitoring cardiac mature MCs/gram of cardiac tissue in response to infarction (n = 4–8, two independent experiments). *, P < 0.05; **, P < 0.01. Kruskal–Wallis and Dunn’s post hoc test for comparisons for sham versus MI at different time points. (D) Representative cardiac TB staining of mature MCs at granulated (above) and degranulated (below) states found both in the myocardium (left) and at the periphery (right). Arrows point to representative cardiac MCs. (E) Cardiac degranulated cells as the percentage of total cells counted by TB staining (n = 6, two independent experiments). *, P < 0.05. Kruskal–Wallis and Dunn’s post hoc test for comparisons at different time points. (F and G) Cardiac mRNA expression of chymase mMCP4 and tryptase mMCP6 at different time points after the sham operation or infarction (n = 6–8). *, P < 0.05; **, P < 0.01. Kruskal–Wallis and Dunn’s post hoc test for comparisons for sham versus MI at different time points. All data shown are representative of at least three independent experiments. All values are presented as mean ± SEM. Sham, sham-operated animals.
Figure 2.
Figure 2.
SCF-dependent accumulation of cardiac mature MCs. (A) Representative flow cytometry gating for MCPs (LinCD45+CD34+β7-integrin+FCγRII/III+) in the BM of sham-operated mice versus mice with MI at day 3. (B and C) Time-dependent increase of MCPs at days 3 and 5 after MI in the BM (B) and at day 3 in WAT (C) compared with sham control mice (n = 4–9, two independent experiments). *, P < 0.05, Kruskal–Wallis and Dunn’s post hoc test for comparisons of sham versus MI at different time points. (D) Numbers of MCPs/gram of cardiac tissue after infarct versus sham-operated mice (n = 4–9, two independent experiments). *, P < 0.05, Kruskal–Wallis and Dunn’s post hoc test for comparisons of sham versus MI at different time points. (E) Increased proliferation of cardiac MCPs at day 5 of infarct, 24 h after BrdU administration (n = 8, two independent experiments). **, P < 0.01, Kruskal–Wallis and Dunn’s post hoc test for comparisons at different time points. (F) Representative flow cytometry analysis of BrdU+ MCPs at days 3, 5, and 7 after infarct. (G) mRNA expression of SCF in the cardiac tissue in response to infarction (vs. sham) peaking at day 5 (n = 5–10, two independent experiments). *, P < 0.05, Kruskal–Wallis and Dunn’s post hoc test for comparisons of sham versus MI at different time points. (H) No significant effect of SCF antibody treatment on proliferation (left) and number (right) of CD45+β7-integrin+FCγRII/III+ cells at day 5 after MI (n = 6–8, two independent experiments). Mann–Whitney test for comparisons between groups. (I) SCF antibody reduced total numbers of mature MCs at day 7 after MI (n = 6–8, two independent experiments). *, P < 0.05, Mann–Whitney test for comparisons between groups. (J and K) MCPs (LinCD45+CD34+FCγRII/III+β7+) were identified circulating in the blood (J) at low percentages and in the spleen (K) with no statistically significant changes in response to MI. Kruskal–Wallis and Dunn’s post hoc test for comparisons of sham versus MI at different time points. All values are presented as mean ± SEM. anti, antibody against; D, day; Rb, rabbit; Sham, sham-operated animals.
Figure 3.
Figure 3.
Depressed cardiac function after MI in Cpa3cre/+ MC-deficient mice. (A) Representative flow cytometry gating of c-kit+FcεRI+ cells in WT that are absent in Cpa3cre/+ mice at day 7 after MI (top); bar graphs show the numbers of mature MCs/gram of cardiac tissue (bottom; n = 5–8, two independent experiments). (B) Representative cardiac TB staining (top) and quantitative evaluation of mature MCs in infarcted heart (n = 5–6, two independent experiments). Arrows point to representative cardiac MCs. (C) Left ventricular %SF, LVIDd (left ventricular internal end-diastolic diameter), and LVIDs (left ventricular internal end-systolic diameter) measurements showing significant reduction of cardiac function (day 14) in Cpa3cre/+ infarcted mice compared with WT (Cpa3+/+) infarcted mice, with no differences on basal heart function (n = 6–7, two independent experiments). *, P < 0.05; **, P < 0.01, Kruskal–Wallis and Dunn’s post hoc test for comparisons between groups. (D) Cardiac fibrosis, infarct size, capillaries’ density, percentage of cell apoptosis, cardiomyocyte size, and number after infarction (day 14) in WT and Cpa3cre/+ mice (n = 6–7, two independent experiments). (E) Representative images used for quantification of fibrosis, capillary density, infarct size, and density of apoptotic cardiac cells. Arrows point to representative apoptotic cells. All values are presented as mean ± SEM. Sham, sham-operated animals; WT, Cpa+/+ littermates.
Figure 4.
Figure 4.
Cpa3cre/+ mice have a normal inflammatory response after MI. (A) Inflammatory cell density (monocytes, macrophages, and B and T lymphocytes) in Cpa3cre/+ mice was comparable with that of WT mice at days 3, 5, and 7 after MI (n = 7–8, two independent experiments). (B) Inflammatory mediators’ concentration (IL3, CCL7, CCL2, IL-6, IL-10, IL-1β, IL12p70, and TNF; pg/µg of protein) was analyzed by FlowCytomix, and no differences were observed between WT and Cpa3cre/+ mice at days 3, 5, 7, and 14 after MI (n = 6–8, 2 independent experiments). All values are presented as mean ± SEM. WT, Cpa+/+ littermates.
Figure 5.
Figure 5.
Cardiac function and remodeling in c-KitW/Wv and DSCG-treated mice. (A) TB-assisted MC counting in c-Kit W/Wv and DSCG-treated mice compared with their controls (c-Kit+/+ and PBS treated, respectively) on 5-µm slide sections (n = 6). (B) Reduced left ventricular (LV) cardiac function (EF%) at day 14 after MI in Cpa3Cre/+, DSCG-treated animals and c-Kit W/Wv compared with their respective controls (n = 6). (C) Evaluation of cardiac remodeling parameters in c-Kit W/Wv and DSCG-treated mice at day 14 after infarction, showing significantly increased levels of fibrosis in DSCG-treated mice and increased number of apoptotic cells in c-Kit W/Wv mice and DSCG-treated mice, with no effect on other parameters (n = 6). (D) Representative images of fibrosis, capillary density, infarct size, and apoptotic cardiac cells. Arrows point to representative apoptotic cells. All data represent two independent experiments. *, P < 0.05; **, P < 0.01; ***, P < 0.001, Mann–Whitney nonparametric test. All values are presented as mean ± SEM. PBS, PBS-treated animals; WT, Cpa+/+ littermates.
Figure 6.
Figure 6.
Cardiac MCs derive primarily from WAT HSPCs. (A) Transplantation of WT mice with Cpa3cre/+-derived BM cells had no effect on left ventricular SF%, infarct size, fibrosis, and capillary density in reference to WT animals receiving WT-derived BM cells (n = 16, from three independent experiments). (B) Transplantation of lethally irradiated WT or Cpa3cre/+ mice with WT or Cpa3cre/+-derived BM cells showed no reconstitution or inhibition of cardiac MCs, respectively, as counted on TB-stained heart sections (n = 6–12, two independent experiments). Kruskal–Wallis and Dunn’s post hoc test for comparisons between groups. (C) Representative flow cytometry gating strategy for isolation of HSPCs (CD45.2+c-kit+Sca-1+) in WAT showing the lack of mature FcεRI+ MCs. (D, left) Schematic overview of co-transplantation of lethally irradiated CD45.1+ WT mice with both FACS-sorted WAT-HSPCs (c-kit+LinSca+) from CD45.2+ mice and BM cells from CD45.1+ cells. WAT-HSPCs were isolated from WT, Cpa3cre/+, or RMB mice. (right) Representative example of chimerism evaluation in the WAT and the BM by flow cytometry–assisted counting of WAT-derived CD45.2+ cells in CD45.1+ recipient mice transplanted with both FACS-sorted WAT-HSPCs from WT CD45.2+ mice and BM cells from WT CD45.1+ cells. (E) Transplantation of WT mice with WAT-HSPCs from Cpa3cre/+ led to depressed left ventricular SF% at day 14 after infarction (n = 7, two independent experiments) without any changes in infarct size, fibrosis, and capillary density. *, P < 0.05, Mann–Whitney nonparametric test. (F) WT mice transplanted with either WAT-HSPCs and RMB-derived BM cells or RMB-derived WAT HSPCs and BM cells have equal amounts of mature cardiac MCs at day 7 after infarction (n = 4–5, two independent experiments). (G) Cardiac tdT+c-kit+ cell numbers were higher in the WT mice transplanted with RMB-derived WAT HSPCs and BM cells compared with those transplanted with WAT-HSPC and RMB-derived BM cells (day 7 after MI; n = 8–10, two independent experiments). *, P < 0.05, Mann–Whitney nonparametric test. (H) Representative image of tdT+ cells in the heart 7 d after infarction. All values are presented as mean ± SEM. ns, not significant; WT, Cpa+/+ littermates.
Figure 7.
Figure 7.
Reduced contractility and myofilament Ca2+ sensitization in Cpa3cre/+ mice after infarction. (A) Depressed left ventricular cardiomyocyte cell shortening (%) of Cpa3cre/+-derived intact cardiomyocytes versus WT cardiomyocytes in response to field stimulation (1, 2, and 4 Hz; n = 30–50, two independent experiments). *, P < 0.05; **, P < 0.01, Kruskal–Wallis and Dunn’s post hoc test for comparisons between groups. (B) Both contraction and relaxation kinetics were significantly reduced in Cpa3cre/+-derived cardiomyocytes versus WT cardiomyocytes (n = 30–50, two independent experiments). *, P < 0.05, Kruskal–Wallis and Dunn’s post hoc test for comparisons between groups. (C) MC deficiency had no effect on Ca2+ transient peak (n = 30–50, two independent experiments). (D) SR Ca2+ content in response to 1-Hz electric stimulation and after caffeine (10 mmol/l) was similar in both WT and Cpa3cre/+-derived cardiomyocytes (n = 30–50, two independent experiments). (E) Force–calcium fitted curves reflecting Ca2+ responsiveness of left ventricle peri-infarcted skinned myocytes from WT and Cpa3cre/+ mice after sham operation or MI. Reduced Ca2+ sensitivity in both WT and Cpa3cre/+-derived skinned myocytes in response to MI with a shift to the right in Cpa3cre/+-derived myocytes versus WT (n = 5–8, two independent experiments). (F and G) Fmax was not altered between WT and Cpa3cre/+-derived myocytes (F), but MC deficiency caused Ca2+ desensitization with a significant increase in EC50 (G; n = 5–8, two independent experiments). **, P < 0.01, Kruskal–Wallis and Dunn’s post hoc test for comparisons between groups. (H) No difference in Hill coefficient as a measure of Ca2+ cooperativity (n = 5–8, two independent experiments). All values are presented as mean ± SEM. ns, not significant; Sham, sham-operated animals; SR, sarcoplasmic reticulum.
Figure 8.
Figure 8.
MC-dependent myofilament phosphorylation via tryptase-induced PAR2 activation. (A and B) Representative Western blots for phosphorylated cTnI (Ser22/23) and MyBPC (Ser273, Ser302, and Ser282) and total proteins levels from peri-infarcted cardiac tissue of WT and Cpa3cre/+ at day 7 after MI (A) and at day 14 after infarction (B). (C) Quantified levels of p273-, p282-, and p302-MyBPC and p22/23-cTnI normalized to total protein levels showing increased myofilament phosphorylation in Cpa3cre/+ mice at day 14 after infarction (n = 7–13, three independent experiments). *, P < 0.05; **, P < 0.01, Kruskal–Wallis and Dunn’s post hoc test for comparisons between groups. (D) Increased PKA activity (A.U.) in peri-infarcted area of Cpa3cre/+ cardiac tissue at day 14 after infarction (n = 4 for sham, n = 10 for MI from four independent experiments). *, P < 0.05; **, P < 0.01, Kruskal–Wallis and Dunn’s post hoc test for comparisons between groups. (E) Treatment with recombinant MC chymase cleaved PAR2 in a non–R36-specific/canonical manner (n = 3, two independent experiments). (F) Recombinant mouse tryptase cleaved PAR2 only at canonical R36 site (n = 4, two independent experiments). **, P < 0.01, Kruskal–Wallis and Dunn’s post hoc test for comparisons between groups. (G) IBMX-induced activation of PKA in H9C2 cardiomyocytes is inhibited in the presence of tryptase or PAR2-AP; 6-Bz-cAMP was used as a positive control (n = 4, two independent experiments). *, P < 0.05, Kruskal–Wallis and Dunn’s post hoc test for comparisons between groups. (H) siRNA-induced mRNA knockdown of tryptase in cardiac MCs at 16 h after transfection (n = 4, two independent experiments). **, P < 0.01, Mann–Whitney nonparametric test. (I) Depressed SF% (day 14) is restored in Cpa3cre/+ mice by trans-cutaneous (echo-guided) injection of cardiac FACS-sorted Vybrant+ MCs (sorted at day 6 after infarction; n = 7) but not restored by MCs treated with tryptase siRNA (n = 3). All data are from two independent experiments. *, P < 0.05; **, P < 0.01, Kruskal–Wallis and Dunn’s post hoc test for comparisons between groups. All values are presented as mean ± SEM. ns, not significant.
Figure 9.
Figure 9.
Schematic diagram showing the proposed mechanism of MC-dependent myofilament Ca2+ sensitization after MI. MCs, originating primarily from WAT, infiltrate the heart after MI and regulate cardiac function via regulation of myofilament protein phosphorylation, cTnI, and MyBPC. The mechanism proposed involves tryptase-regulated PAR2 activation with subsequent Gi activation inhibiting cAMP/PKA activity. AC, adenylyl cyclase; p, phosphoryl group.

Similar articles

Cited by

References

    1. Akers, I.A., Parsons M., Hill M.R., Hollenberg M.D., Sanjar S., Laurent G.J., and McAnulty R.J.. 2000. Mast cell tryptase stimulates human lung fibroblast proliferation via protease-activated receptor-2. Am. J. Physiol. Lung Cell. Mol. Physiol. 278:L193–L201. - PubMed
    1. Antoniak, S., Rojas M., Spring D., Bullard T.A., Verrier E.D., Blaxall B.C., Mackman N., and Pawlinski R.. 2010. Protease-activated receptor 2 deficiency reduces cardiac ischemia/reperfusion injury. Arterioscler. Thromb. Vasc. Biol. 30:2136–2142. 10.1161/ATVBAHA.110.213280 - DOI - PMC - PubMed
    1. Antsiferova, M., Martin C., Huber M., Feyerabend T.B., Förster A., Hartmann K., Rodewald H.R., Hohl D., and Werner S.. 2013. Mast cells are dispensable for normal and activin-promoted wound healing and skin carcinogenesis. J. Immunol. 191:6147–6155. 10.4049/jimmunol.1301350 - DOI - PubMed
    1. Arteaga, G.M., Warren C.M., Milutinovic S., Martin A.F., and Solaro R.J.. 2005. Specific enhancement of sarcomeric response to Ca2+ protects murine myocardium against ischemia-reperfusion dysfunction. Am. J. Physiol. Heart Circ. Physiol. 289:H2183–H2192. 10.1152/ajpheart.00520.2005 - DOI - PubMed
    1. Arumugam, T., Ramachandran V., and Logsdon C.D.. 2006. Effect of cromolyn on S100P interactions with RAGE and pancreatic cancer growth and invasion in mouse models. J. Natl. Cancer Inst. 98:1806–1818. 10.1093/jnci/djj498 - DOI - PMC - PubMed

MeSH terms

Associated data