. 2017 Jan 1;595(1):93-124.
doi: 10.1113/JP272470. Epub 2016 Nov 6.

Role of Cl- -HCO3- exchanger AE3 in intracellular pH homeostasis in cultured murine hippocampal neurons, and in crosstalk to adjacent astrocytes

Affiliations

Role of Cl- -HCO3- exchanger AE3 in intracellular pH homeostasis in cultured murine hippocampal neurons, and in crosstalk to adjacent astrocytes

Ahlam I Salameh et al. J Physiol. .

Abstract

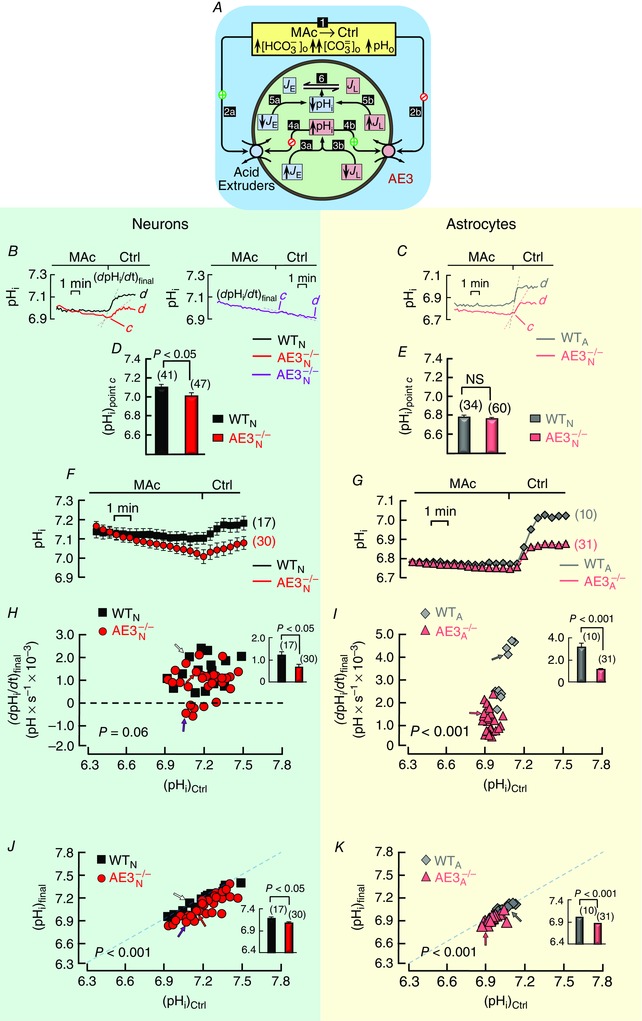
Key points: A polymorphism of human AE3 is associated with idiopathic generalized epilepsy. Knockout of AE3 in mice lowers the threshold for triggering epileptic seizures. The explanations for these effects are elusive. Comparisons of cells from wild-type vs. AE3-/- mice show that AE3 (present in hippocampal neurons, not astrocytes; mediates HCO3- efflux) enhances intracellular pH (pHi ) recovery (decrease) from alkali loads in neurons and, surprisingly, adjacent astrocytes. During metabolic acidosis (MAc), AE3 speeds initial acidification, but limits the extent of pHi decrease in neurons and astrocytes. AE3 speeds re-alkalization after removal of MAc in neurons and astrocytes, and speeds neuronal pHi recovery from an ammonium prepulse-induced acid load. We propose that neuronal AE3 indirectly increases acid extrusion in (a) neurons via Cl- loading, and (b) astrocytes by somehow enhancing NBCe1 (major acid extruder). The latter would enhance depolarization-induced alkalinization of astrocytes, and extracellular acidification, and thereby reduce susceptibility to epileptic seizures.

Abstract: The anion exchanger AE3, expressed in hippocampal (HC) neurons but not astrocytes, contributes to intracellular pH (pHi ) regulation by facilitating the exchange of extracellular Cl- for intracellular HCO3- . The human AE3 polymorphism A867D is associated with idiopathic generalized epilepsy. Moreover, AE3 knockout (AE3-/- ) mice are more susceptible to epileptic seizure. The mechanism of these effects has been unclear because the starting pHi in AE3-/- and wild-type neurons is indistinguishable. The purpose of the present study was to use AE3-/- mice to investigate the role of AE3 in pHi homeostasis in HC neurons, co-cultured with astrocytes. We find that the presence of AE3 increases the acidification rate constant during pHi recovery from intracellular alkaline loads imposed by reducing [CO2 ]. The presence of AE3 also speeds intracellular acidification during the early phase of metabolic acidosis (MAc), not just in neurons but, surprisingly, in adjacent astrocytes. Additionally, AE3 contributes to braking the decrease in pHi later during MAc in both neurons and astrocytes. Paradoxically, AE3 enhances intracellular re-alkalization after MAc removal in neurons and astrocytes, and pHi recovery from an ammonium prepulse-induced acid load in neurons. The effects of AE3 knockout on astrocytic pHi homeostasis in MAc-related assays require the presence of neurons, and are consistent with the hypothesis that the AE3 knockout reduces functional expression of astrocytic NBCe1. These findings suggest a new type of neuron-astrocyte communication, based on the expression of AE3 in neurons, which could explain how AE3 reduces seizure susceptibility.

Keywords: Slc4a3; acid-base balance; acid-extrusion rate from cells; acid-loading rate of cells; anion exchanger.


Figures

Figure 1
Figure 1. Recovery of pHi from an acute alkali load in hippocampal neurons and astrocytes in mixed culture
A, two representative image pairs for WT (left pair) and AE3−/− (right pair) mixed cultures. Each white outline surrounds a portion of the soma of a neuron or an astrocyte and encompasses an area of interest that led to the data in C and D. B, schematic model describing the anticipated acid–base‐related events in a neuron in response to switching the extracellular solution from 10% CO2/44 mm HCO3 /pH 7.40 (solution 2 in Table 1) to 5% CO2/22 mm HCO3 /pH 7.40 (solution 3). The resulting CO2 efflux produces an alkali load, followed by a slower pHi recovery. The white numerals on black squares describe the postulated sequence of events. C, examples of pHi responses in two HC neurons, WT (black) and AE3−/− (red). The black record comes from the identified neuron in the left portion of A, whereas the red record comes from the identified neuron in the right portion of A. In the upper portion of panel C, the squares on the black trace and the circles on the red trace represent some of the points at which we calculated dpHi/dt from exponential curve fits. The middle portion summarizes ∆pHi between the steady‐state pHi just before switching from 10% to 5% CO2 (point a) and the peak pHi (point b) just before the recovery of pHi from alkalosis for 39 individual WT neurons (black squares; from 5 cultures on 11 coverslips) and 37 individual AE3−/− neurons (red circles; from 3 cultures on 7 coverslips). The lower portion shows plots of dpHi/dt and pHi for the WT and AE3−/− neurons in the main portion of the panel. The slopes of the lines (not shown) through each set of points represent the exponential rate constant k down – computed as described in Methods – whereas the x‐intercepts represent the hypothetical pHi at infinite time, (pHi). Supplementary Fig. S1 in the online supporting material includes plots of dpHi/dt and pHi for all neurons in this part of the study. D, examples of pHi responses in two HC astrocytes, WT (grey) and AE3−/− (pink). The grey record comes from the identified astrocyte in the left portion of panel A, whereas the pink record comes from the identified astrocyte in the right portion of panel A. The middle and lower portions are comparable to those in C, but for 29 individual WT astrocytes (grey diamonds; from 5 cultures on 11 coverslips) and 20 individual AE3−/− astrocytes (pink triangles; from 3 cultures on 7 coverslips). Supplementary Fig. S2 includes plots of dpHi/dt and pHi for all astrocytes in this part of the study. E, relationship between k down and (pHi) for 39 individual WT neurons (black squares) and 37 individual AE3−/− neurons (red circles). The two arrows identify the neurons in the upper portion of D. The inset shows mean k down values, computed over all (pHi) values. The vertical dashed lines represent the calculated reversal pHi values for the transporters NDCBE and NBCe1, as described in Table 3. F, relationship between k down and (pHi) for 29 individual WT astrocytes (grey diamonds) and 20 individual AE3−/− astrocytes (pink triangles). The two arrows identify the astrocytes in the upper portion of panel D. The inset is comparable to that in E. For the two upper insets in C and D, and for the insets in E and F (i.e. bar graphs), we performed two‐tailed unpaired t tests between WT and AE3−/− cells. For the main portions of E and F (i.e. scatter plots), we performed multivariate ANOVA between WT and AE3−/− cells. WTN, neuron(s) cultured from a wild‐type mouse; AE3N −/−, neuron(s) cultured from an AE3–/– mouse; WTA, astrocyte(s) cultured from a wild‐type mouse; AE3A −/−, astrocyte(s) cultured from an AE3–/– mouse; NS, no significant difference.
Figure 2
Figure 2. Responses of pHi to MAc exposure in hippocampal neurons and astrocytes in mixed culture
A, schematic model describing the anticipated acid–base‐related events in a neuron in response to switching the extracellular solution from 5% CO2/22 mm HCO3 /pH 7.40 (solution 3) to 5% CO2/14 mm HCO3 /pH 7.20 (solution 4). The white numerals in black squares described the postulated sequence of events. B, examples of pHi responses in HC neurons. The left panel shows records from a WT neuron (black) and one extreme of pHi trajectories for AE3−/− neurons (red). The steeper pair of dashed lines represent the maximal initial rates of pHi decline ((dpHi/dt)early) and the shallower pair of dashed lines represent the rates of pHi decline late during MAc ((dpHi/dt)late) when pHi was declining linearly. In Methods, we describe the linear‐fitting procedure. The right panel shows the other extreme of pHi trajectories for AE3−/− neurons. C, examples of pHi responses in HC astrocytes. These records from a WT (grey) and AE3−/− (pink) astrocyte are comparable to those in B. D, mean control (i.e. starting) pHi values ((pHi)Ctrl) for 41 WT neurons (black bar; from 6 cultures, 11 coverslips) and 47 AE3−/− neurons (red bar; from 8 cultures, 11 coverslips), just before MAc exposure, computed as described in Methods. E, mean control pHi values for 34 WT astrocytes (grey bars; from 4 cultures, 7 coverslips) and 60 AE3−/− astrocytes (pink bars; from 5 cultures, 7 coverslips), just before MAc exposure. F, summary of pHi responses to MAc in HC neurons. The panel shows mean responses of 41 WT neurons (black squares) and 47 AE3−/− neurons (red circles) to extracellular MAc. G, summary of pHi responses to MAc in HC astrocytes. The panel shows mean responses of 34 WT astrocytes (grey diamonds) and 60 AE3−/− astrocytes (pink triangles) to extracellular MAc. H, relationship between (dpHi/dt)early and (pHi)Ctrl for 41 individual WT neurons (black squares) and 47 individual AE3−/− neurons (red circles). The arrows identify the neurons in panel B. The inset shows mean (dpHi/dt)early values, computed over all (pHi)Ctrl values. I, relationship between (dpHi/dt)early and (pHi)Ctrl for 34 individual WT astrocytes (grey diamonds) and 60 individual AE3−/− astrocytes (pink triangles). The arrows identify the astrocytes in panel C. The inset is comparable to that in panel H. Supplementary Fig. S3 includes an alternative analysis, plots of the exponential rate constant k down vs. (pHi)Ctrl for WT neurons, WT astrocytes and AE3−/− astrocytes in this part of the study. J, relationship between (dpHi/dt)late and (pHi)Ctrl for 41 individual WT neurons (black squares) and 47 individual AE3−/− neurons (red circles). The inset is comparable to that in panel H, but for (dpHi/dt)late. K, relationship between (dpHi/dt)late and (pHi)Ctrl for 34 individual WT astrocytes (grey diamond) and 60 individual AE3−/− astrocytes (pink triangles). The inset is comparable to that in J. For the bar graphs in panels D and E and in the insets to F, H, G and I, we performed two‐tailed unpaired t tests between WT and AE3−/− cells. For the main portions of F, H, G and I (i.e. scatter plots), we performed multivariate ANOVA between WT and AE3−/− cells.
Figure 3
Figure 3. Recovery of pHi from MAc exposure in hippocampal neurons and astrocytes in mixed culture
A, schematic model describing the anticipated acid–base‐related events in a neuron in response to switching the extracellular solution from MAc (solution 4) back to 5% CO2/22 mm HCO3 /pH 7.40 (solution 3). The white numerals in black squares describe the postulated sequence of events. B, examples of pHi responses in HC neurons. The left panel shows records from a WT neuron (black) and one extreme of pHi trajectories for AE3−/− neurons (red). The dashed lines represent the maximal initial rates of pHi ascent ((dpHi/dt)final). In Methods, we describe the linear‐fitting procedure. The right panel shows the other extreme of pHi trajectories for AE3−/− neurons. The three neurons here are the same as the three in Fig. 2 B. C, examples of pHi responses in HC astrocytes. These records from a WT (grey) and AE3−/− (pink) astrocyte are comparable to those in panel B. The two astrocytes here are the same as the two in Fig. 2 C. D, mean pHi values for 41 WT neurons (black bar) and 47 AE3−/− neurons (red bar), just before MAc removal (point c in B), computed as described in Methods. The 41 and 47 neurons here are the same as those in Fig. 2 D. E, mean pHi values for 34 WT astrocytes (grey bar) and 60 AE3−/− astrocytes (pink bar), just before MAc removal (point c in C). The 34 and 60 astrocytes here are the same as those in Fig. 2 E. F, summary of pHi responses to MAc removal in HC neurons. The panel shows the mean responses of 17 WT neurons (black squares; from 6 cultures, 11 coverslips) and 30 AE3−/− neurons (red circles; from 8 cultures, 11 coverslips) to MAc removal. These 17 WT and 30 AE3–/– neurons represent a subset of the 41 WT and 47 AE3–/– neurons described in Fig. 2 F (we used other neurons in other protocols). G, summary of pHi responses to MAc removal in HC astrocytes. The panel shows the mean responses of 10 WT astrocytes (grey squares; from 1 culture; 3 coverslips) and 31 AE3−/− astrocytes (pink circles; from 3 cultures; 3 coverslips) to MAc removal. These 10 WT and 31 AE3–/– astrocytes represent a subset of the 34 WT and 60 AE3–/– astrocytes described in Fig. 2 G. H, relationship between (dpHi/dt)final – computed as described in Methods – and (pHi)Ctrl for 17 WT individual neurons (black squares) and 30 individual AE3−/− neurons (red circles). The arrows identify the neurons in B. The inset shows mean (dpHi/dt)final values, computed over all (pHi)Ctrl values. I, relationship between (dpHi/dt)final and (pHi)Ctrl for 10 individual WT astrocytes (grey diamonds) and 31 individual AE3−/− astrocytes (pink triangles). The arrows identify the astrocytes in C. The inset is comparable to that in H. Supplementary Fig. S4 includes an alternative analysis, plots of the exponential rate constant k up vs. (pHi)Ctrl for WT neurons, WT astrocytes and AE3−/− astrocytes in this part of the study. J, relationship between the final pHi ((pHi)final) after the recovery from MAc (point d in B) and (pHi)Ctrl for 17 individual WT neurons (black squares) and 30 individual AE3−/− neurons (red circles). The inset shows mean (pHi)final values, computed over all (pHi)Ctrl values. K, relationship between the final pHi after the recovery from MAc (point d in panel C) and (pHi)Ctrl for 10 individual WT astrocytes (grey diamond) and 31 individual AE3−/− astrocytes (pink triangles). The inset is comparable to that in panel J. For the bar graphs in D and E and in the insets to H, I, J and K (i.e. bar graphs), we performed two‐tailed unpaired t tests between WT and AE3−/− cells. For the main portions of H, I, J, and K (i.e. scatter plots), we performed multivariate ANOVA between WT and AE3−/− cells.
Figure 4
Figure 4. Recovery of pHi from an acute acid load in hippocampal neurons and astrocytes in mixed culture
A, examples of pHi responses in two HC neurons; WT (blue) and AE3−/− (brown) under conditions of MAc. At the indicated times, we switched the extracellular solution from 5% CO2/14 mm HCO3 /pH 7.20 (solution 4 in Table 1) to 5% CO2/14 mm HCO3 /20 mm NH3/NH4 +/pH 7.20 (solution 5), and then back again (solution 4). The NH3/NH4 + washout produces an acid load, followed by a slower pHi recovery. The squares on the blue trace and the circles on the brown trace represent some of the points at which we calculated dpHi/dt from exponential curve fits. The inset shows plots of dpHi/dt vs. pHi for the WT and AE3−/− neurons in the main panel. Supplementary Fig. S5 includes plots of dpHi/dt and pHi for all neurons in this part of the study. The slopes of the lines (not shown) through each set of points represent the exponential rate constant k up, computed as described in Methods. B, examples of pHi responses in two HC astrocytes; WT (light blue) and AE3−/− (orange), to an acute acid load imposed via a NH3/NH4 + prepulse under MAc conditions. The right inset is comparable to that in panel A. Supplementary Fig. S6 includes plots of dpHi/dt and pHi for all astrocytes in this part of the study. C, relationship between k up and (pHi)Ctrl for 26 individual WT neurons (blue squares; from 3 cultures, 6 coverslips) and 25 individual AE3−/− neurons (brown circles; from 3 cultures, 5 coverslips) under MAc conditions. The arrows identify the neurons in panel A. The inset shows mean k up values, computed over all (pHi)Ctrl values. D, relationship between k up and (pHi)Ctrl for 10 individual WT astrocytes (light blue diamonds, from 3 cultures, 6 coverslips) and 9 individual AE3−/− astrocytes (orange triangles, from 3 cultures, 5 coverslips) under MAc conditions. The arrows identify the astrocytes in panel B. The inset is comparable to that in panel C. E, relationship between k up and (pHi)Ctrl for 17 individual WT neurons (black squares; from 2 cultures, 4 coverslips) and 14 individual AE3−/− neurons (red circles; from 2 cultures, 4 coverslips) under Ctrl conditions. Our protocol (not shown) was similar to that in panel A, except that we switched from extracellular solution 3 to solution 6, and then back to solution 3. The inset is comparable to that in panel C. Supplementary 7 includes plots of dpHi/dt and pHi for all neurons in this part of the study. F, relationship between k up and (pHi)Ctrl for 21 individual WT astrocytes (grey diamonds; from 2 cultures, 4 coverslips) and 17 individual AE3−/− astrocytes (pink triangles; from 2 cultures, 4 coverslips) under Ctrl conditions. The inset is comparable to that in panel C. Supplementary Fig. S8 includes plots of dpHi/dt and pHi for all astrocytes in this part of the study. For the insets in panels C, D, E and F (i.e. bar graphs), we performed two tailed unpaired t tests between WT and AE3−/− cells. For the main portions of panels C, D, E and F (i.e. scatter plots), we performed multivariate ANOVA between WT and AE3−/− cells.
Figure 5
Figure 5. Responses of pHi to Cl removal during NH3/NH4 + washout in WT hippocampal neurons and astrocytes in mixed culture
A, example of a pHi record from a HC neuron (representative of 11 neurons from 2 cultures on 4 coverslips). B, example of a pHi record from a HC astrocyte (representative of 9 astrocytes from the same 2 cultures and the same 4 coverslips as in the neuron experiments). In both cases, we switched from extracellular solution 4 to solution 5, and then to solution 7. The pHi records in A and B come from the same experiment (i.e. cells on the same coverslip). The lower portions of each panel show the time course of –k 440, computed as described in Methods; –k 440 values <4% min–1 correlate with good cell health.
Figure 6
Figure 6. Responses of pHi to MAc exposure in hippocampal astrocytes in astrocytes‐only cultures (AOCs)
A, examples of pHi responses in two HC astrocytes; WTAOC (dark green) and AE3AOC −/− (light green) to MAc. B, summary of pHi responses to MAc in AOC astrocytes. The panel shows the mean responses of 23 WTAOC astrocytes (dark green squares; from 2 cultures, 3 coverslips) and 20 AE3AOC −/− astrocytes (light green circles; from 2 cultures, 4 coverslips) to MAc. C, mean control pHi (point a in panel A) for 23 WTAOC astrocytes (dark green bar) and 20 AE3AOC −/− astrocytes (light green bar) before MAc exposure. D, relationship between (dpHi/dt)early and (pHi)Ctrl for 23 individual WTAOC astrocytes (green diamonds) and 20 individual AE3AOC −/− astrocytes (light green triangles) to MAc. The arrows identify the astrocytes in panel A. Supplementary Fig. S9 includes plots of k down vs. (pHi)Ctrl for all astrocytes in this part of the study. E, relationship between (dpHi/dt)late (segment bc in panel A) and (pHi)Ctrl for 23 individual WTAOC astrocytes and 20 individual AE3AOC −/− astrocytes. F, mean pHi (point c in panel A) for 23 WTAOC astrocytes (dark green) and 20 AE3AOC −/− astrocytes (light green) before MAc removal. G, relationship between (dpHi/dt)final and (pHi)Ctrl for 23 individual WTAOC astrocytes (green diamond) and 20 individual AE3AOC −/− astrocytes (light green triangles). Supplementary Fig. S10 includes plots of dpHi/dt vs. pHi for all astrocytes in this part of the study. H, relationship between (pHi)final and (pHi)Ctrl for 23 individual WTAOC astrocytes and 20 individual AE3AOC −/− astrocytes. The bar graphs in panels C and F, and the insets in panels D, E, G and H show comparisons of the means among astrocytes in mixed culture (Figs 2 and 3) and AOC, computed over all (pHi)Ctrl values. For the bar graphs in the main portions of panels C and F we performed two‐tailed unpaired t tests between WT and AE3−/− cells. For the six insets, we used ANOVA with Tukey's pairwise comparison. P overall is the P value from the ANOVA. For the main portions of panels D, E, G and H (i.e. scatter plots), we performed multivariate ANOVA between WT and AE3−/− cells. NS, not significant; *0.05 ≥ P; **0.001 ≥ P.
Figure 7
Figure 7. Responses of pHi to Cl removal during MAc in hippocampal neurons and astrocytes in mixed culture
A, examples of pHi time courses in a WT neuron and astrocyte on the same coverslip. At the indicated times, we switched from extracellular solution 3 to solution 4, and then to solution 7. B, examples of pHi time courses in an AE3–/– neuron and astrocyte on the same coverslip. C, mean responses of 16 WT (black squares; from 3 cultures, 4 coverslips) and 9 AE3−/− (red circles; from 3 cultures, 3 coverslips) neurons to Cl removal during MAc. These 16 WT and 9 AE3–/– neurons represent a subset of the 41 WT and 47 AE3–/– neurons described in Fig. 2 F. D, mean responses of 20 WT (grey squares; from 2 cultures, 4 coverslips) and 23 AE3−/− (pink circles; from 3 cultures, 3 coverslips) astrocytes to Cl removal during MAc. These 20 WT and 23 AE3–/– astrocytes represent a subset of the 34 WT and 60 AE3–/– neurons described in Fig. 2 F. The inset between panels C and D summarizes comparable data from 17 WT neurons and 12 WT astrocytes, but obtained under Ctrl (as opposed to MAc) conditions. E, mean pHi for WT (black bar) and AE3−/− neurons (red bar), just before Cl removal (point c in panel A), computed as described in Methods. E is analogous to Fig. 3 D. F, mean pHi for WT (grey bar) and AE3−/− astrocytes (pink bar), just before Cl removal (point c in panel A). F is analogous to Fig. 3 E. G, relationship between the most rapid rate of pHi change after Cl removal ((dpHi/dt)Cl removal) – computed as described in Methods – and (pHi)Ctrl for 16 individual WT neurons (black squares) and 9 individual AE3−/− neurons (red circles) under MAc conditions. The arrows identify the neurons in panel A. The inset shows mean (dpHi/dt)Cl removal values, computed over all (pHi)Ctrl values. H, relationship between (dpHi/dt)Cl removal and (pHi)Ctrl for 20 individual WT astrocytes (grey diamonds) and 23 individual AE3−/− astrocytes (pink triangles) under MAc conditions. The arrows identify the astrocytes in panel A. The inset is comparable to that in panel G. I, relationship between the change in pHi caused by Cl removal ((∆pHi)Cl removal) and (pHi)Ctrl for 16 individual WT neurons (black squares) and 9 individual AE3−/− neurons (red circles) under MAc conditions. We define (∆pHi)Cl removal as the difference between pHi values at points y and c in panel A – these pHi values were computed as described in Methods. The left inset is comparable to that in panel G, but for (∆pHi)Cl removal. The right inset shows pHi records from two neurons that have the same (dpHi/dt)Cl removal but different (∆pHi)Cl removal. J, relationship between (∆pHi)Cl removal and (pHi)Ctrl for 20 individual WT astrocytes (grey diamonds) and 23 individual AE3−/− astrocytes (pink triangles) under MAc conditions. The inset is comparable to the left inset in panel I. For the bar graphs in panels E and F and in the insets to panels G, H, I, and J (i.e. bar graphs), we performed two‐tailed unpaired t tests between WT and AE3−/− cells. For the main portions of panels G, H, I and J (i.e. scatter plots), we performed multivariate ANOVA between WT and AE3−/− cells.
Figure 8
Figure 8. Model of neuron–astrocyte crosstalk, based on acid–base‐related events
Schematic model of a hypothesis describing the role of AE3 in crosstalk between a neuron (left) and an astrocyte (right). The white numerals on black squares describe the postulated sequence of events.

Comment in

Similar articles

Cited by

References

    1. Aharonovitz O, Kapus A, Szászi K, Coady‐Osberg N, Jancelewicz T, Orlowski J & Grinstein S (2001). Modulation of Na+/H+ exchange activity by Cl− . Am J Physiol Cell Physiol 281, C133–C141. - PubMed
    1. Alper SL (2009). Molecular physiology and genetics of Na+‐independent SLC4 anion exchangers. J Exp Biol 212, 1672–1683. - PMC - PubMed
    1. Alper SL & Sharma AK (2013). The SLC26 gene family of anion transporters and channels. Mol Aspects Med 34, 494–515. - PMC - PubMed
    1. Arroyo JP, Kahle KT & Gamba G (2013). The SLC12 family of electroneutral cation‐coupled chloride cotransporters. Mol Aspects Med 34, 288–298. - PubMed
    1. Bergeron MJ, Gagnon E, Wallendorff B, Lapointe J‐Y & Isenring P (2003). Ammonium transport and pH regulation by K‐Cl cotransporters. Am J Physiol Renal Physiol 285, F68–F78. - PubMed

Publication types

LinkOut - more resources