. 2016 Jul 21;61(14):5275-96.
doi: 10.1088/0031-9155/61/14/5275. Epub 2016 Jun 29.

Development of a spherically focused phased array transducer for ultrasonic image-guided hyperthermia

Affiliations

Development of a spherically focused phased array transducer for ultrasonic image-guided hyperthermia

Jingfei Liu et al. Phys Med Biol. .

Abstract

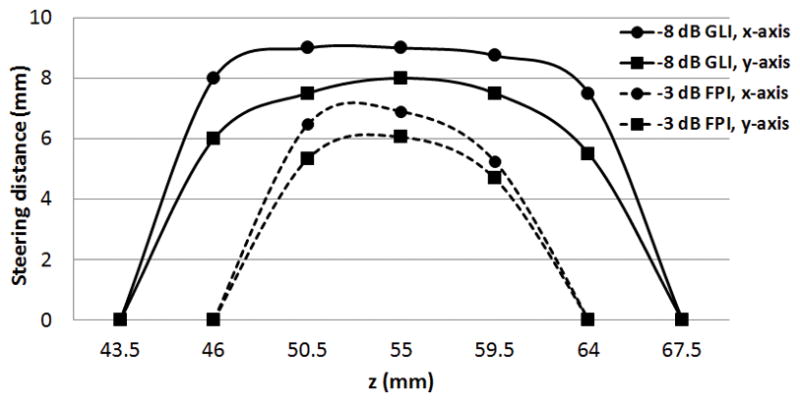
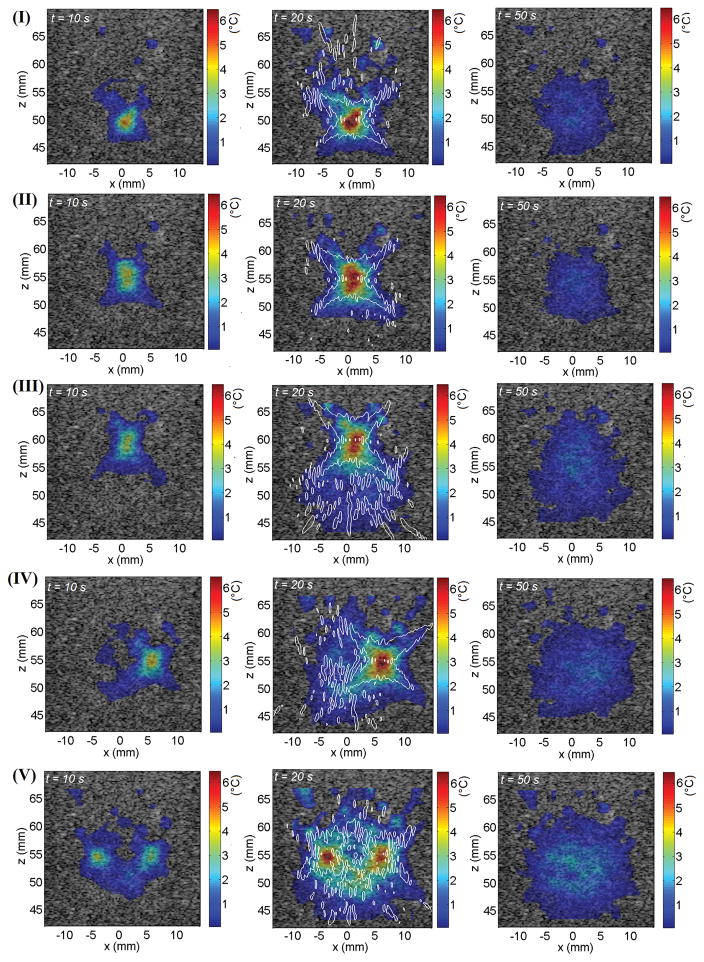
A 1.5 MHz prolate spheroidal therapeutic array with 128 circular elements was designed to accommodate standard imaging arrays for ultrasonic image-guided hyperthermia. The implementation of this dual-array system integrates real-time therapeutic and imaging functions with a single ultrasound system (Vantage 256, Verasonics). To facilitate applications involving small animal imaging and therapy the array was designed to have a beam depth of field smaller than 3.5 mm and to electronically steer over distances greater than 1 cm in both the axial and lateral directions. In order to achieve the required f number of 0.69, 1-3 piezocomposite modules were mated within the transducer housing. The performance of the prototype array was experimentally evaluated with excellent agreement with numerical simulation. A focal volume (2.70 mm (axial) × 0.65 mm (transverse) × 0.35 mm (transverse)) defined by the -6 dB focal intensity was obtained to address the dimensions needed for small animal therapy. An electronic beam steering range defined by the -3 dB focal peak intensity (17 mm (axial) × 14 mm (transverse) × 12 mm (transverse)) and -8 dB lateral grating lobes (24 mm (axial) × 18 mm (transverse) × 16 mm (transverse)) was achieved. The combined testing of imaging and therapeutic functions confirmed well-controlled local heating generation and imaging in a tissue mimicking phantom. This dual-array implementation offers a practical means to achieve hyperthermia and ablation in small animal models and can be incorporated within protocols for ultrasound-mediated drug delivery.


Figures

Figure 1
Figure 1
(a) 3D and (b) 2D (top view) schematics of the spherical therapeutic array with 128 randomly distributed circular elements and a rectangular opening for inserting the imaging transducer. (c) Symmetric sections of the array. (d) Rear aspect before element patterning. (e) Top view of the integrated array system for ultrasound imaging and therapy: (A) The imaging array ATL L7-4; (B) the therapeutic array with elements underneath the black matching layer; (C) housing of the therapeutic array; and (D) plastic support.
Figure 2
Figure 2
(a) The focal positions for generating and measuring temperature elevation in five experiments: Experiment I to IV in single-focus mode (ellipse) and experiment V in double-focus mode (pentagram). (b) The temporal control of the therapeutic array excitation and time points (star) for temperature map recording.
Figure 3
Figure 3
Comparison of simulations (left-hand column) with lab measurements (middle column) of the one way acoustic intensity field at the geometric focus (0, 0, 55) mm in three orthogonal planes: the x–y plane (a, b), the x–z plane (d, e), and the y-z plane (g, h). The simulated and measured intensity profiles along the x, y and z axes were extracted from the corresponding intensity maps and compared in (c), (f) and (i), respectively.
Figure 4
Figure 4
Comparison of simulations (left-hand column) with lab measurements (middle column) of the one way acoustic intensity field at (5, 0, 55) mm in three orthogonal planes: the x–y plane (a, b), the x–z plane (d, e), and the y-z plane (g, h). The simulated and measured intensity profiles along the x, y and z axes were extracted from the corresponding intensity maps and compared in (c), (f) and (i), respectively.
Figure 5
Figure 5
Comparison of simulations (left-hand column) with lab measurements (middle column) of the one way acoustic intensity field at (0, 0, 60) mm in three orthogonal planes: the x–y plane (a, b), the x–z plane (d, e), and the y-z plane (g, h). The simulated and measured intensity profiles along the x, y and z axes were extracted from the corresponding intensity maps and compared in (c), (f) and (i), respectively.
Figure 6
Figure 6
Comparison of simulations with lab measurements of the −6 dB and −3 dB focal intensity contours at nine positions (a) in the x–y plane for z = 55 mm, (b) in the x–z plane for y = 0 mm, and (c) in the y-z plane for x = 0 mm.
Figure 7
Figure 7
Experimentally measured focal dimensions at nine focal positions as the array was steered along the (a) x, (b) y and (c) z axes.
Figure 8
Figure 8
Comparison of simulation with lab measurement of the focal peak intensity along (a) the axis (x, 0, 53.5) mm, (b) the axis (0, y, 53.5) mm, and (c) the z axis.
Figure 9
Figure 9
Projections of the simulated −3 dB beam steering volume in the (a) x–y plane, (b) x–z plane and (c) y-z plane are defined by all focal positions whose focal peak intensity (FPI) are greater than −3 dB of the maximum FPI of the array.
Figure 10
Figure 10
The intensity field boundaries defined by −8 dB grating lobe level (GLL) along the x, y and z axes compared with the boundaries defined by −3dB focal peak intensity (FPI).
Figure 11
Figure 11
Measurements of the output acoustic power of the array as a function of the applied electrical power.
Figure 12
Figure 12
Generation and measurement of temperature elevation at different positions in the tissue-mimicking phantom. Row (I) to (V) correspond to the tests at (0, 0, 55) mm, (0, 0, 50) mm, (0, 0, 60) mm, (5, 0, 50) mm, and (±5, 0, 55) mm, respectively. Column (A) illustrates the positions of electronically steered focus (ellipse) with reference to the geometric focus of the therapeutic array (dot). Column (B), (C) and (D) show the temperature maps recorded at 10 s, 20 s and 50 s, respectively. Only the temperature change higher than 1 °C is displayed. The −20 dB simulated intensity contour is overlapped with temperature map obtained at 20 s.
Figure 13
Figure 13
Temporal evolution of the total area of the temperature map with the temperature elevation larger than 1 °C for five measurements.
Figure 14
Figure 14
Comparison of the performance of the designed array (128EHYP) with two commercial transducers (Commercial 1 and 2): −6 dB and −3 dB focal intensity region (a) in the x–y plane and (b) in the x–z plane; intensity profiles along (c) the x axis and (d) the z axis.

References

    1. Archerhall JA, Bashter AI, Hazelwood AJ. Means for computing the Kirchhoff surface integral for a disk radiator as a single intergral wit fixed limits. J Acous Soc Am. 1979;65:1568–70.
    1. Azuma T, Ogihara M, Kubota J, Sasaki A, Umemura S, Furuhata H. Dual-frequency ultrasound imaging and therapeutic bilaminar array using frequency selective isolation layer. IEEE Trans Ultrason Ferroelectr Freq Control. 2010;57:1211–24. - PubMed
    1. Ballard JR, Casper AJ, Wan YY, Ebbini ES. Adaptive transthoracic refocusing of dual-mode ultrasound arrays. IEEE Trans Biomed Eng. 2010;57:93–102. - PMC - PubMed
    1. Bin G, Jian L. Waveform diversity based ultrasound system for hyperthermia treatment of breast cancer. IEEE Trans Biomed Eng. 2008;55:822–6. - PubMed
    1. Bing CC, Nofiele J, Staruch R, Ladouceur-Wodzak M, Chatzinoff Y, Ranjan A, Chopra R. Localised hyperthermia in rodent models using an MRI-compatible high-intensity focused ultrasound system. Int J Hyperthermia. 2015;31:813–22. - PMC - PubMed

LinkOut - more resources