. 2016 Jun 29:7:11764.
doi: 10.1038/ncomms11764.

The genetic regulatory signature of type 2 diabetes in human skeletal muscle

Affiliations

The genetic regulatory signature of type 2 diabetes in human skeletal muscle

Laura J Scott et al. Nat Commun. .

Abstract

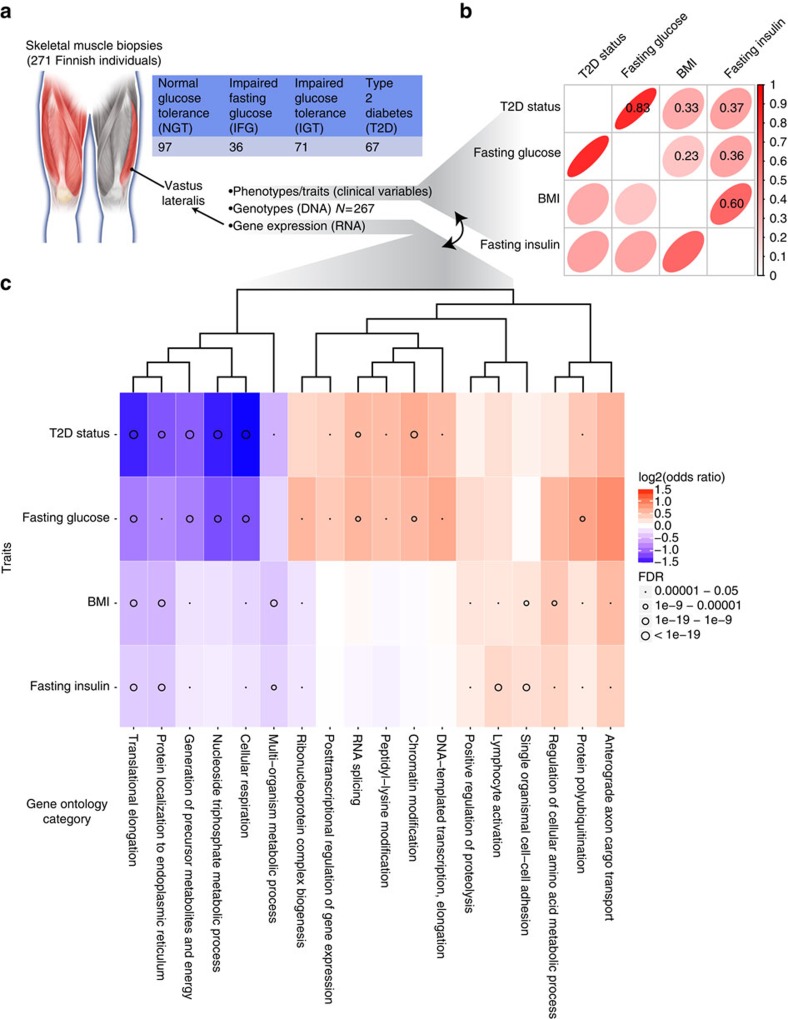
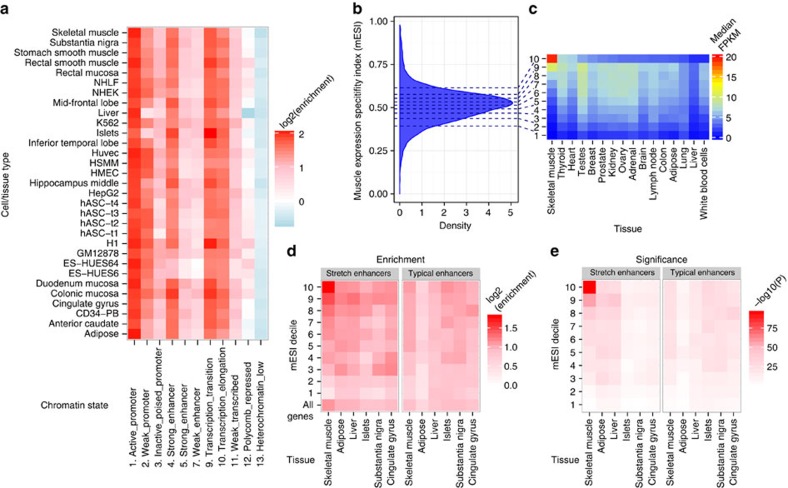
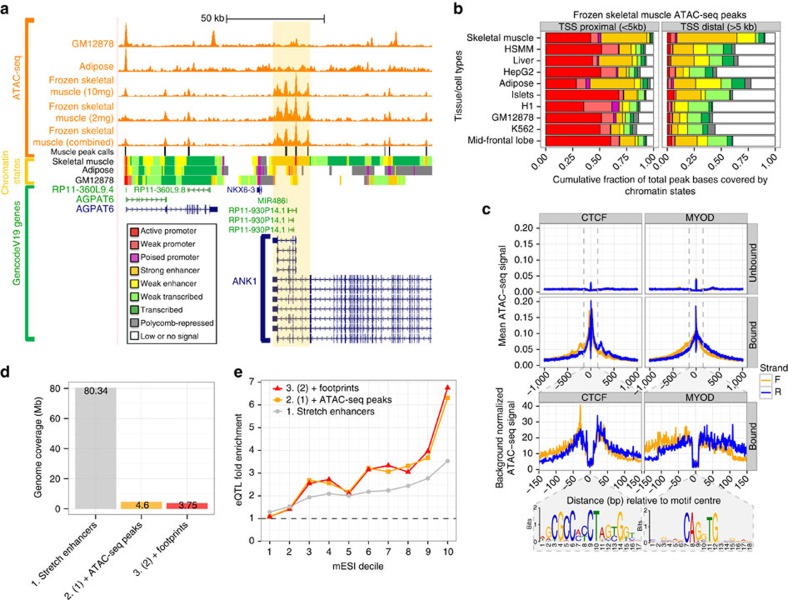
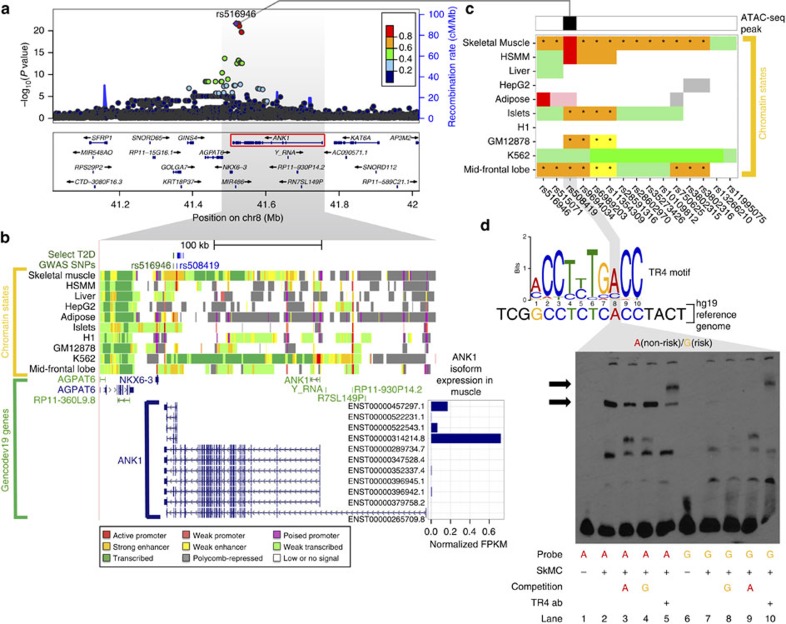
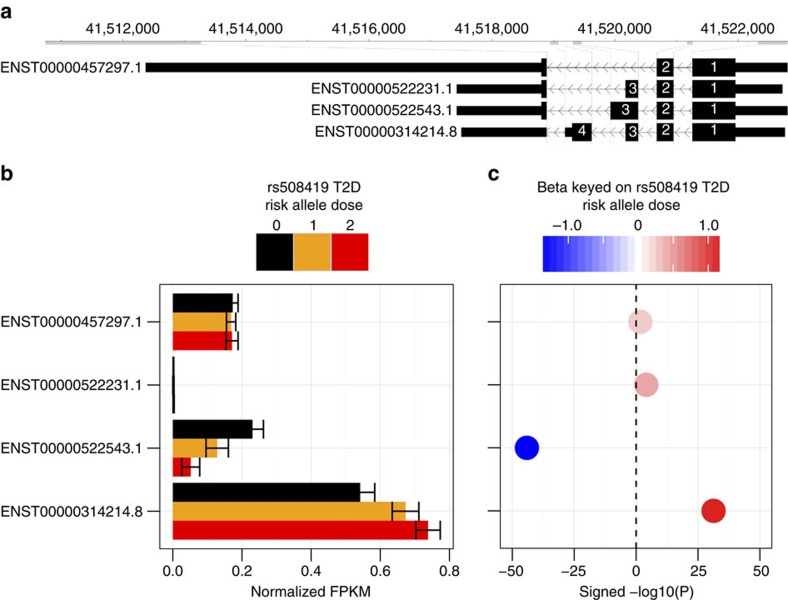
Type 2 diabetes (T2D) results from the combined effects of genetic and environmental factors on multiple tissues over time. Of the >100 variants associated with T2D and related traits in genome-wide association studies (GWAS), >90% occur in non-coding regions, suggesting a strong regulatory component to T2D risk. Here to understand how T2D status, metabolic traits and genetic variation influence gene expression, we analyse skeletal muscle biopsies from 271 well-phenotyped Finnish participants with glucose tolerance ranging from normal to newly diagnosed T2D. We perform high-depth strand-specific mRNA-sequencing and dense genotyping. Computational integration of these data with epigenome data, including ATAC-seq on skeletal muscle, and transcriptome data across diverse tissues reveals that the tissue-specific genetic regulatory architecture of skeletal muscle is highly enriched in muscle stretch/super enhancers, including some that overlap T2D GWAS variants. In one such example, T2D risk alleles residing in a muscle stretch/super enhancer are linked to increased expression and alternative splicing of muscle-specific isoforms of ANK1.


Figures

Figure 1
Figure 1. Molecular profiling maps of skeletal muscle combined with dense phenotyping reveals insights about T2D.
(a) To understand the full spectrum of genetic variation and regulatory element usage in T2D-relevant tissue and across disease progression, we obtained skeletal muscle biopsies from the vastus lateralis of 271 well-phenotyped Finnish individuals with normal and impaired glucose tolerance, impaired fasting glucose or newly diagnosed, untreated T2D. (b) Correlogram of Spearman rank correlation coefficients for key metabolic traits. (c) Heatmap of GO terms for differentially expressed genes. For each trait, the 20 GO terms most significantly enriched for positive expression–trait association and the 20 GO terms most significantly enriched for negative expression–trait association were selected. GO terms were pruned to eliminate redundant terms. The terms were hierarchically clustered using the GO term enrichment beta. Darker red, stronger positive gene expression–trait association; darker blue, stronger negative association. Circle size represents number of significant GO terms.
Figure 2
Figure 2. The genetic regulatory architecture of muscle-specific gene expression.
(a) Muscle cis-eQTL enrichment across chromatin states in diverse cell or tissue types. (b) Genes that are both highly expressed in skeletal muscle and highly tissue-specific fall into muscle expression specificity index (mESI) decile 10; genes which are lowly and ubiquitously expressed fall in decile 1. (c) As mESI decile increases, genes have greater expression in skeletal muscle but not in other tissue types. (d,e) cis-eQTL genes stratified by mESI decile. cis-eQTLs which fall into muscle stretch enhancers (⩾3 kb) are significantly enriched for genes expressed highly and specifically in muscle versus cis-eQTLs in typical enhancers (≤800 bp).
Figure 3
Figure 3. ATAC-seq maps in frozen skeletal muscle.
(a) ATAC-seq profiles in skeletal muscle replicates and combined compared with similar profiles in adipose and the lymphoblastoid cell line GM12878 (ref. 20), and to reference chromatin state maps in diverse cell or tissue types. (b) Skeletal muscle combined replicate ATAC-seq peak calls show enrichment for skeletal muscle-active chromatin states, which is pronounced at TSS-distal regions. (c) Example ATAC-seq footprint aggregate plots at CTCF and MYOD sites. (d) Relative genome coverage by different classes of skeletal muscle regulatory elements. (e) Skeletal muscle cis-eQTL enrichments at different mESI bins relative to the regulatory elements described in d.
Figure 4
Figure 4. T2D GWAS SNPs in a muscle-specific stretch enhancer of ANK1 provide mechanistic insights into T2D pathophysiology in skeletal muscle.
(a) Regional association plot showing the significance of SNPs (points) associated with expression of ANK1 (highlighted with red rectangle), where the best cis-eQTL rs516946 (purple point) is a T2D GWAS SNP. (b) UCSC genome browser view of chromatin states near ANK1 isoforms. The chromatin states between skeletal muscle and other T2D relevant cell types (adipose, liver, islets) are markedly different. ANK1 is associated with hereditary spherocytosis, a disease of the red blood cells, which is consistent with the transcribed chromatin states in K562, a myelogeneous leukaemia line of the erythroleukemia type. T2D and related trait GWAS SNPs (dark green) and SNPs in strong LD (r2⩾0.8; blue) are found within muscle-specific stretch enhancers. ANK1 expression is shown for each isoform and normalized so that the sum over all isoforms is 1. (c) The chromatin states across T2D relevant tissues or cells for SNPs in strong LD (r2⩾0.8) with T2D GWAS SNP rs516946. Location of the ATAC-seq peak is noted. Asterisks denote SNPs that reside in stretch (⩾3 kb) enhancers. Colour-coding of chromatin is as shown in b. (d) EMSA using human skeletal muscle cell (SkMC) nuclear extract demonstrates allele-specific binding (see lower horizontal arrow on the left side of the gel) for the non-risk allele (A) of rs508419. A supershift (see upper horizontal arrow on the left side of the gel) using the TR4 antibody shows that TR4 participates in the allele-specific binding.
Figure 5
Figure 5. Truncated ANK1 isoforms are expressed in muscle and have differential splicing associated with rs508419 genotype.
(a) The four short isoforms of ANK1. (b) The mean expression of each isoform normalized by the total ANK1 expression is stratified by genotype; error bars represent ±1 s.d. N=8/82/174 for risk allele dosages 0/1/2. (c) The direction of effect (β) for splicing associated with the rs508419 risk allele (y-axis labels are the same as in b).

References

    1. Scully T. Diabetes in numbers. Nature 485, S2–S3 (2012). - PubMed
    1. Kahn S. E., Cooper M. E. & Del Prato S. Pathophysiology and treatment of type 2 diabetes: perspectives on the past, present, and future. Lancet 383, 1068–1083 (2014). - PMC - PubMed
    1. Keildson S. et al. Expression of phosphofructokinase in skeletal muscle is influenced by genetic variation and associated with insulin sensitivity. Diabetes 63, 1154–1165 (2014). - PMC - PubMed
    1. Lindholm M. E. et al. The human skeletal muscle transcriptome: sex differences, alternative splicing, and tissue homogeneity assessed with RNA sequencing. FASEB J. 28, 4571–4581 (2014). - PubMed
    1. GTEx Consortium. Human genomics. The genotype-tissue expression (GTEx) pilot analysis: multitissue gene regulation in humans. Science 348, 648–660 (2015). - PMC - PubMed

Publication types