. 2016 Jun 29:6:29142.
doi: 10.1038/srep29142.

Zonulin Regulates Intestinal Permeability and Facilitates Enteric Bacteria Permeation in Coronary Artery Disease

Affiliations

Zonulin Regulates Intestinal Permeability and Facilitates Enteric Bacteria Permeation in Coronary Artery Disease

Chuanwei Li et al. Sci Rep. .

Abstract

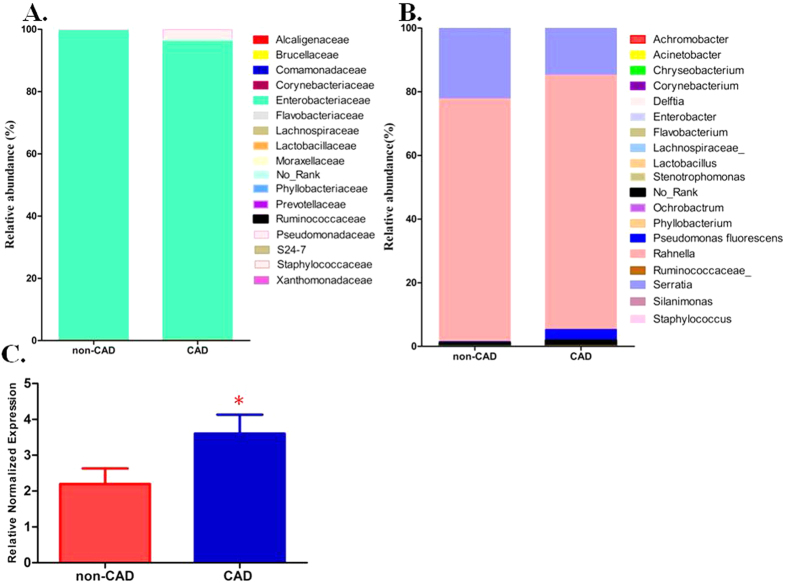
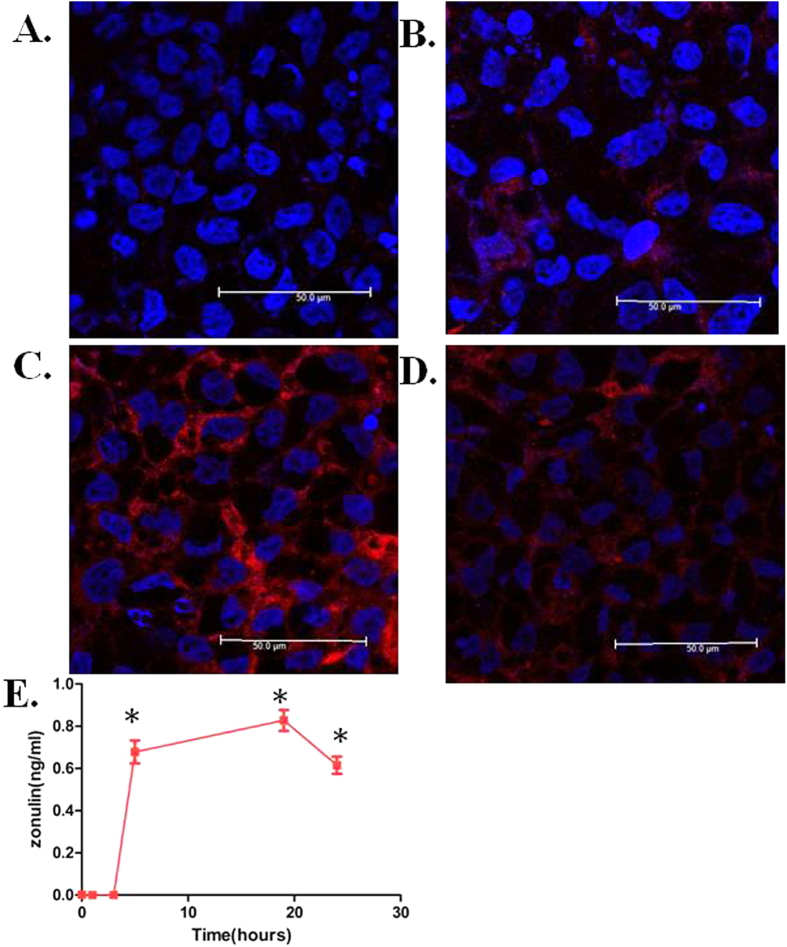
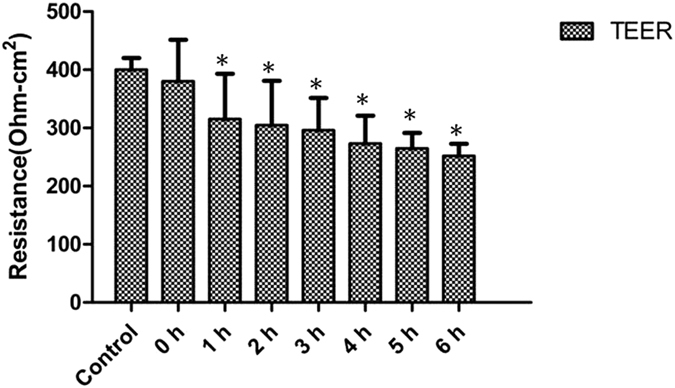
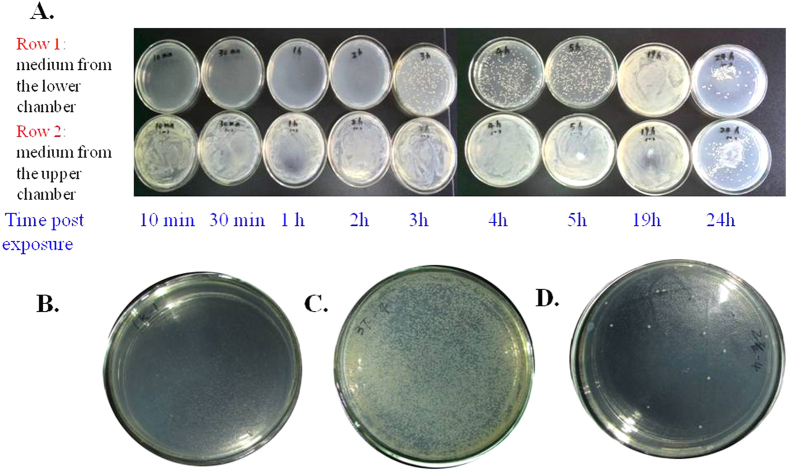
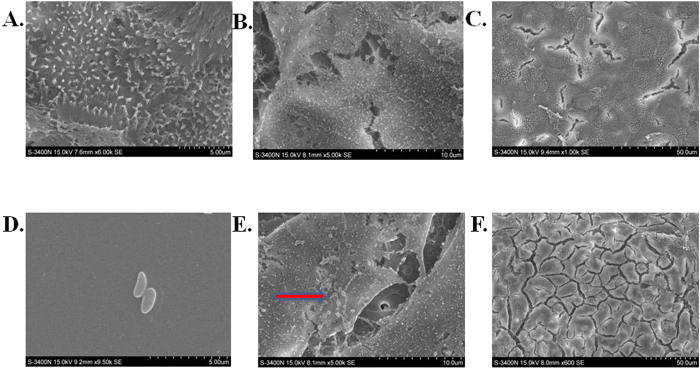
Several studies have reported an association between enteric bacteria and atherosclerosis. Bacterial 16S ribosomal RNA (rRNA) gene belong to Enterobacteriaceae have been detected in atherosclerotic plaques. How intestinal bacteria go into blood is not known. Zonulin reversibly modulate intestinal permeability (IP), the circulating zonulin levels were increased in diabetes, obesity, all of which are risk factors for atherosclerosis. It is unclear whether the circulating zonulin levels were changed in coronary artery disease (CAD) patients and modulate IP. The 16S rRNA gene of bacteria in blood sample was checked by 454 pyrosequencing. The zonulin levels were determined by enzyme-linked immunosorbent assay (ELISA) methods. The distribution of zonulin was detected by confocal immunofluorescence microscopy. Bacteria and Caco-2 cell surface micro-structure were checked by transmission electron microscopy. A high diversity of bacterial 16S rRNA gene can be detected in samples from CAD patients, most of them (99.4%) belong to Enterobacteriaceaes, eg. Rahnella. The plasma zonulin levels were significantly higher in CAD patients. Pseudomonas fluorescens exposure significantly increased zonulin expression and decreased IP in a time dependent manner. The elevated zonulin increase IP and may facilitate enteric translocation by disassembling the tight junctions, which might explain the observed high diversity of bacterial 16S rRNA genes in blood samples.


Figures

Figure 1
Figure 1. Bacterial taxa identified in blood DNA samples from CAD and non-CAD patients.
(A,B) Relative abundance of taxonomic summary of the blood microbiota of CAD patients and non-CAD controls as determined by 16S rRNA gene pyrosequencing at family level (A) and genus level (B). (C) Quantification of the Pseudomonas 16S rRNA gene expression in bacteria positive samples from CAD patients (n = 53) and non-CAD patients (n = 31). The Pseudomonas 16s rRNA gene levels were normalized by the expression of bacterial 16s rRNA gene using the general primers targeting bacterial V1-V3 region. The data are expressed as mean ± SD. *P < 0.05 vs. non-CAD patients.
Figure 2
Figure 2. Effects of Pseudomonas fluorescens on zonulin expression in Caco-2 cells.
(A) Human Caco-2 cell monolayer was exposed to Pseudomonas fluorescens and fixed with paraformaldehyde. Zonulin expression was determined by immunostaining with anti-zonulin antibodies (red), nucleus was stained by DAPI (blue). At 0 hour, the uninfected Caco-2 monolayer showed less zonulin staining in the cell cytoplasma. (B) One hour after Pseudomonas fluorescens exposure, zonulin staining can be visualized in the cytoplasma. (C) After 5 hrs of Pseudomonas fluorescens exposure, the area with zonulin staining full filled the entire cell cytoplasm indicate significant increase in zonulin expression. (D) Zonulin staining in cell cytoplasm gradually decreased 24 hrs after Pseudomonas fluorescens exposure. (E) Secreted form of zonulin released from Caco2 monolayers exposed to Pseudomonas fluoresce. The zonulin levels 0–5 hrs post-incubation in the cell culture supernatants were lower than the detection limit. Pseudomonas fluorescens induced significant zonulin release 5 hrs post-incubation and gradually increase at 19 hrs after bacterial exposure. The zonulin level decreased after 24 hrs of Pseudomonas fluoresce exposure. Data are expressed as mean ± SD (n = 3, *P < 0.05 versus 0 hour).
Figure 3
Figure 3. Pseudomonas fluorescens increased Caco-2 cell monolayer IP in a time-dependent manner.
Caco-2 cell monolayers were cultured in transwells. A equal volume of Pseudomonas fluorescens suspension or PBS (control) were added to the upper chamber of transwell assay. TEER was monitored using a dual planar electrode for 6 hrs. The TEER decreases started from 1 hour post incubation compared to control monolayer and gradually decrease in a time- dependent manner. Data are expressed as mean ± standard error (n = 3, *P < 0.05 versus control group).
Figure 4
Figure 4. Bacteria culture of medium from lower chamber of Caco-2 cell transwell assay.
(A,B) In the Caco-2 transwell assay, after adding the Pseudomonas fluorescens suspension (A) or PBS (B) to the upper chamber of transwell assay for 6 hrs, the medium in the lower culture chamber was taken, and cultured in a separate HE agar plate for another 24 hrs. The bacterial colonies in the plate was yellow and recorded by photography, the representative image is shown. (C) The medium in the upper chamber was removed from the transwell, the Caco-2 cell monolayer was trypsinized and washed twice with sterile PBS. The re-suspended cells were then plated onto HE agar plate and cultured for 24 hrs. The bacterial colonies in the plate was recorded by photography. (D) The medium in the lower chamber of the transwell units was collected at increasing time intervals (10 min, 30 min, 1 h, 2 h, 3 h, 4 h, 5 h, 19 h, 24 h) after adding Pseudomonas fluorescens to the upper chamber. The medium in the upper chamber of the transwell was collected at the corresponding time and then plated onto HE agar plate and cultured for 24 hrs (row 1: medium from the lower chamber, row 2: medium from the upper chamber).
Figure 5
Figure 5. Pseudomonas fluorescens exposure induced morphological changes in Caco-2 cell monolayer.
(AC) The Caco-2 cell monolayer before Pseudomonas fluorescens exposure. The morphology was examined by transmission electron microscopy (TEM). The microvilli were tightly aligned (bar marker, 5 μm) with typical intense inter-cellular junctions ((B) bar marker, 20 μm; (C) bar marker, 50 μm). (D) The typical morphology of Pseudomonas fluorescens was coccus-shaped (bar marker, 5 μm). (E) Coccus-shaped Pseudomonas fluorescens adhering to the Caco-2 cell surface (Arrow bars) (bar marker, 20 μm). (F) Pseudomonas fluorescens exposure disrupted intercellular tight junctions, including extensive disorganization, augmentation, condensation, and beading of its normal intercellular structure. (bar marker, 50 μm).

Similar articles

Cited by

References

    1. Mozaffarian D. et al. Heart disease and stroke statistics–2015 update: a report from the American Heart Association. Circulation. 131, e29–322 (2015). - PubMed
    1. Hansson G. K. Inflammation, Atherosclerosis, and Coronary Artery Disease. N Engl J Med. 352, 1685–95 (2005). - PubMed
    1. Chen S. et al. IL-17A is proatherogenic in high-fat diet-induced and Chlamydia pneumoniae infection-acceleratedatherosclerosis in mice. J Immunol. 185, 5619–27 (2010). - PMC - PubMed
    1. Kalayoglu M. V1., Libby P. & Byrne G. I. Chlamydia pneumoniae as an emerging risk factor in cardiovascular disease. JAMA. 288, 2724–31 (2002). - PubMed
    1. Koren O. et al. Human oral, gut, and plaque microbiota in patients with atherosclerosis. Proc Natl Acad Sci USA 108, Suppl 1, 4592–8 (2011). - PMC - PubMed

Publication types

MeSH terms