

Postnatal Development of Right Ventricular Myofibrillar Biomechanics in Relation to the Sarcomeric Protein Phenotype in Pediatric Patients with Conotruncal Heart Defects
- PMID: 27353610
- PMCID: PMC4937289
- DOI: 10.1161/JAHA.116.003699
Postnatal Development of Right Ventricular Myofibrillar Biomechanics in Relation to the Sarcomeric Protein Phenotype in Pediatric Patients with Conotruncal Heart Defects
Abstract
Background: The postnatal development of myofibrillar mechanics, a major determinant of heart function, is unknown in pediatric patients with tetralogy of Fallot and related structural heart defects. We therefore determined the mechanical properties of myofibrils isolated from right ventricular tissue samples from such patients in relation to the developmental changes of the isoforms expression pattern of key sarcomere proteins involved in the contractile process.
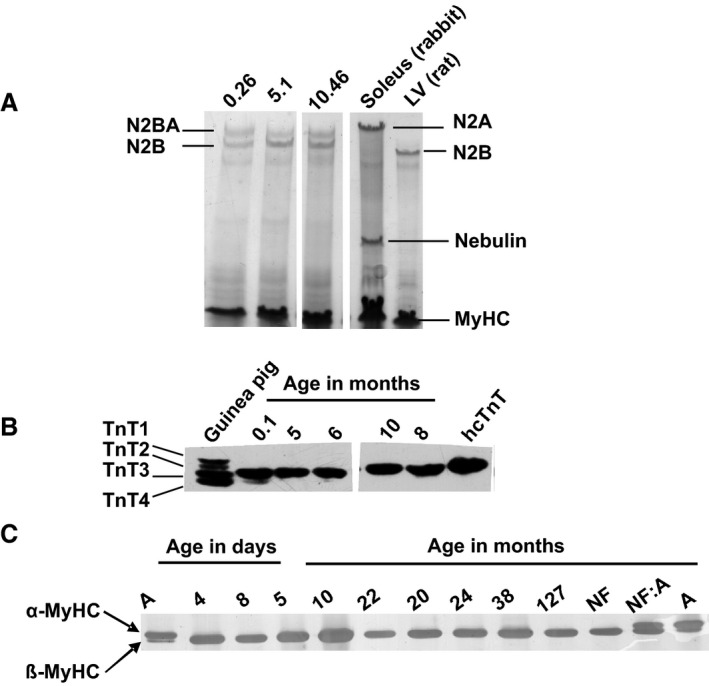
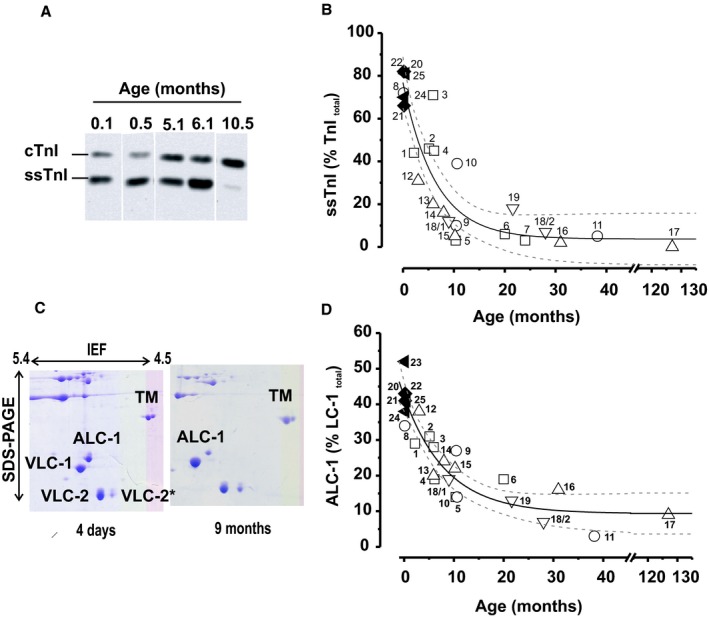
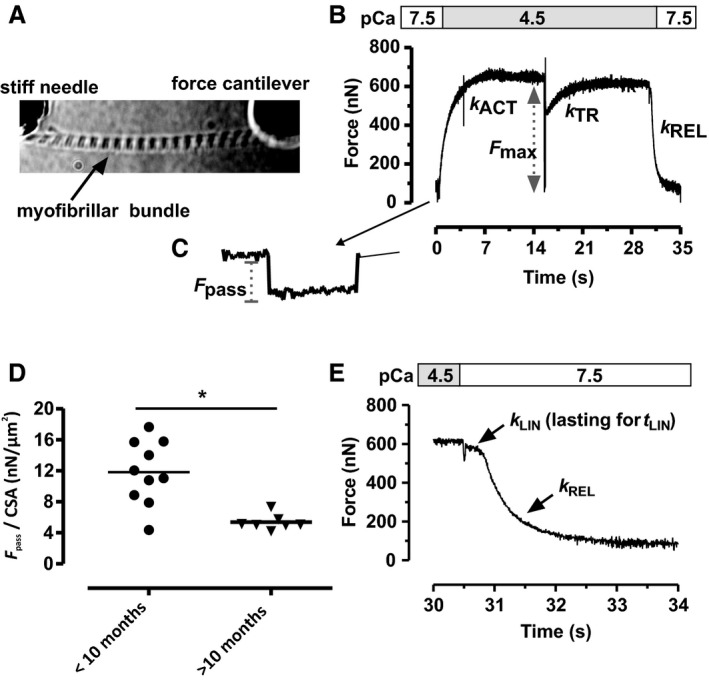
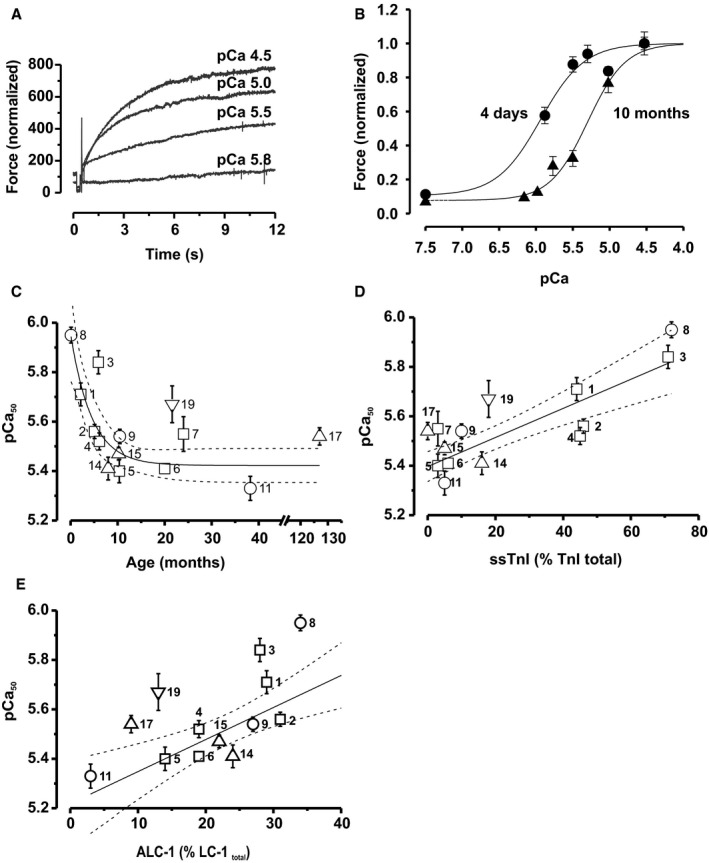
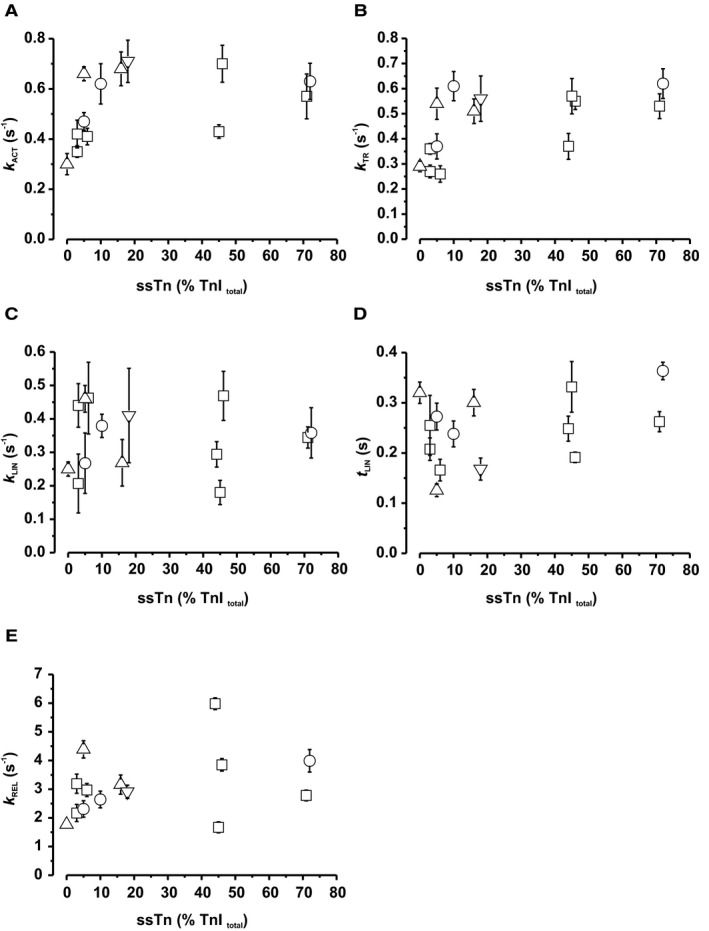
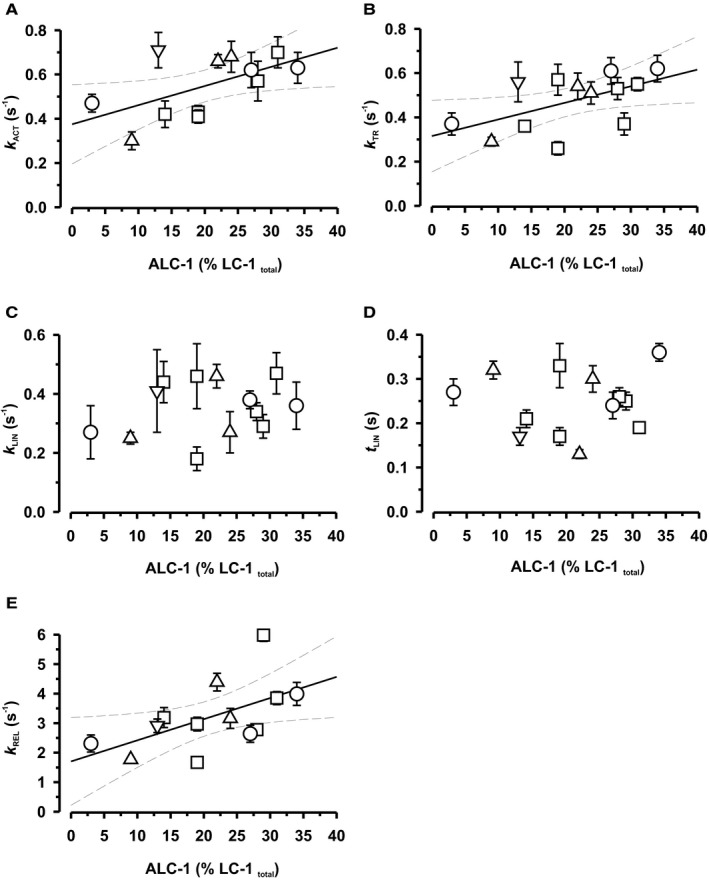
Methods and results: Tissue samples from the infundibulum obtained during surgery from 25 patients (age range 15 days to 11 years, median 7 months) were split into half for mechanical investigations and expression analysis of titin, myosin heavy and light chain 1, troponin-T, and troponin-I. Of these proteins, fetal isoforms of only myosin light chain 1 (ALC-1) and troponin-I (ssTnI) were highly expressed in neonates, amounting to, respectively, 40% and 80%, while the other proteins had switched to the adult isoforms before or around birth. ALC-1 and ssTnI expression subsequently declined monoexponentially with a halftime of 4.3 and 5.8 months, respectively. Coincident with the expression of ssTnI, Ca(2+) sensitivity of contraction was high in neonates and subsequently declined in parallel with the decline in ssTnI expression. Passive tension positively correlated with Ca(2+) sensitivity but not with titin expression. Contraction kinetics, maximal Ca(2+)-activated force, and the fast phase of the biphasic relaxation positively correlated with the expression of ALC-1.
Conclusions: The developmental changes in myofibrillar biomechanics can be ascribed to fetal-to-adult isoform transition of key sarcomeric proteins, which evolves regardless of the specific congenital cardiac malformations in our pediatric patients.
Keywords: cardiac myofibrils; contractile function; contractile proteins; force kinetics; heart development; human myocardium; sarcomere physiology; tetralogy of Fallot.
© 2016 The Authors. Published on behalf of the American Heart Association, Inc., by Wiley Blackwell.
Figures
Similar articles
-
Developmental changes in contractility and sarcomeric proteins from the early embryonic to the adult stage in the mouse heart.J Physiol. 2003 Apr 15;548(Pt 2):493-505. doi: 10.1113/jphysiol.2002.036509. Epub 2003 Mar 14. J Physiol. 2003. PMID: 12640016 Free PMC article.
-
Prolonged controlled mechanical ventilation in humans triggers myofibrillar contractile dysfunction and myofilament protein loss in the diaphragm.Thorax. 2016 May;71(5):436-45. doi: 10.1136/thoraxjnl-2015-207559. Epub 2016 Mar 31. Thorax. 2016. PMID: 27033022
-
Developmental changes in passive stiffness and myofilament Ca2+ sensitivity due to titin and troponin-I isoform switching are not critically triggered by birth.Am J Physiol Heart Circ Physiol. 2006 Aug;291(2):H496-506. doi: 10.1152/ajpheart.00114.2006. Epub 2006 May 5. Am J Physiol Heart Circ Physiol. 2006. PMID: 16679402
-
Modulation of contractility in human cardiac hypertrophy by myosin essential light chain isoforms.Cardiovasc Res. 1998 Feb;37(2):381-404. doi: 10.1016/s0008-6363(97)00258-7. Cardiovasc Res. 1998. PMID: 9614495 Review.
-
Cardiac Sarcomere Signaling in Health and Disease.Int J Mol Sci. 2022 Dec 19;23(24):16223. doi: 10.3390/ijms232416223. Int J Mol Sci. 2022. PMID: 36555864 Free PMC article. Review.
Cited by
-
Infantile restrictive cardiomyopathy: cTnI-R170G/W impair the interplay of sarcomeric proteins and the integrity of thin filaments.PLoS One. 2020 Mar 17;15(3):e0229227. doi: 10.1371/journal.pone.0229227. eCollection 2020. PLoS One. 2020. PMID: 32182250 Free PMC article.
-
Increased myocyte calcium sensitivity in end-stage pediatric dilated cardiomyopathy.Am J Physiol Heart Circ Physiol. 2019 Dec 1;317(6):H1221-H1230. doi: 10.1152/ajpheart.00409.2019. Epub 2019 Oct 18. Am J Physiol Heart Circ Physiol. 2019. PMID: 31625780 Free PMC article.
-
Differences in Contractile Function of Myofibrils within Human Embryonic Stem Cell-Derived Cardiomyocytes vs. Adult Ventricular Myofibrils Are Related to Distinct Sarcomeric Protein Isoforms.Front Physiol. 2018 Jan 19;8:1111. doi: 10.3389/fphys.2017.01111. eCollection 2017. Front Physiol. 2018. PMID: 29403388 Free PMC article.
-
The clinical value of α-hydroxybutyrate dehydrogenase, cardiac troponin I, and B-type natriuretic peptide in perioperative diagnosis of heart failure in children with congenital heart disease.Front Pediatr. 2025 Feb 20;13:1502439. doi: 10.3389/fped.2025.1502439. eCollection 2025. Front Pediatr. 2025. PMID: 40051908 Free PMC article.
-
De Novo Missense Mutations in TNNC1 and TNNI3 Causing Severe Infantile Cardiomyopathy Affect Myofilament Structure and Function and Are Modulated by Troponin Targeting Agents.Int J Mol Sci. 2021 Sep 6;22(17):9625. doi: 10.3390/ijms22179625. Int J Mol Sci. 2021. PMID: 34502534 Free PMC article.
References
-
- Anderson PA, Glick KL, Manring A, Crenshaw C Jr. Developmental changes in cardiac contractility in fetal and postnatal sheep: in vitro and in vivo. Am J Physiol. 1984;247:H371–H379. - PubMed
-
- Towbin JA, Belmont J. Molecular determinants of left and right outflow tract obstruction. Am J Med Genet. 2000;97:297–303. - PubMed
-
- Hinken AC, Solaro RJ. A dominant role of cardiac molecular motors in the intrinsic regulation of ventricular ejection and relaxation. Physiology (Bethesda). 2007;22:73–80. - PubMed
Publication types
MeSH terms
Substances
LinkOut - more resources
Full Text Sources
Other Literature Sources
Medical
Miscellaneous
