. 2016 Jun 28;7(3):e00682-16.
doi: 10.1128/mBio.00682-16.

Overexpression of Plasmodium berghei ATG8 by Liver Forms Leads to Cumulative Defects in Organelle Dynamics and to Generation of Noninfectious Merozoites

Affiliations

Overexpression of Plasmodium berghei ATG8 by Liver Forms Leads to Cumulative Defects in Organelle Dynamics and to Generation of Noninfectious Merozoites

Christiane Voss et al. mBio. .

Abstract

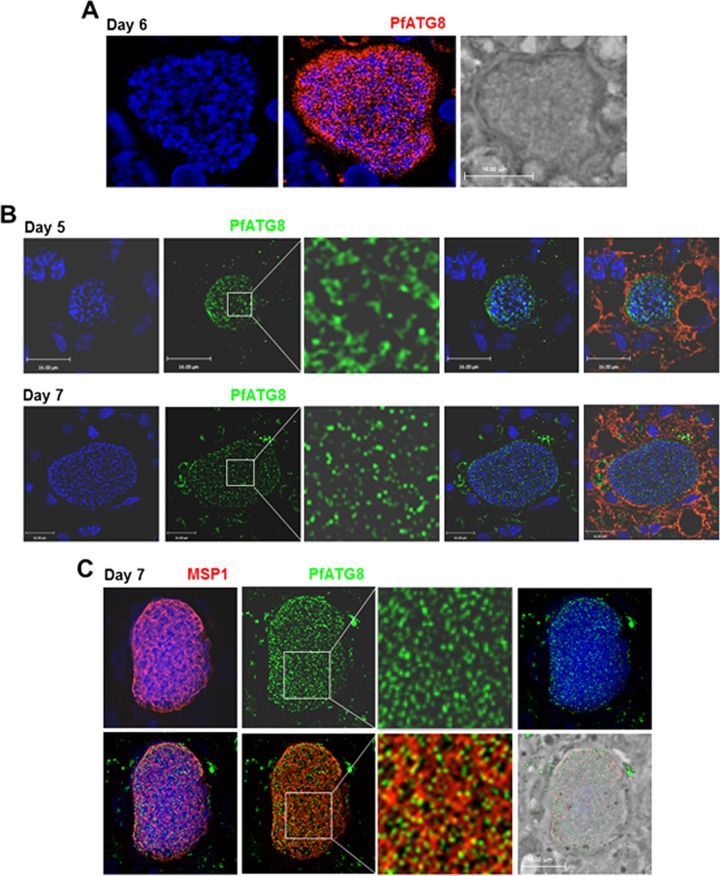
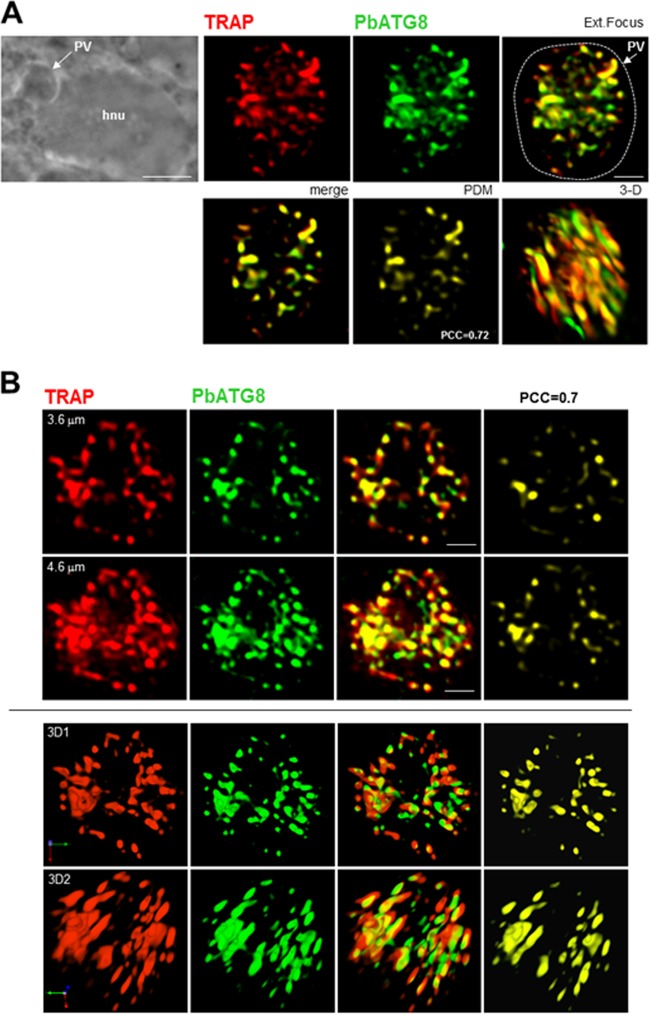
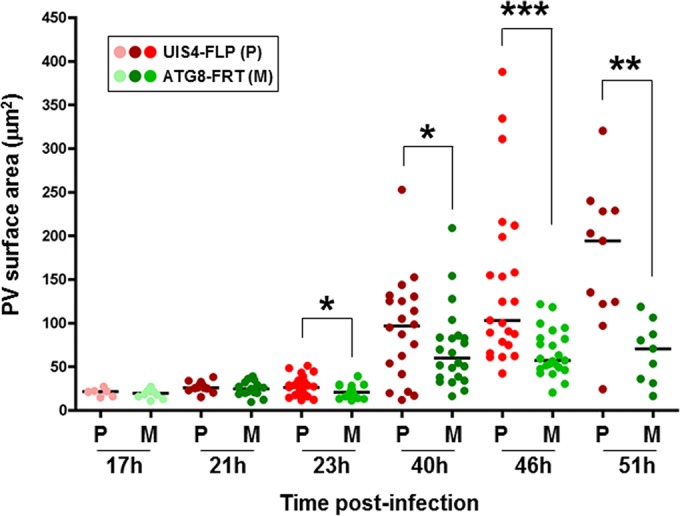
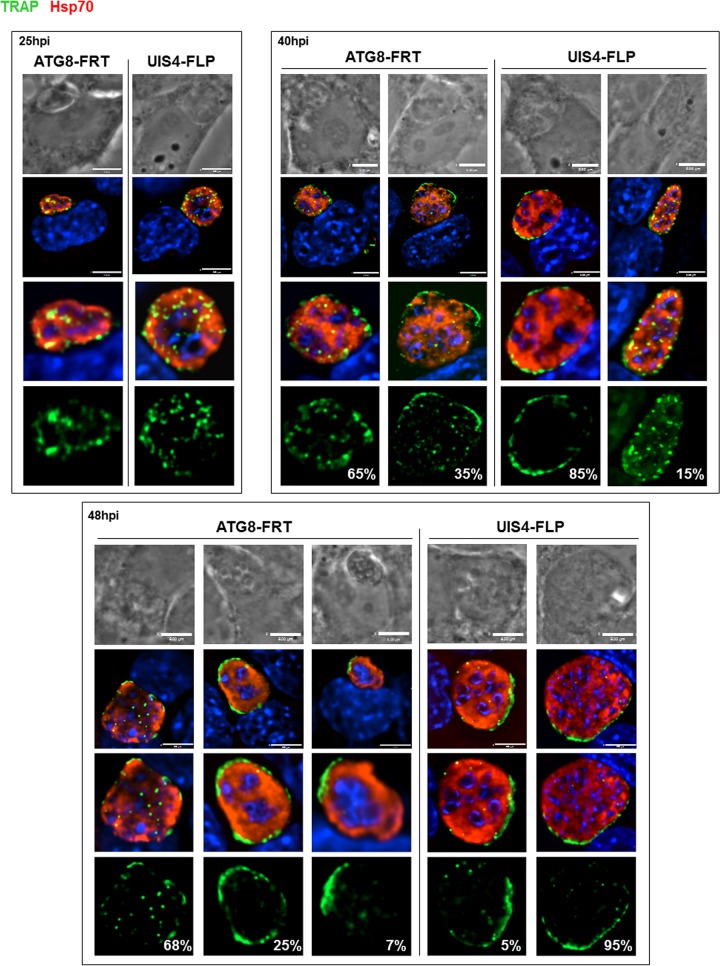
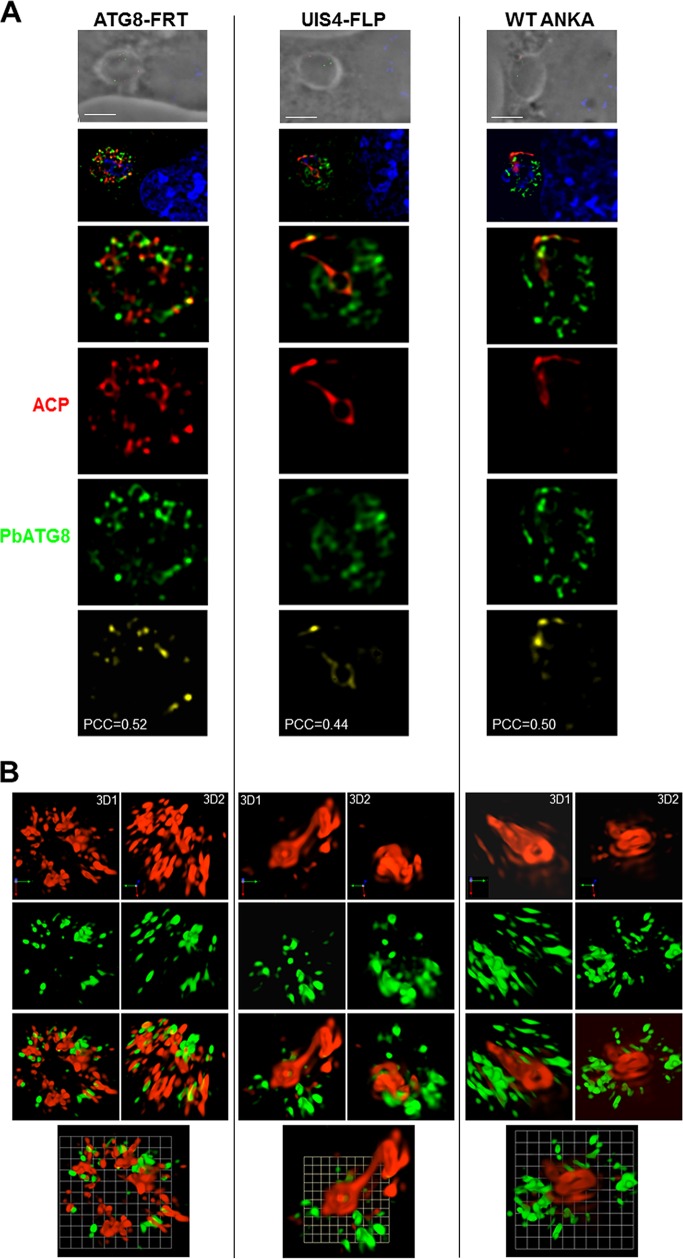
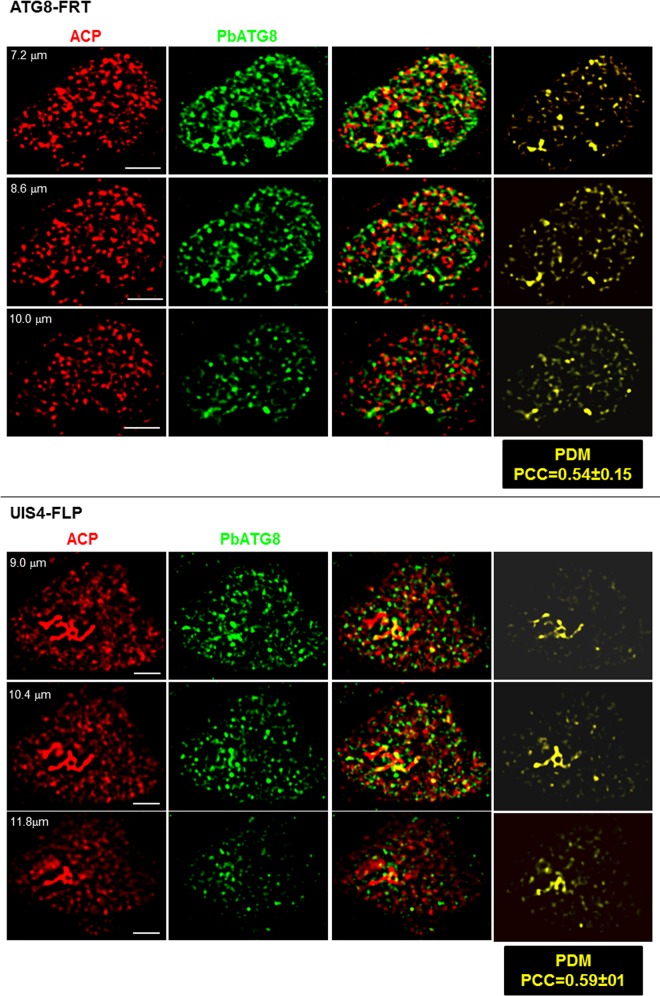
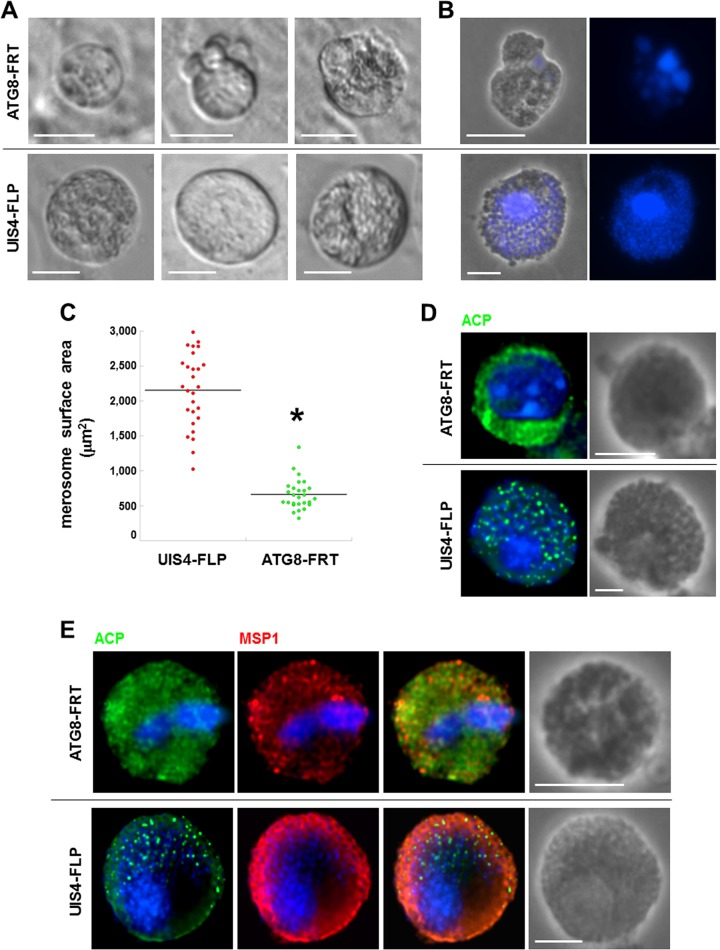
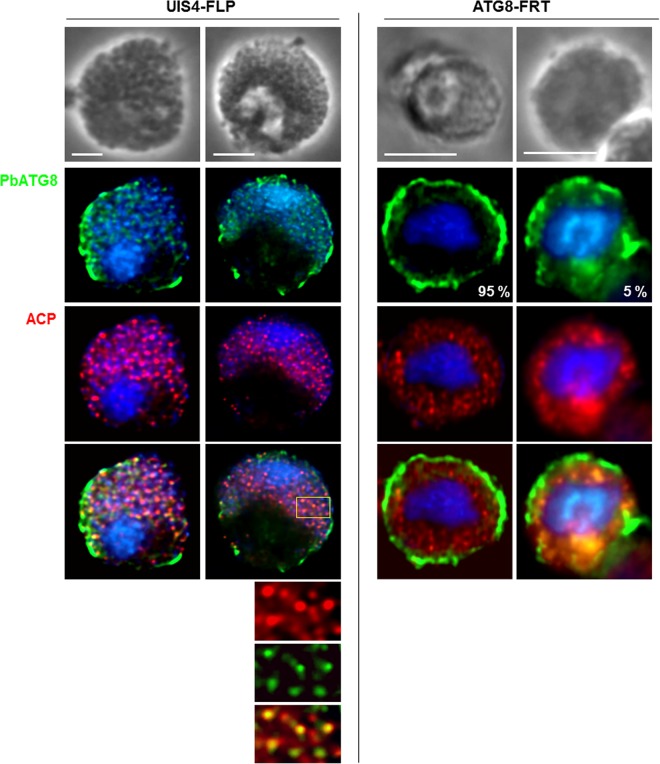
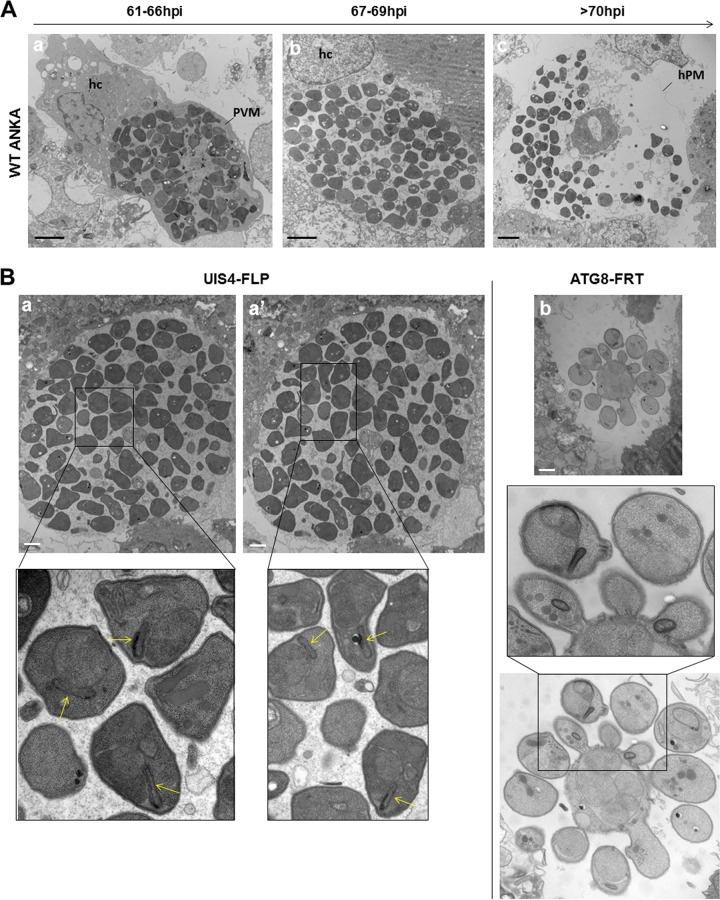
Plasmodium parasites undergo continuous cellular renovation to adapt to various environments in the vertebrate host and insect vector. In hepatocytes, Plasmodium berghei discards unneeded organelles for replication, such as micronemes involved in invasion. Concomitantly, intrahepatic parasites expand organelles such as the apicoplast that produce essential metabolites. We previously showed that the ATG8 conjugation system is upregulated in P. berghei liver forms and that P. berghei ATG8 (PbATG8) localizes to the membranes of the apicoplast and cytoplasmic vesicles. Here, we focus on the contribution of PbATG8 to the organellar changes that occur in intrahepatic parasites. We illustrated that micronemes colocalize with PbATG8-containing structures before expulsion from the parasite. Interference with PbATG8 function by overexpression results in poor development into late liver stages and production of small merosomes that contain immature merozoites unable to initiate a blood infection. At the cellular level, PbATG8-overexpressing P. berghei exhibits a delay in microneme compartmentalization into PbATG8-containing autophagosomes and elimination compared to parasites from the parental strain. The apicoplast, identifiable by immunostaining of the acyl carrier protein (ACP), undergoes an abnormally fast proliferation in mutant parasites. Over time, the ACP staining becomes diffuse in merosomes, indicating a collapse of the apicoplast. PbATG8 is not incorporated into the progeny of mutant parasites, in contrast to parental merozoites in which PbATG8 and ACP localize to the apicoplast. These observations reveal that Plasmodium ATG8 is a key effector in the development of merozoites by controlling microneme clearance and apicoplast proliferation and that dysregulation in ATG8 levels is detrimental for malaria infectivity.

Importance: Malaria is responsible for more mortality than any other parasitic disease. Resistance to antimalarial medicines is a recurring problem; new drugs are urgently needed. A key to the parasite's successful intracellular development in the liver is the metabolic changes necessary to convert the parasite from a sporozoite to a replication-competent, metabolically active trophozoite form. Our study reinforces the burgeoning concept that organellar changes during parasite differentiation are mediated by an autophagy-like process. We have identified ATG8 in Plasmodium liver forms as an important effector that controls the development and fate of organelles, e.g., the clearance of micronemes that are required for hepatocyte invasion and the expansion of the apicoplast that produces many metabolites indispensable for parasite replication. Given the unconventional properties and the importance of ATG8 for parasite development in hepatocytes, targeting the parasite's autophagic pathway may represent a novel approach to control malarial infections.


Figures

FIG 1
FIG 1
Expression of ATG8 by liver forms of Plasmodium falciparum in a humanized mouse. Immunofluorescence assays on mouse liver sections containing P. falciparum-infected human hepatocytes using anti-PfATG8 antibodies (red [A] or green [B]) at the indicated days p.i. In panel B, cells were counterstained with Evans blue. In panel C, the parasites were immunostained with antibodies against PfATG8 (green) and MSP1 for the plasma membrane of hepatic merozoites (red). DAPI (blue) was used for staining nuclei in all panels. The vast majority of the PfATG8 signal was associated with the PV. Some surrounding liver cells were also reacting with the anti-PfATG8 antibody: nonspecific background staining is inherent in liver tissue due to cell necrosis and high intracellular protein content. Bars, 16 μm.
FIG 2
FIG 2
Distribution of micronemes relative to PbATG8-containing structures in P. berghei-infected Hepa 1-6 cells. Double IFA on PV using antibodies against PbATG8 (green) and TRAP (red) to label micronemes 17 h p.i. (A) Shown are the phase image at low magnification showing the PV in a Hepa 1-6 cell (hnu, host nucleus), the extended-focus image (a merged image displaying the brightest point of all z-slices in a volume, thus providing maximum depth of field for the regions of the image), the merge image plus the positive product of the differences from the mean (PDM), and a 3-D rotated view of a representative PV. (B) Two optical z-slices of a PV and the 3-D reconstructions of the z-stacks of the same PV are shown. PCCs were calculated from 3 independent parasite preparations. Bars, 1 µm (except for the phase image in panel A, for which the bar is 7 µm).
FIG 3
FIG 3
Coassociation of PbATG8 with GRASP- and VPS4-positive structures. (A) Fluorescence assays on P. berghei-infected cells stained with LysoTracker (red) 40 h p.i. Parasites were identifiable by immunolabeling for Hsp70 (blue). Three optical z-slices of a PV are shown. Bar, 5 µm. (B) Transcriptional profiles of GRASP and VPS4 in P. berghei liver stages. Expression in liver-stage parasites at 1, 2, and 3 days p.i. was assayed by RT-PCR. To verify the absence of genomic DNA contamination, RT-PCRs were set up in duplicate with (+) and without (−) reverse transcriptase (RT). GAPDH or α-tubulin (αTub1) was used as an internal control. PCCs were calculated from 3 independent assays. (C) Double (a and b) or triple (c) IFA on P. berghei-infected cells 30 h p.i. using antibodies against PbATG8, PbGRASP, and PbVPS4. PCCs were calculated from 3 independent parasite preparations (n = 17 to 26 PVs). Bars, 10 µm.
FIG 4
FIG 4
Generation of a parasite strain expressing ATG8 with altered 3′ UTR. (A) Schematic representation of the construct ATG8-FRT. (B and C) The plasmid pUC18-p3′TRAP-hDHFR containing two FRT sites was used as the template for insertion of ATG8 and the UTRs before linearization with SphI and transfection into a UIS4-FLP parasite strain to generate a parasite strain expressing PbATG8 with a modified 3′ region, which was characterized by the presence of extra nucleotides inserted before the 3′ UTR of ATG8 as shown in panel B (blue, end of the ATG8 gene; black, 12 bp of 3′ UTR of TRAP; gray, 9 bp of NotI site; red, 6 bp from p3′TRAP-hDHFR flirted; orange, 34 bp from the FRT site; green, beginning of the 3′ UTR of ATG8) and confirmed by PCR, as shown in panel C in UIS4-FLP (parental) and ATG8-FRT (3′ mutant) strains. The P1/P2 primers were used to verify the presence of extra nucleotides in the ATG8-FRT strain. The expected sizes of the fragments are shown to the right of the gels. SPZ, sporozoites. (D) ATG8 gene expression measured by qRT-PCR. The α-tubulin 1 gene was used as a reference to normalize the amounts of the ATG8 transcripts. Transcript levels were represented as 2−ΔΔCT × 100 to show levels of transcripts expressed comparatively in the parental and mutant strains. (E) (a) IFA on P. berghei-infected cells using anti-PbATG8 antibodies (green) 17 h p.i. Shown are two rotated views of a PV from the parental and mutant strains. Bars, 4 µm. (b) Quantification of PbATG8 fluorescence levels. The corrected total cell fluorescence (CTCF) level was calculated from PVs with wild-type (WT), UIS4-FLP, and ATG8-FRT parasites immunostained for PbATG8 (n = 23 to 31 PVs), and data for the two strains are expressed as percentages of wild-type fluorescence levels.
FIG 5
FIG 5
PV size in ATG8-FRT schizonts. Hepa 1-6 cells were infected with parasites from either the ATG8-FRT strain (M, mutant) or the UIS4-FLP strain (P, parental) for the indicated times before fixation. IFA on PV using anti-Hsp70 antibodies was used to identify the PV, and the PV size was measured with Volocity software. Data shown in dot plots are medians from 3 separate biological assays (n = 55 to 73 PVs per parasite strain for each time point). *, P < 0.0409; **, P < 0.0019; ***, P < 0.0005 (unpaired t test).
FIG 6
FIG 6
Distribution of micronemes in converting ATG8-FRT parasites. Double IFA of Hepa 1-6 cells infected with either the ATG8-FRT strain or the UIS4-FLP strain for the indicated times using anti-Hsp70 antibodies (red) to identify the PV and anti-TRAP antibodies (green) to monitor the distribution of micronemes during conversion. DAPI (blue) identifies parasite nuclei. The percentage of PVs for a specific TRAP pattern, for either the mutant or the parental strain, at 25, 40, or 48 h p.i. is shown (n = 11 to 16 PVs). Bars, 6 µm.
FIG 7
FIG 7
Distribution of micronemes relative to PbATG8-containing structures in ATG8-FRT parasites. (A and B) Double IFA of Hepa 1-6 cells that were infected with either the ATG8-FRT strain or the UIS4-FLP strain for 17 h using antibodies against PbATG8 (green) and TRAP (red). (A) Two optical z-slices of a PV, the extended-focus image, and the image with the positive PDM. (B) Two 3-D rotated views of the PV shown in panel A with the extended-focus image and the image with the positive PDM. Bars, 2 µm.
FIG 8
FIG 8
Morphology of the apicoplast in ATG8-FRT trophozoites. Double IFA of Hepa 1-6 cells that were infected with either the ATG8-FRT strain or the UIS4-FLP strain for 9 h using antibodies against ACP (red) for the apicoplast and PbATG8 (green). (A) Two optical z-slices of a PV, the extended-focus image, and the image with the positive PDM. Bars, 1 µm. (B) CTCF levels were quantified on the two strains in reference to wild-type (WT) parasites (n = 18 to 25 PVs).
FIG 9
FIG 9
Morphology of the apicoplast in ATG8-FRT young schizonts. (A and B) Double IFA of Hepa 1-6 cells that were infected with wild-type parasites or the ATG8-FRT or UIS4-FLP strain for 17 h using antibodies against ACP (red) and PbATG8 (green). (A) Optical z-slices of a PV at two magnifications, the extended-focus image, the image Bars, 4 microns with the positive PDM, and the phase image. (B) Two 3-D rotated views of the PV shown in panel A with the extended-focus image are represented.
FIG 10
FIG 10
Morphology of the apicoplast in ATG8-FRT late schizonts. Double IFA of Hepa 1-6 cells that were infected with either the ATG8-FRT strain or the UIS4-FLP strain for 40 h using antibodies against ACP (red) and PbATG8 (green). Shown are the three optical z-slices of a PV, the extended-focus image, and the image with the positive PDM. PCCs were calculated from 3 independent parasite preparations. Bars, 4 µm.
FIG 11
FIG 11
Morphology of ATG8-FRT merosomes. (A) Live microscopy of freshly egressed merosomal structures from Hepa 1-6 cells infected with either the ATG8-FRT strain or the UIS4-FLP strain for 66 to 67 h. Shown are differential inference contrast images of representative merosomal structures from 3 different assays. Bars, 10 µm. (B) DAPI staining of fixed merosomal structures collected 67 h p.i. from Hepa 1-6 cells. Bars, 15 µm. (C) Size distribution of ATG8-FRT and UIS4-FLP merosomes collected in the medium and stained for Hsp70, estimated by using Volocity software. Data shown in dot plots are medians from 3 independent infections (n = 12 to 17 merosomes per assay per parasite strain). *, P < 0.0005 (unpaired t test). (D and E) IFA on ATG8-FRT and UIS4-FLP merosomes immunostained for ACP and MSP1 to visualize parasite cytokinesis 67 h p.i. Bars, 10 µm.
FIG 12
FIG 12
Distribution of PbATG8 in merosomes. Double IFA on ATG8-FRT or UIS4-FLP merosomes collected from Hepa 1-6 cells 67 h p.i. using antibodies against PbATG8 and ACP. The percentage of merosomal structures for a specific PbATG8 pattern in the mutant strain is shown (n = 17 PVs). Bars, 10 µm.
FIG 13
FIG 13
Ultrastructure of ATG8-FRT merosomes. (A) Transmission EM of infected host cell (hc) with wild-type parasites at the indicated times showing normal progression in merozoite formation with parasites surrounded by the PV membrane (PVM) (a) until 66 h that ruptures (b) from 67 h prior to the breakdown of the host plasma membrane (hPM), liberating free merozoites (c) from 70 h p.i. Bars, 5 µm. (B) Transmission EM of infected host cell with either the ATG8-FRT strain or the UIS4-FLP strain 68 h p.i. Panels a and a′ are serial sections of the same merosome from UIS4-FLP parasites showing individual merozoites with apicoplast (arrows in the insets). Panel b illustrates an aberrant merosome-like structure formed by ATG8-FRT parasites, with the image taken at the same magnification as that for UIS4-FLP merosomes shown in panels a and a′. Bars, 2 µm.

Similar articles

Cited by

References

    1. Ejigiri I, Sinnis P. 2009. Plasmodium sporozoite-host interactions from the dermis to the hepatocyte. Curr Opin Microbiol 12:401–407. doi:10.1016/j.mib.2009.06.006. - DOI - PMC - PubMed
    1. Kaushansky A, Kappe SH. 2015. Selection and refinement: the malaria parasite’s infection and exploitation of host hepatocytes. Curr Opin Microbiol 26:71–78. doi:10.1016/j.mib.2015.05.013. - DOI - PMC - PubMed
    1. Jayabalasingham B, Bano N, Coppens I. 2010. Metamorphosis of the malaria parasite in the liver is associated with organelle clearance. Cell Res 20:1043–1059. doi:10.1038/cr.2010.88. - DOI - PMC - PubMed
    1. Zaffagnini G, Martens S. 2016. Mechanisms of selective autophagy. J Mol Biol 428:1714–1724. doi:10.1016/j.jmb.2016.02.004. - DOI - PMC - PubMed
    1. Coppens I. 2011. Metamorphoses of malaria: the role of autophagy in parasite differentiation. Essays Biochem 51:127–136. doi:10.1042/bse0510127. - DOI - PMC - PubMed

Publication types

MeSH terms

LinkOut - more resources