

Association between markers of glucose metabolism and risk of colorectal cancer
- PMID: 27354075
- PMCID: PMC4932260
- DOI: 10.1136/bmjopen-2016-011430
Association between markers of glucose metabolism and risk of colorectal cancer
Abstract
Objectives: Independent epidemiological studies have evaluated the association between markers of glucose metabolism (including fasting glucose, fasting insulin, homeostasis model of risk assessment-insulin resistance (HOMA-IR), glycated haemoglobin (HbA1c) and C peptide) and the risk of colorectal cancer (CRC). However, such associations have not been systematically analysed and no clear conclusions have been drawn. Therefore, we addressed this issue using a meta-analysis approach.
Design: Systematic review and meta-analysis.
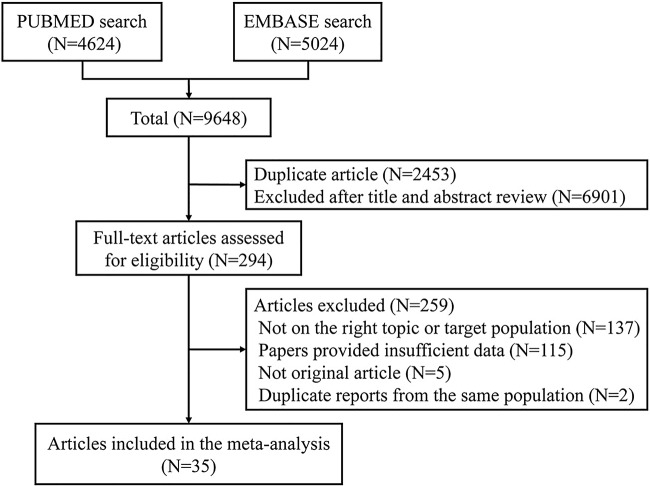
Data sources: PubMed and EMBASE were searched up to May 2015.
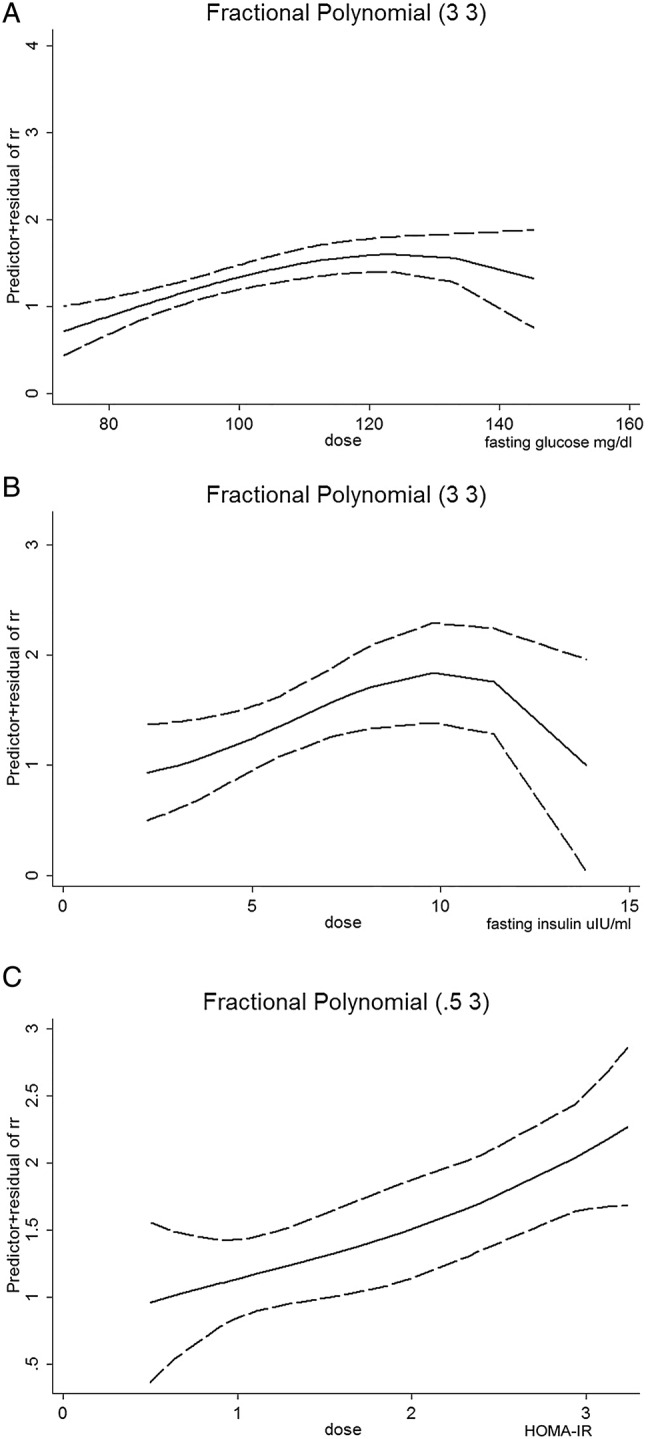
Primary and secondary outcome measures: Either a fixed-effects or random-effects model was adopted to estimate overall ORs for the association between markers of glucose metabolism and the risk of CRC. In addition, dose-response, meta-regression, subgroup and publication bias analyses were conducted.
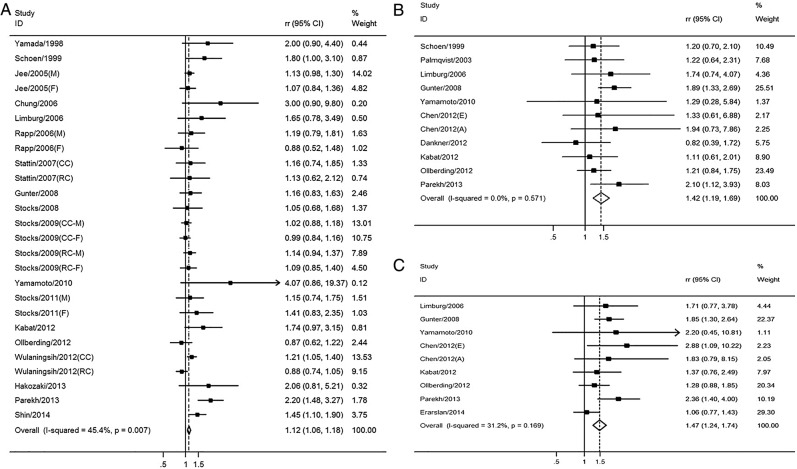
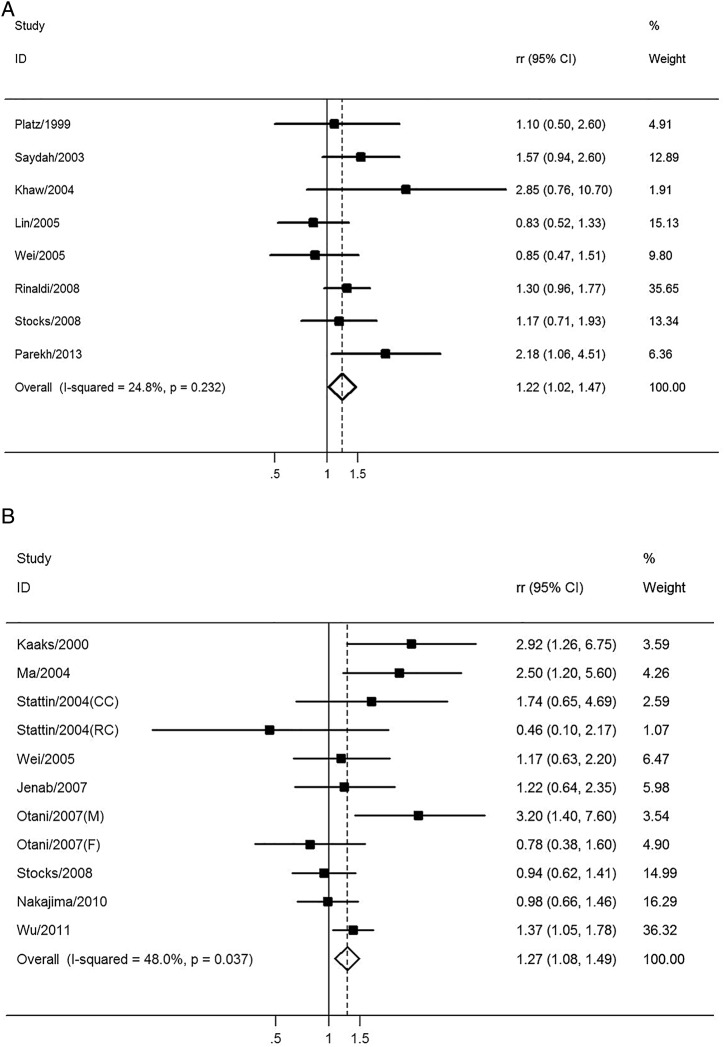
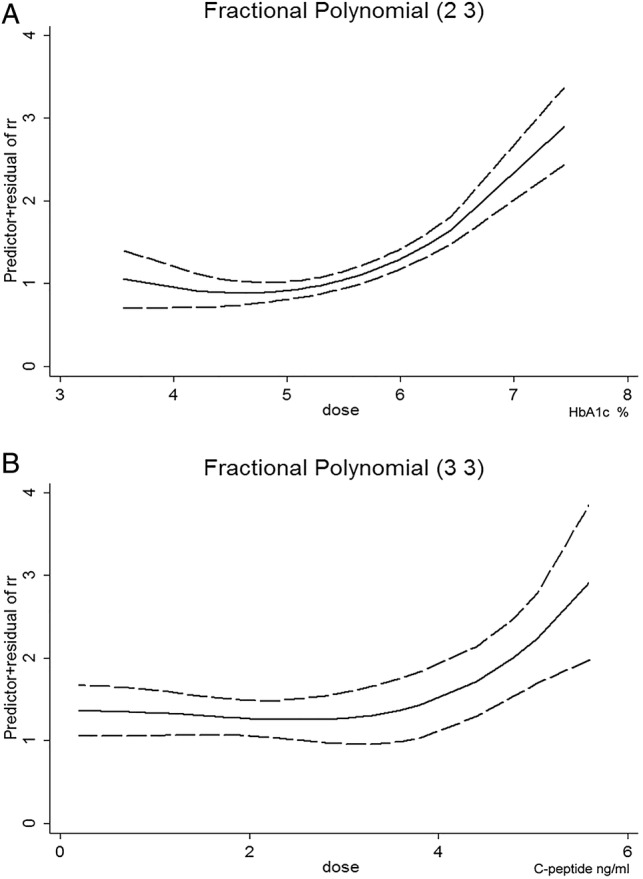
Results: 35 studies involving 25 566 patients and 5 706 361 participants were included. Higher levels of fasting glucose, fasting insulin, HOMA-IR, HbA1c and C peptide were all significantly associated with increased risk of CRC (fasting glucose, pooled OR=1.12, 95% CI 1.06 to 1.18; fasting insulin, pooled OR=1.42, 95% CI 1.19 to 1.69; HOMA-IR, pooled OR=1.47, 95% CI 1.24 to 1.74; HbA1c, pooled OR=1.22, 95% CI 1.02 to 1.47 (with borderline significance); C peptide, pooled OR=1.27, 95% CI 1.08 to 1.49). Subgroup analysis suggested that a higher HOMA-IR value was significantly associated with CRC risk in all subgroups, including gender, study design and geographic region. For the relative long-term markers, the association was significant for HbA1c in case-control studies, while C peptide was significantly associated with CRC risk in both the male group and colon cancer.
Conclusions: The real-time composite index HOMA-IR is a better indicator for CRC risk than are fasting glucose and fasting insulin. The relative long-term markers, HbA1c and C peptide, are also valid predictors for CRC risk. Considering the included case-control studies in the current analysis, more cohort studies are warranted to enhance future analysis.
Keywords: C-peptide; HOMA-IR; HbA1c; colorectal cancer; fasting glucose; fasting insulin.
Published by the BMJ Publishing Group Limited. For permission to use (where not already granted under a licence) please go to http://www.bmj.com/company/products-services/rights-and-licensing/
Figures
References
Publication types
MeSH terms
Substances
LinkOut - more resources
Full Text Sources
Other Literature Sources
Medical