. 2016 Aug 19;84(9):2627-38.
doi: 10.1128/IAI.00241-16. Print 2016 Sep.

Long-Term Immunity to Trypanosoma cruzi in the Absence of Immunodominant trans-Sialidase-Specific CD8+ T Cells

Affiliations

Long-Term Immunity to Trypanosoma cruzi in the Absence of Immunodominant trans-Sialidase-Specific CD8+ T Cells

Charles S Rosenberg et al. Infect Immun. .

Abstract

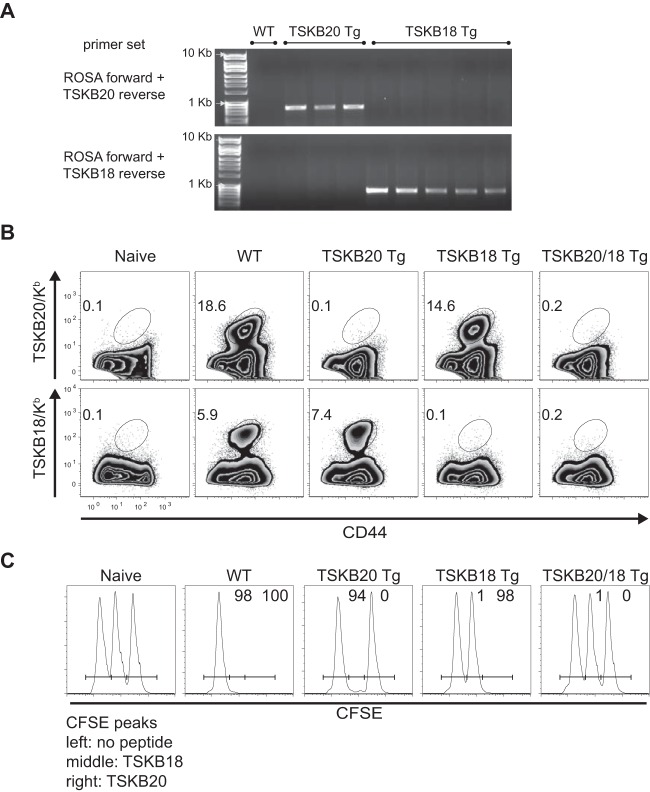
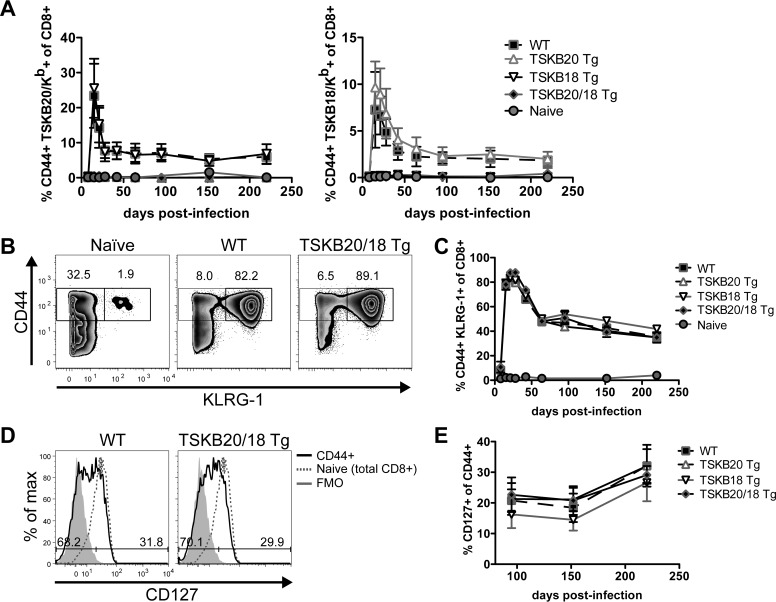
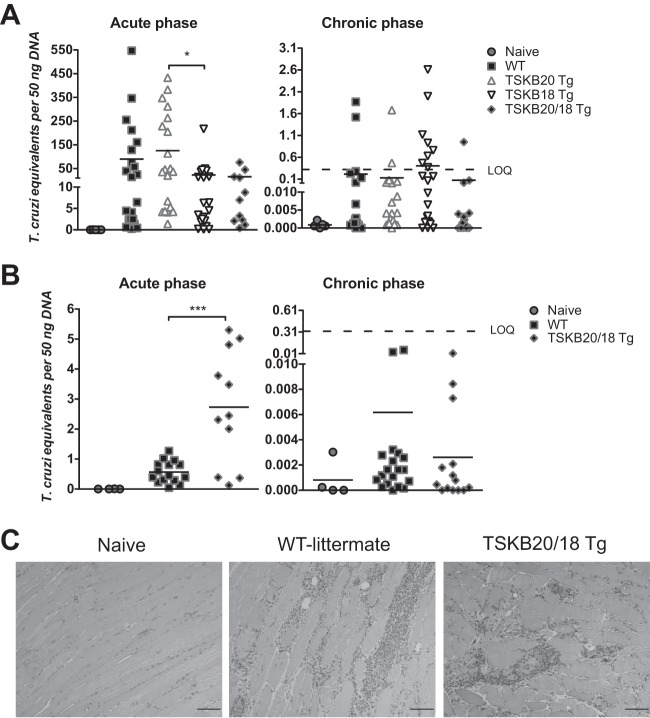
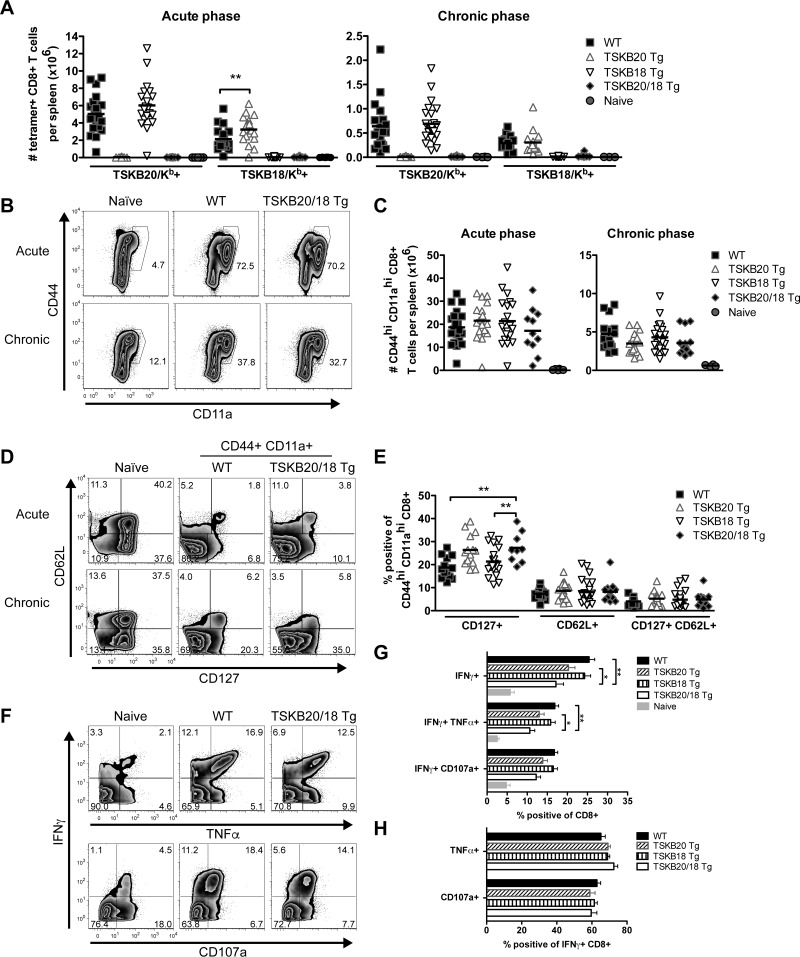
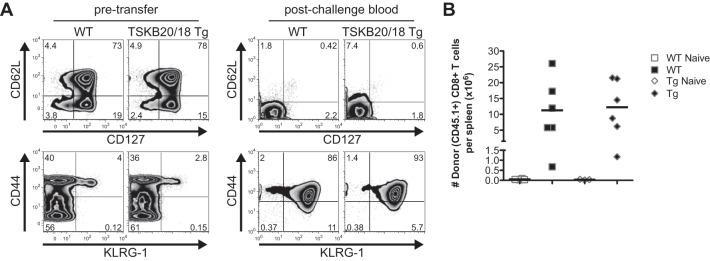
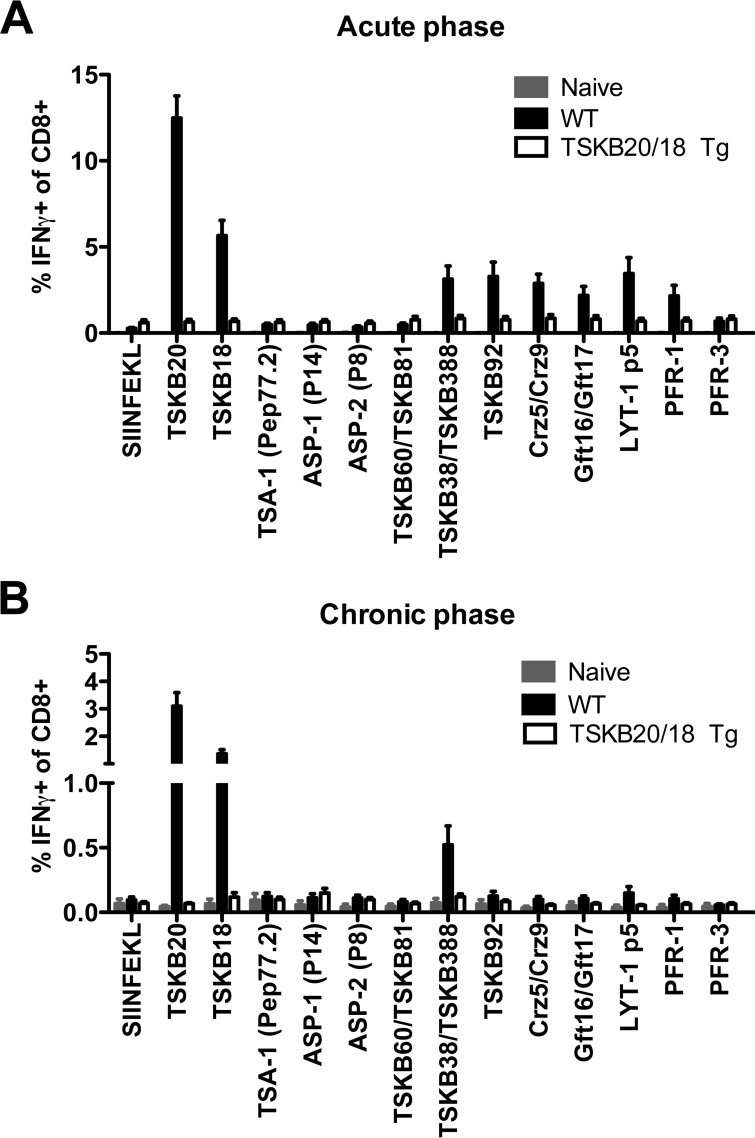
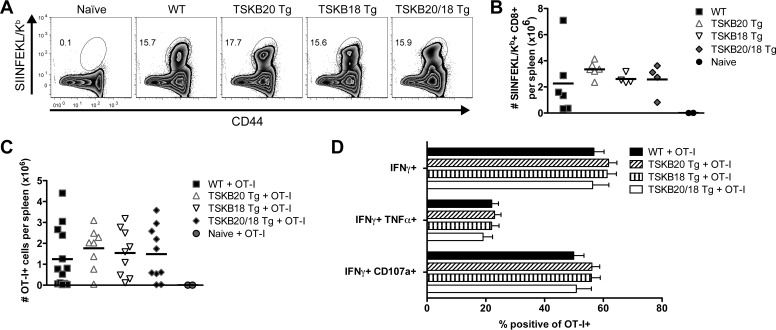
Trypanosoma cruzi infection drives the expansion of remarkably focused CD8(+) T cell responses targeting epitopes encoded by variant trans-sialidase (TS) genes. Infection of C57BL/6 mice with T. cruzi results in up to 40% of all CD8(+) T cells committed to recognition of the dominant TSKB20 and subdominant TSKB18 TS epitopes. However, despite this enormous response, these mice fail to clear T. cruzi infection and subsequently develop chronic disease. One possible reason for the failure to cure T. cruzi infection is that immunodomination by these TS-specific T cells may interfere with alternative CD8(+) T cell responses more capable of complete parasite elimination. To address this possibility, we created transgenic mice that are centrally tolerant to these immunodominant epitopes. Mice expressing TSKB20, TSKB18, or both epitopes controlled T. cruzi infection and developed effector CD8(+) T cells that maintained an activated phenotype. Memory CD8(+) T cells from drug-cured TSKB-transgenic mice rapidly responded to secondary T. cruzi infection. In the absence of the response to TSKB20 and TSKB18, immunodominance did not shift to other known subdominant epitopes despite the capacity of these mice to expand epitope-specific T cells specific for the model antigen ovalbumin expressed by engineered parasites. Thus, CD8(+) T cell responses tightly and robustly focused on a few epitopes within variant TS antigens appear to neither contribute to, nor detract from, the ability to control T. cruzi infection. These data also indicate that the relative position of an epitope within a CD8(+) immunodominance hierarchy does not predict its importance in pathogen control.


Figures

FIG 1
FIG 1
Transgenic expression of TS-derived peptides results in epitope-specific tolerance. (A) PCR products of the transgene construct amplified using TSKB20 or TSKB18 construct-specific primers from gDNA of transgenic founder mice but not from wild-type C57BL/6 gDNA. The primers used were located in the ROSA26 promoter sequence and the unique OVA/TSKB20 or OVA/TSKB18 insert's 3′ restriction sites. (B) Splenocytes from naive or acute-phase T. cruzi-infected WT, TSKB20 Tg, TSKB18 Tg, or TSKB20/18 Tg mice were stained for CD44 and TSKB20/Kb or TSKB18/Kb tetramers. Histograms are gated on CD8+ CD4, and numbers indicate the percentages of CD44hi tetramer-positive CD8+ cells. Data are from infection-matched individuals and are representative of 2 to 4 experiments per acutely infected group. (C) Naive splenocytes were pulsed with 1 μM TSKB20, 1 μM TSKB18, or no peptide and then labeled with high, medium, or low concentrations of CFSE, respectively. At 27 days postinfection, equal numbers of each population were cotransferred i.v. into mice and detected in the spleens after 16 h. Histograms are gated on CFSE+ lymphocytes. Numbers indicate the percentages of specific lysis measured for representative individuals compared with naive mice. Data are from two similar experiments (n = 4 to 7 mice per infected group).
FIG 2
FIG 2
Long-term immunity to T. cruzi by TSKB-peptide Tg mice. (A) TSKB20/Kb+ or TSKB18/Kb+ CD8+ T cells were measured longitudinally in peripheral blood of naive or T. cruzi-infected WT, TSKB20 Tg, TSKB18 Tg, or TSKB20/18 Tg mice as described foe Fig. 1B. (B) CD44hi KLRG-1+ CD8+ T cells detected in blood of naive or T. cruzi-infected TSKB20/18 Tg and WT littermates at 21 days postinfection. Histograms are gated on CD8+ CD4 lymphocytes, and numbers indicate the proportions of cells within gates. (C) CD44hi KLRG-1+ CD8+ T cells measured longitudinally in blood of mice analyzed as in panel B. (D) CD127 staining on peripheral blood CD44hi-gated CD8+ T cells (black line) compared with CD127 staining on total CD8+ T cells from a naive individual (dashed line). Filled gray histograms are CD44hi-gated CD8+ T cells not stained for CD127. Numbers indicate the proportions of CD44hi-gated CD8+ T gated cells expressing low (left) or high (right) levels of CD127 at 220 days postinfection. Data in panels B and D are representative of 2 identical experiments (n = 4 to 8 per infected group). (E) Proportion of CD44hi-gated CD8+ T cells stained positive for CD127 measured longitudinally in blood of mice analyzed as in panel D. Data in panels A, C, and E are means ± standard deviations (SD) (n = 3 to 11 per infected group) from one experiment (black squares are WT, up triangles are TSKB20 Tg, down triangles are TSKB18 Tg, diamonds are TSKB20/18 Tg, and circles are uninfected naive mice) and are representative of two similar longitudinal experiments.
FIG 3
FIG 3
Control of persistent T. cruzi infection by TSKB-peptide Tg mice. (A, B) The quantity of T. cruzi DNA in skeletal muscle (A) and fat (B) was detected by real-time PCR in mice during the acute phase (18 to 21 days postinfection) and chronic phase (238 to 337 days postinfection). Data points are individual mice (squares are WT, up triangles are TSKB20 Tg, down triangles are TSKB18 Tg, diamonds are TSKB20/18 Tg, and circles are uninfected naive mice) and bars are means from 4 cumulative acute-phase experiments (n = 11 to 21 per infected group) and 5 cumulative chronic-phase experiments (n = 14 to 23 per infected group). LOQ refers to the limit of detectable quantification based on serially diluted T. cruzi-spiked tissue DNA standards (0.32 parasite equivalents per 50 ng DNA). (C) Representative hematoxylin and eosin-stained skeletal muscle sections from naive or infected WT and TSKB20/18 Tg mice at 337 days postinfection. Scale bar, 200 μM. *, P < 0.05; ***, P < 0.001.
FIG 4
FIG 4
Effector CD8+ T cell populations expand and exhibit an effector-memory phenotype in the absence of TSKB20 and TSKB18 immunodominance. (A) The total number of TSKB20/Kb+ or TSKB18/Kb+ CD8+ T cells per spleen of naive or T. cruzi-infected WT, TSKB20 Tg, TSKB18 Tg, or TSKB20/18 Tg mice at 18 to 21 days postinfection (left) or 238 to 337 days postinfection (right). (B) Representative staining for CD44 and CD11a expression during acute (day 18) and chronic (day 238) phases of infection. Histograms are gated on CD8+ CD4 events, and numbers represent percentages of gated events. (C) The total number of CD44hi CD11ahi CD8+ T cells per spleen of age-matched naive or T. cruzi-infected WT, TSKB20 Tg, TSKB18 Tg, or TSKB20/18 Tg mice. (D) Representative staining for CD127 and CD62L expression during acute (day 18) and chronic (day 238) phases of infection. Histograms are gated on CD8+ CD4 for age-matched naive mice and further gated on CD44hi CD11ahi antigen-experienced cells for infected WT and TSKB20/18 Tg mice. (E) Proportion of CD44hi CD11ahi-gated CD8+ splenocytes that expressed the indicated marker during the chronic phase (238 to 337 days postinfection). Data points in panels A, C, and E are individual mice (squares are WT, up triangles are TSKB20 Tg, down triangles are TSKB18 Tg, diamonds are TSKB20/18 Tg, and circles are uninfected naive mice), and bars are means from 4 cumulative experiments in the acute phase (n = 11 to 21 per infected group) and 5 cumulative experiments in the chronic phase (n = 14 to 23 per infected group). (F) Representative intracellular staining of IFN-γ and TNF-α (top) or surface accumulation of CD107a (bottom) after 5 h of stimulation with plate bound anti-CD3. Histograms are gated on CD8+ CD4 events, and numbers indicate the proportions of events within the gated quadrant. Data are from 338 days postinfection. (G) Cumulative data presented in panel F. Data are from 4 cumulative experiments in the chronic phase (238 to 337 days postinfection) (n = 14 to 24 per infected group). (H) Data are from 3 cumulative experiments in the chronic phase (238 to 337 days postinfection) (n = 11 to 17 per infected group). Filled black bars are WT, forward-slashed bars are TSKB20 Tg, vertical-slashed bars are TSKB18 Tg, open bars are TSKB20/18 Tg, and filled gray bars are uninfected naive mice). Data are means + standard errors of the means (SEM). *, P < 0.05; **, P < 0.01.
FIG 5
FIG 5
Memory CD8+ T cell responses in the absence of TSKB20- and TSKB18-specific CD8+ T cells. WT littermates or TSKB20/18 Tg mice (both CD45.1/CD45.2) were infected with 1 × 10³ T. cruzi organisms, treated orally with benznidazole daily for 40 consecutive days, beginning at 15 days postinfection, and sacrificed >200 days after cessation of treatment. CD8+ T cells (2 × 10⁶) from spleens and lymph nodes of treated WT or TSKB20/18 Tg mice were transferred into uninfected WT or TSKB20/18 Tg (both CD45.2), respectively. Recipients were challenged the following day with 1 × 10⁴ T. cruzi organisms. (A) Surface phenotype of CD45.1+ CD8+ T cells before adoptive transfer (left) and in the peripheral blood of recipients 13 days after challenge (right). Numbers indicate percentages of events in the gate. (B) Total number of donor CD45.1+ CD8+ T cells recovered from spleens of challenged mice (filled symbols) at 21 days postinfection.
FIG 6
FIG 6
Subdominant parasite-derived epitopes are not recognized by CD8+ T cells in infected TSKB20/18 Tg mice. (A, B) Cumulative data from peptide-stimulated splenocytes from naive and acutely (A) or naive and chronically infected (B) WT or TSKB20/18 Tg mice. CD8+ CD4 gated events were assessed for IFN-γ staining after 5 h of incubation with 1 μM indicated peptide alone or indicated combined peptide pool. Data are representative of 5 acute-phase experiments at 18 to 21 days postinfection (n = 11 to 17 mice per infected group) and 4 chronic-phase experiments at 238 to 338 days postinfection (n = 11 to 13 mice per infected group). Filled gray bars are uninfected naive mice, filled black bars are WT, and open bars are TSKB20/18 Tg. Data are means +SEM.
FIG 7
FIG 7
Engineered immunodominant SIINFEKL-specific response in the absence of TSKB20 and TSKB18 immunodominance. (A) Representative SIINFEKL/Kb-tetramer staining of splenocytes from naive or WT, TSKB20 Tg, TSKB18 Tg, or TSKB20/18 Tg mice infected with T. cruzi Brazil-OVA at 22 days postinfection. Histograms are gated on CD8+ CD4, and the numbers indicate percentages of CD44hi SIINFEKL/Kb+ of CD8+ cells. (B) The total number of SIINFEKL/Kb+ CD8+ T cells from spleens of naive or Brazil-OVA infected WT, TSKB20 Tg, TSKB18 Tg, and TSKB20/18 Tg mice at 21 to 22 days postinfection. Data are cumulative results from 2 experiments (n = 4 to 6 per infected group). (C) Total number of CD45.1+ OT-I cells from spleens of naive or Brazil-OVA-infected WT, TSKB20 Tg, TSKB18 Tg, and TSKB20/18 Tg mice at 21 days postinfection. All mice received 50 OT-I cells i.v. prior to infection. Several infected individuals did not have detectable OT-I cells and were omitted from the analysis. Data points in panels B, C, and E represent individual mice (squares are WT, up triangles are TSKB20 Tg, down triangles are TSKB18 Tg, diamonds are TSKB20/18 Tg, and circles are uninfected naive mice), and bars are means. (D) Proportion of OT-I (CD45.1+) CD8+ T cells stained positive for the indicated marker in response to 5 h SIINFEKL peptide stimulation from spleens of Brazil-OVA-infected mice at 21 days postinfection. Filled black bars are results for WT, forward-slashed bars for TSKB20 Tg, vertical-slashed bars for TSKB18 Tg, and open bars for TSKB20/18 Tg mice. Data in panels C and D are cumulative results for 2 experiments (n = 8 to 13 per infected group).

References

    1. Wong P, Pamer EG. 2003. CD8 T cell responses to infectious pathogens. Annu Rev Immunol 21:29–70. doi:10.1146/annurev.immunol.21.120601.141114. - DOI - PubMed
    1. Yewdell JW. 2006. Confronting complexity: real-world immunodominance in antiviral CD8+ T cell responses. Immunity 25:533–543. doi:10.1016/j.immuni.2006.09.005. - DOI - PubMed
    1. Jordan KA, Hunter CA. 2010. Regulation of CD8+ T cell responses to infection with parasitic protozoa. Exp Parasitol 126:318–325. doi:10.1016/j.exppara.2010.05.008. - DOI - PMC - PubMed
    1. Gallimore A, Hengartner H, Zinkernagel R. 1998. Hierarchies of antigen-specific cytotoxic T-cell responses. Immunol Rev 164:29–36. doi:10.1111/j.1600-065X.1998.tb01205.x. - DOI - PubMed
    1. Yewdell JW, Bennink JR. 1999. Immunodominance in major histocompatibility complex class I-restricted T lymphocyte responses. Annu Rev Immunol 17:51–88. doi:10.1146/annurev.immunol.17.1.51. - DOI - PubMed

Publication types