

Changes in genetic selection differentials and generation intervals in US Holstein dairy cattle as a result of genomic selection
- PMID: 27354521
- PMCID: PMC4948329
- DOI: 10.1073/pnas.1519061113
Changes in genetic selection differentials and generation intervals in US Holstein dairy cattle as a result of genomic selection
Erratum in
-
Correction for García-Ruiz et al., Changes in genetic selection differentials and generation intervals in US Holstein dairy cattle as a result of genomic selection.Proc Natl Acad Sci U S A. 2016 Aug 16;113(33):E4928. doi: 10.1073/pnas.1611570113. Epub 2016 Aug 1. Proc Natl Acad Sci U S A. 2016. PMID: 27482093 Free PMC article. No abstract available.
Abstract
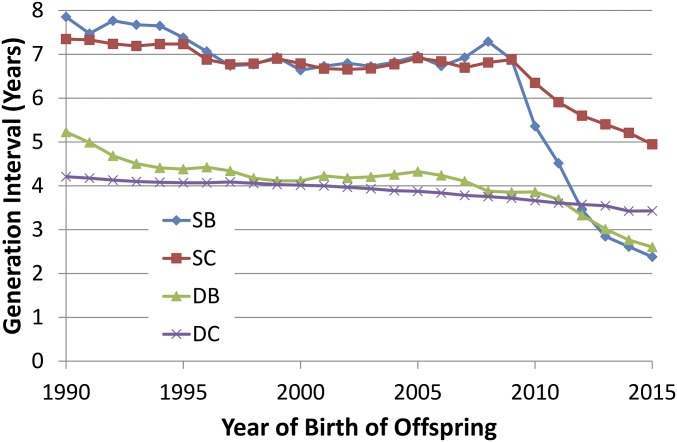
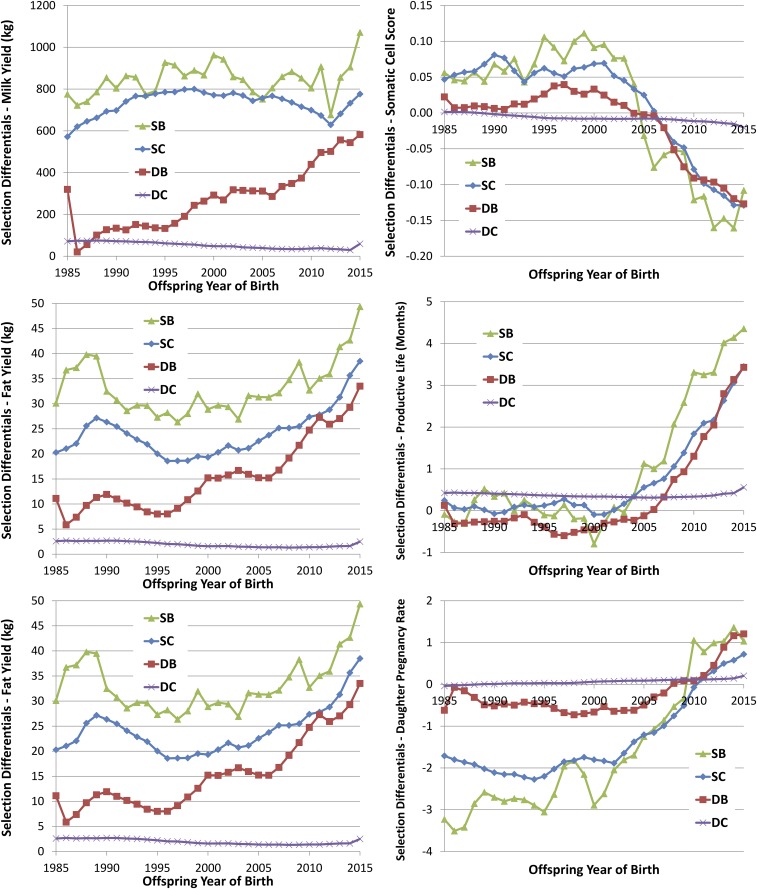
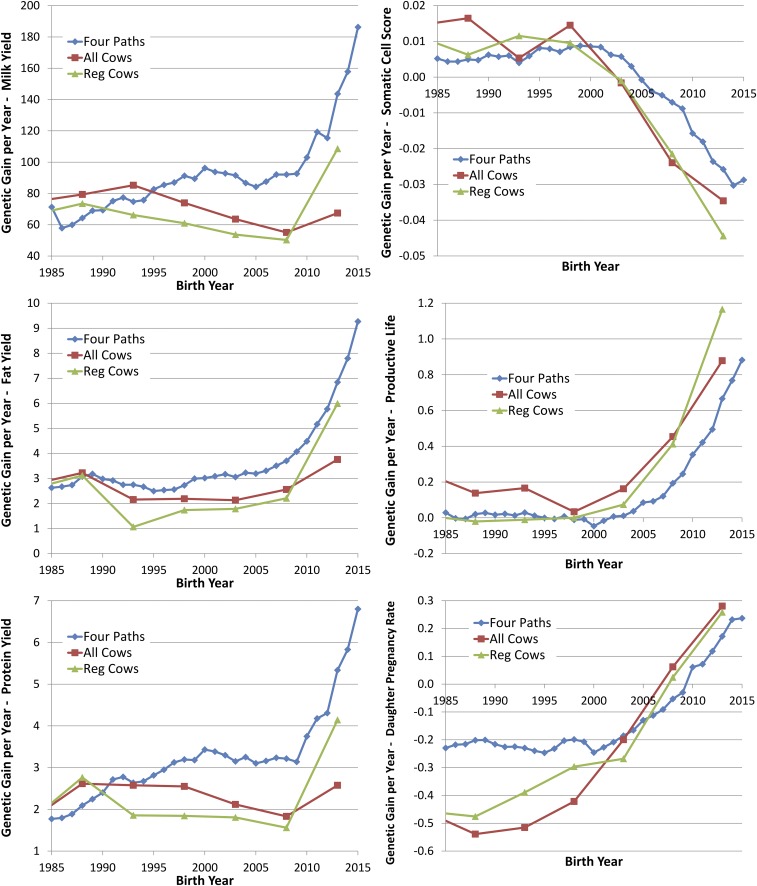
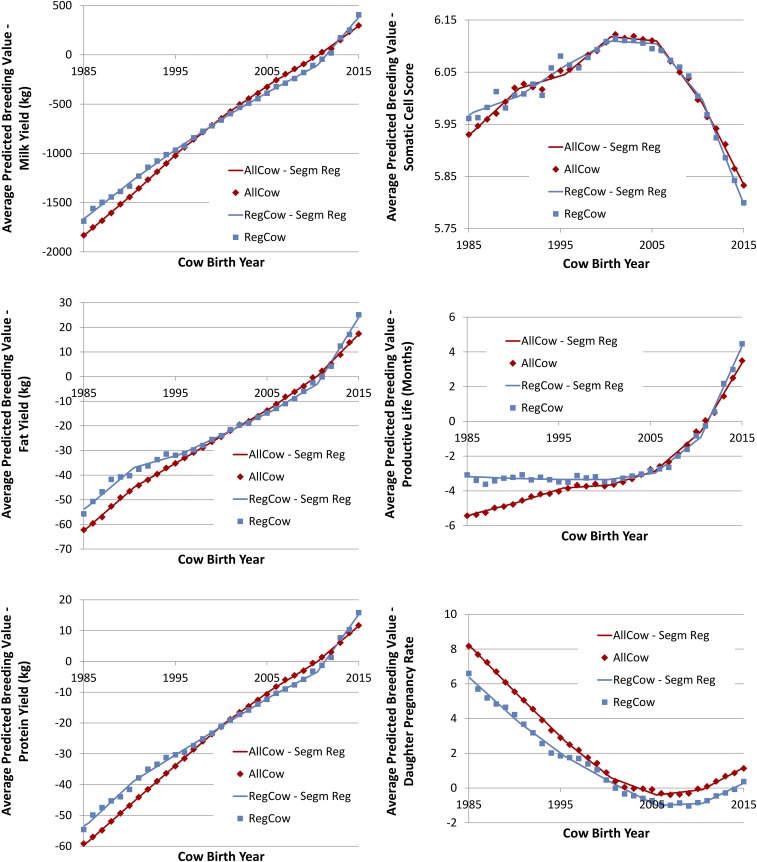
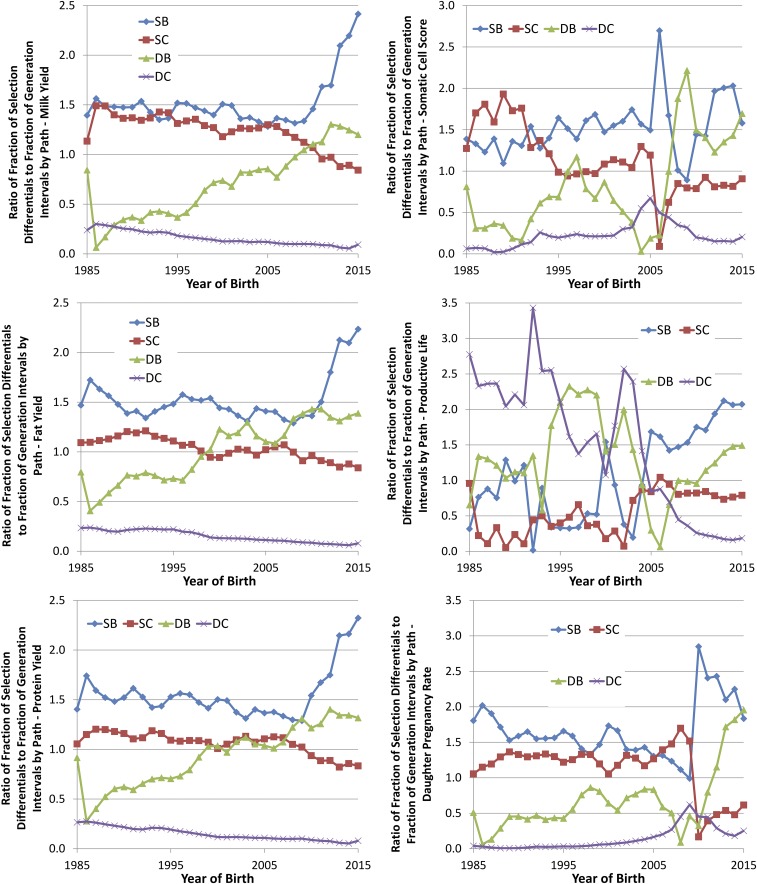
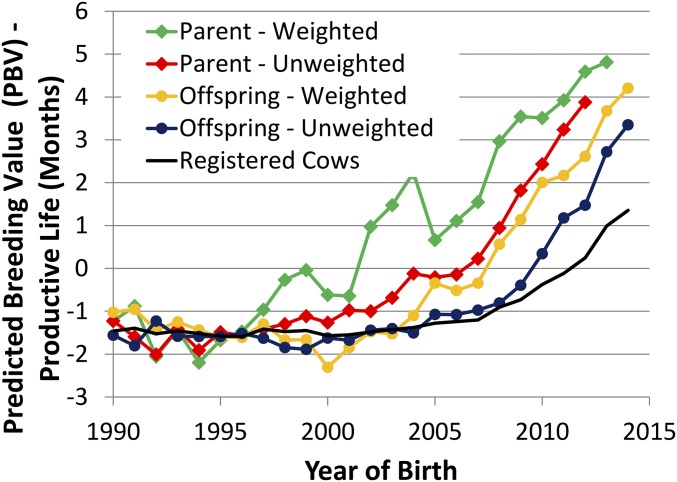
Seven years after the introduction of genomic selection in the United States, it is now possible to evaluate the impact of this technology on the population. Selection differential(s) (SD) and generation interval(s) (GI) were characterized in a four-path selection model that included sire(s) of bulls (SB), sire(s) of cows (SC), dam(s) of bulls (DB), and dam(s) of cows (DC). Changes in SD over time were estimated for milk, fat, and protein yield; somatic cell score (SCS); productive life (PL); and daughter pregnancy rate (DPR) for the Holstein breed. In the period following implementation of genomic selection, dramatic reductions were seen in GI, especially the SB and SC paths. The SB GI reduced from ∼7 y to less than 2.5 y, and the DB GI fell from about 4 y to nearly 2.5 y. SD were relatively stable for yield traits, although modest gains were noted in recent years. The most dramatic response to genomic selection was observed for the lowly heritable traits DPR, PL, and SCS. Genetic trends changed from close to zero to large and favorable, resulting in rapid genetic improvement in fertility, lifespan, and health in a breed where these traits eroded over time. These results clearly demonstrate the positive impact of genomic selection in US dairy cattle, even though this technology has only been in use for a short time. Based on the four-path selection model, rates of genetic gain per year increased from ∼50-100% for yield traits and from threefold to fourfold for lowly heritable traits.
Keywords: Holstein; dairy cattle; generation interval; genetic improvement; genomic selection.
Conflict of interest statement
The authors declare no conflict of interest.
Figures
Comment in
-
Holsteins are the genomic selection poster cows.Proc Natl Acad Sci U S A. 2016 Jul 12;113(28):7690-2. doi: 10.1073/pnas.1608144113. Epub 2016 Jun 29. Proc Natl Acad Sci U S A. 2016. PMID: 27357662 Free PMC article. No abstract available.
References
-
- Robertson A, Rendel JM. The use of progeny testing with artificial insemination in dairy cattle. J Genet. 1950;50(1):21–31. - PubMed
-
- Nejati-Javaremi A, Smith C, Gibson JP. Effect of total allelic relationship on accuracy of evaluation and response to selection. J Anim Sci. 1997;75(7):1738–1745. - PubMed
-
- König S, Simianer H, Willam A. Economic evaluation of genomic breeding programs. J Dairy Sci. 2009;92(1):382–391. - PubMed
Publication types
MeSH terms
LinkOut - more resources
Full Text Sources
Other Literature Sources
Miscellaneous
