

Genome wide analysis of protein production load in Trichoderma reesei
- PMID: 27354857
- PMCID: PMC4924338
- DOI: 10.1186/s13068-016-0547-5
Genome wide analysis of protein production load in Trichoderma reesei
Abstract
Background: The filamentous fungus Trichoderma reesei (teleomorph Hypocrea jecorina) is a widely used industrial host organism for protein production. In industrial cultivations, it can produce over 100 g/l of extracellular protein, mostly constituting of cellulases and hemicellulases. In order to improve protein production of T. reesei the transcriptional regulation of cellulases and secretory pathway factors have been extensively studied. However, the metabolism of T. reesei under protein production conditions has not received much attention.
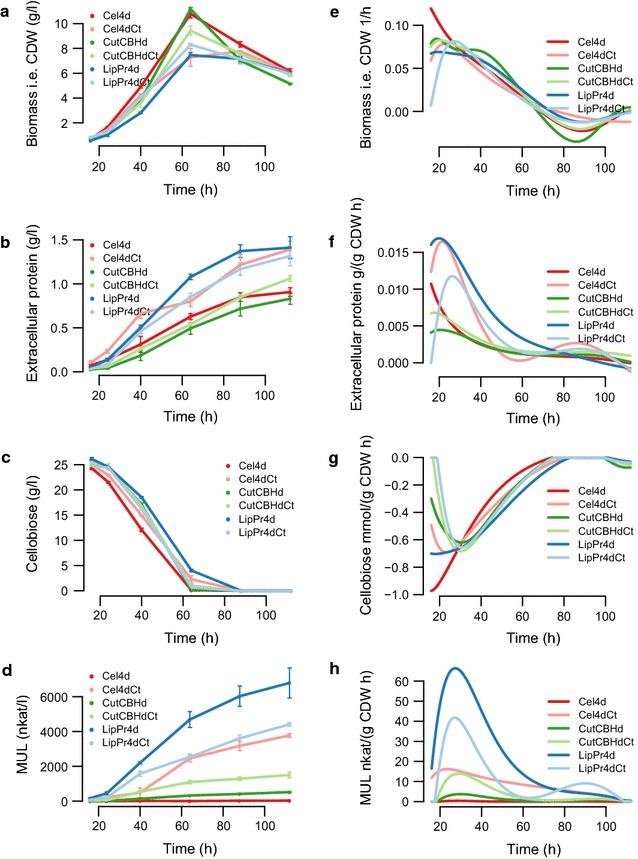
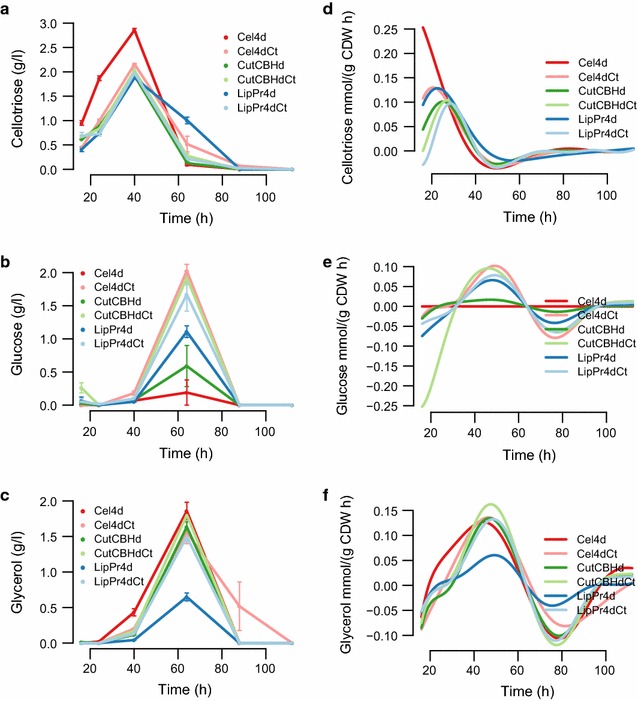
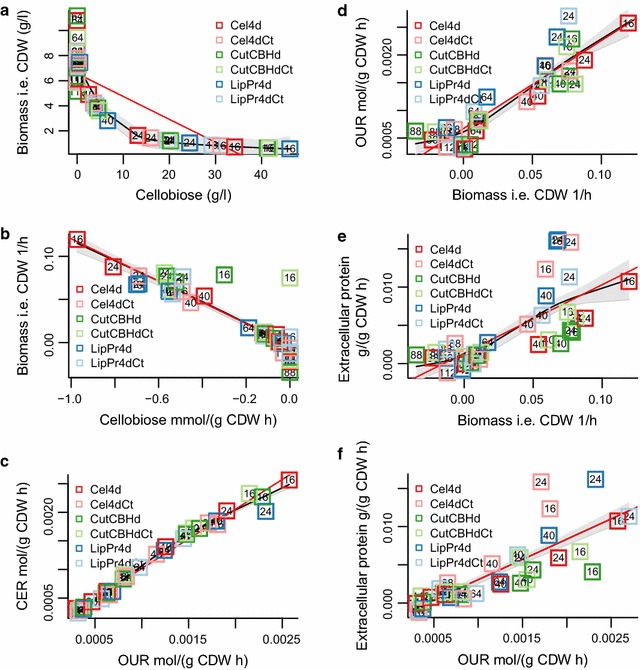
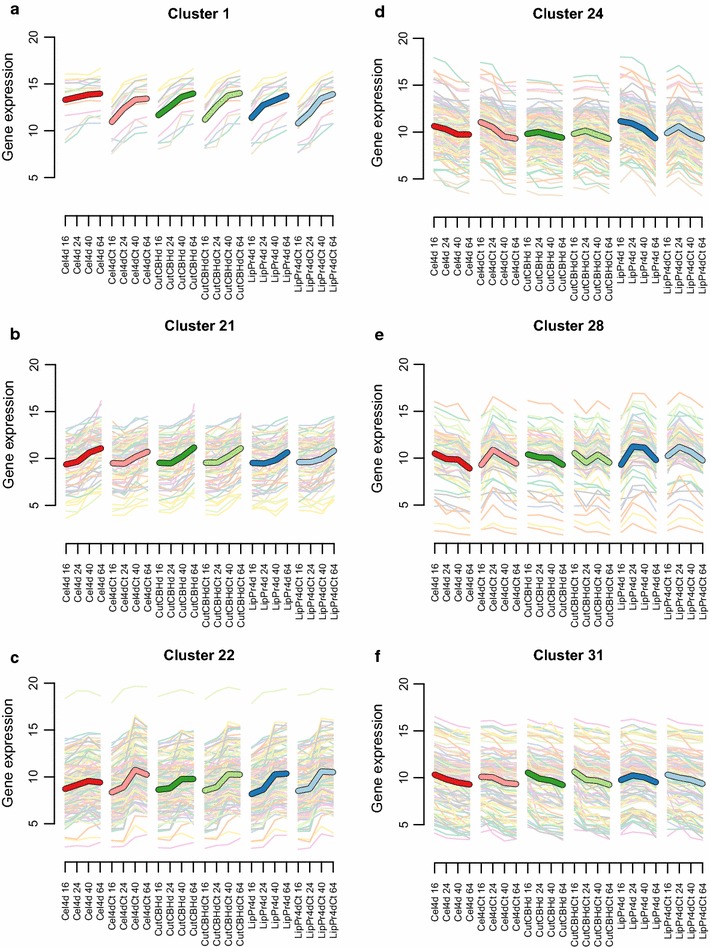
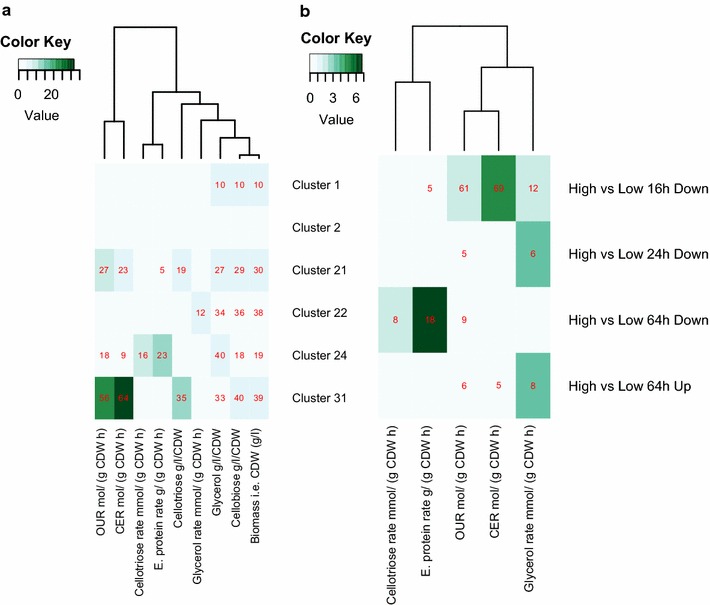
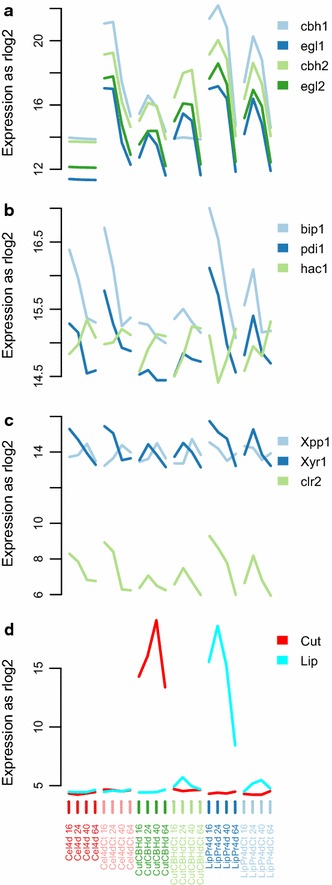
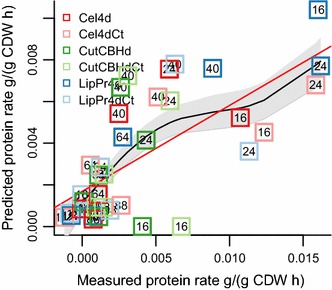
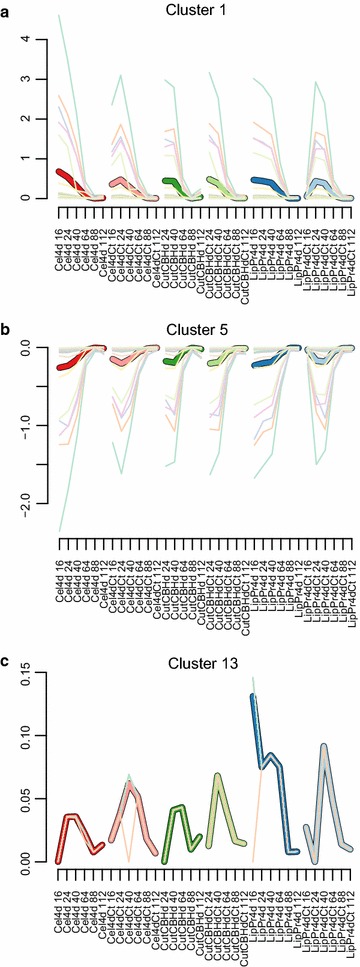
Results: To understand the physiology and metabolism of T. reesei under protein production conditions we carried out a well-controlled bioreactor experiment with extensive analysis. We used minimal media to make the data amenable for modelling and three strain pairs to cover different protein production levels. With RNA-sequencing transcriptomics we detected the concentration of the carbon source as the most important determinant of the transcriptome. As the major transcriptional response concomitant to protein production we detected the induction of selected genes that were putatively regulated by xyr1 and were related to protein transport, amino acid metabolism and transcriptional regulation. We found novel metabolic responses such as production of glycerol and a cellotriose-like compound. We then used this cultivation data for flux balance analysis of T. reesei metabolism and demonstrate for the first time the use of genome wide stoichiometric metabolic modelling for T. reesei. We show that our model can predict protein production rate and provides novel insight into the metabolism of protein production. We also provide this unprecedented cultivation and transcriptomics data set for future modelling efforts.
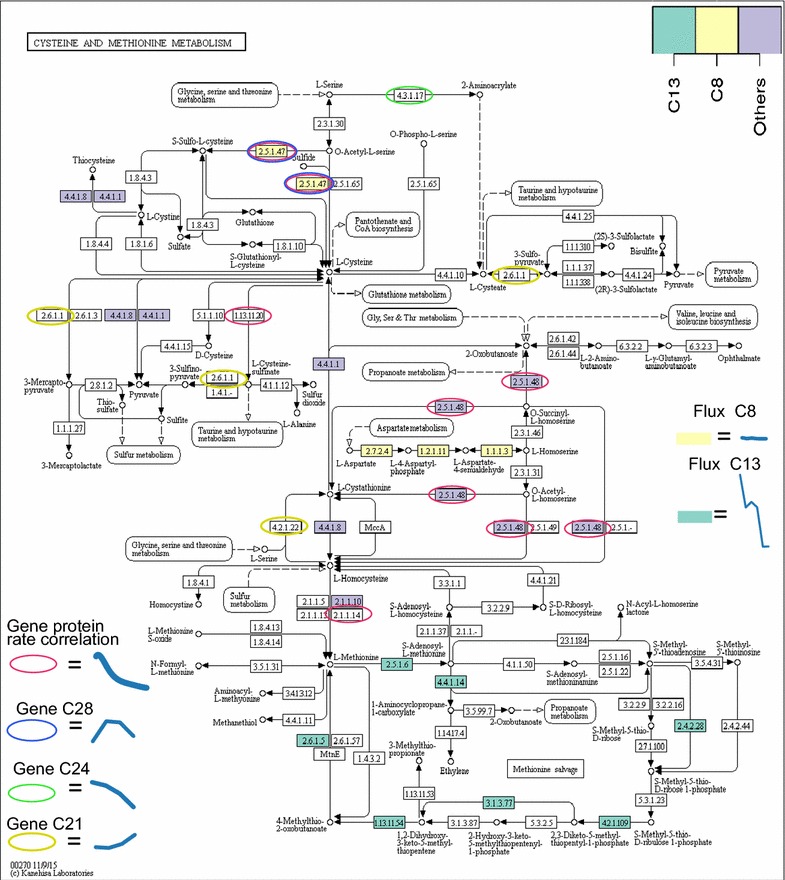
Conclusions: The use of stoichiometric modelling can open a novel path for the improvement of protein production in T. reesei. Based on this we propose sulphur assimilation as a major limiting factor of protein production. As an organism with exceptional protein production capabilities modelling of T. reesei can provide novel insight also to other less productive organisms.
Keywords: Flux balance analysis; Hypocrea jecorina; Metabolic modelling; Protein production; RNA sequencing; Stoichiometric model; Transcriptomics; Trichoderma reesei.
Figures
Similar articles
-
The cargo and the transport system: secreted proteins and protein secretion in Trichoderma reesei (Hypocrea jecorina).Microbiology (Reading). 2012 Jan;158(Pt 1):46-57. doi: 10.1099/mic.0.053132-0. Epub 2011 Nov 3. Microbiology (Reading). 2012. PMID: 22053009 Review.
-
Genome sequencing and analysis of the biomass-degrading fungus Trichoderma reesei (syn. Hypocrea jecorina).Nat Biotechnol. 2008 May;26(5):553-60. doi: 10.1038/nbt1403. Epub 2008 May 4. Nat Biotechnol. 2008. PMID: 18454138
-
13C-metabolic flux ratio and novel carbon path analyses confirmed that Trichoderma reesei uses primarily the respirative pathway also on the preferred carbon source glucose.BMC Syst Biol. 2009 Oct 29;3:104. doi: 10.1186/1752-0509-3-104. BMC Syst Biol. 2009. PMID: 19874611 Free PMC article.
-
Regulation of transcription of cellulases- and hemicellulases-encoding genes in Aspergillus niger and Hypocrea jecorina (Trichoderma reesei).Appl Microbiol Biotechnol. 2008 Feb;78(2):211-20. doi: 10.1007/s00253-007-1322-0. Epub 2008 Jan 16. Appl Microbiol Biotechnol. 2008. PMID: 18197406 Review.
-
Structure-guided engineering of transcriptional activator XYR1 for inducer-free production of lignocellulolytic enzymes in Trichoderma reesei.Synth Syst Biotechnol. 2023 Nov 22;8(4):732-740. doi: 10.1016/j.synbio.2023.11.005. eCollection 2023 Dec. Synth Syst Biotechnol. 2023. PMID: 38187093 Free PMC article.
Cited by
-
A comparison of Monte Carlo sampling methods for metabolic network models.PLoS One. 2020 Jul 1;15(7):e0235393. doi: 10.1371/journal.pone.0235393. eCollection 2020. PLoS One. 2020. PMID: 32609776 Free PMC article.
-
Regulation of plant cell wall degradation by light in Trichoderma.Fungal Biol Biotechnol. 2018 Apr 24;5:10. doi: 10.1186/s40694-018-0052-7. eCollection 2018. Fungal Biol Biotechnol. 2018. PMID: 29713489 Free PMC article. Review.
-
The influence of feedstock characteristics on enzyme production in Trichoderma reesei: a review on productivity, gene regulation and secretion profiles.Biotechnol Biofuels. 2019 Oct 8;12:238. doi: 10.1186/s13068-019-1571-z. eCollection 2019. Biotechnol Biofuels. 2019. PMID: 31624500 Free PMC article. Review.
-
Genetic engineering of Trichoderma reesei cellulases and their production.Microb Biotechnol. 2017 Nov;10(6):1485-1499. doi: 10.1111/1751-7915.12726. Epub 2017 May 29. Microb Biotechnol. 2017. PMID: 28557371 Free PMC article. Review.
-
Current genetic strategies to investigate gene functions in Trichoderma reesei.Microb Cell Fact. 2023 May 10;22(1):97. doi: 10.1186/s12934-023-02104-3. Microb Cell Fact. 2023. PMID: 37161391 Free PMC article. Review.
References
-
- Castillo FJ, Blanch HW, Wilke CR. Lactase production in continuous culture by Trichoderma reesei Rut-C30. Biotechnol Lett. 1984;6(9):593–596. doi: 10.1007/BF00135688. - DOI
-
- Chaudhuri BK, Sahai V. Comparison of growth and maintenance parameters for cellulase biosynthesis by Trichoderma reesei-C5 with some published data. Enzym Microb Technol. 1994;16(12):1079–1083. doi: 10.1016/0141-0229(94)90146-5. - DOI
LinkOut - more resources
Full Text Sources
Other Literature Sources
Research Materials
