. 2016 Jun 29;12(6):e1004913.
doi: 10.1371/journal.pcbi.1004913. eCollection 2016 Jun.

Constrained Allocation Flux Balance Analysis

Affiliations

Constrained Allocation Flux Balance Analysis

Matteo Mori et al. PLoS Comput Biol. .

Abstract

New experimental results on bacterial growth inspire a novel top-down approach to study cell metabolism, combining mass balance and proteomic constraints to extend and complement Flux Balance Analysis. We introduce here Constrained Allocation Flux Balance Analysis, CAFBA, in which the biosynthetic costs associated to growth are accounted for in an effective way through a single additional genome-wide constraint. Its roots lie in the experimentally observed pattern of proteome allocation for metabolic functions, allowing to bridge regulation and metabolism in a transparent way under the principle of growth-rate maximization. We provide a simple method to solve CAFBA efficiently and propose an "ensemble averaging" procedure to account for unknown protein costs. Applying this approach to modeling E. coli metabolism, we find that, as the growth rate increases, CAFBA solutions cross over from respiratory, growth-yield maximizing states (preferred at slow growth) to fermentative states with carbon overflow (preferred at fast growth). In addition, CAFBA allows for quantitatively accurate predictions on the rate of acetate excretion and growth yield based on only 3 parameters determined by empirical growth laws.


Conflict of interest statement

The authors have declared that no competing interests exist.

Figures
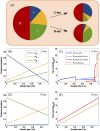
Fig 1
Fig 1. CAFBA solutions for E. coli in the homogeneous case for carbon limitation and translational limitation.
(A) Proteome organization in CAFBA: R-sector of ribosome-affiliated proteins (growth rate dependent), E-sector of “enzymes” (flux-dependent), C-sector of catabolic proteins (dependent on the carbon influx), and a fixed Q-sector of “housekeeping” proteins. The fractions in these four sectors sum up to one. C-, E- and R- sectors adjust their size depending on the environmental conditions, while the Q-sector accounts for roughly 50% of the proteome. We model the three growth-dependent sectors as a constant plus a variable part, i.e. ϕX = ϕX,0 + ΔϕX with X ∈ {C, E, R}. ΔϕC = wc vC is proportional to the carbon intake flux; ΔϕE = ∑i wi|vi| is a weighted sum of non-catabolic fluxes; ΔϕR = wR λ is proportional to the growth rate λ. (B) Growth rate-dependent parts of proteome sectors plotted versus λ in carbon limitation (C-lim). As the external glucose concentration is reduced, more catabolic proteins are needed per unit of carbon influx. The cell allocates a larger share to C-proteins, while reducing the E- and R-sector shares. (C) CAFBA fluxes as a function of λ, obtained by varying the degree of carbon (glucose) limitation (C-lim). A transition from fermentation to respiration appears when growth rate is in the range 0.7–0.9/h. The Embden-Doudoroff pathway and the glyoxylate shunt are both operated at high growth rates. (D) The λ-dependent parts of the proteome sectors plotted against growth rate in translational limitation (R-lim). This is obtained by keeping wC constant while increasing wR, thereby simulating increasing levels of translation-inhibiting antibiotics. The cell allocates more proteins to the ribosomal sector while reducing the proteome share devoted to carbon metabolism and biosynthesis. (E) CAFBA fluxes as a function of λ obtained in R-limitation for increasing values of wR, at constant wC. Acetate is secreted at low growth rates if the extracellular carbon level is large enough. Fluxes through the TCA cycle, the glyoxylate shunt and the Entner-Doudoroff pathway are represented by αKG dehydrogenase, malate synthase and 6-phosphogluconate dehydratase fluxes, respectively. In panels B and C, corresponding to C-limitation, wR was set to wR,0 = 0.169 h, while R-limitation (panels D and E) was obtained using wC = 1.4 × 10⁻³ gh/mmol, corresponding to a carbon source with high nutritional capacity. In both cases we set all weights in the E-sector to wE = 8.3 × 10⁻⁴ gh/mmol and ϕmax = 48.4%.
Fig 2
Fig 2. CAFBA solutions for E. coli in the heterogeneous case in carbon limitation.
Fluxes in glucose minimal medium computed at fixed wC ≥ 0 for different realizations of the E-sector weights, using 〈w〉 = 8.8 × 10⁻⁴ gh/mmol and wmax/wmin = 10 (δ = 1). (A) Histogram of the growth rates obtained from 1000 CAFBA solutions obtained using different randomly drawn weights for reactions in the E-sector and wC = 0. λ peaks around λmax = 1/h. (B) Histogram of the acetate secretion rates in the same conditions. Two classes of solutions are clearly visible, with roughly 25% of states excreting less than 0.5 mmol/gDWh of acetate. The average secretion flux is close to 10 mmol/gDWh. (C) Average fluxes (glucose intake, carbon excretion, TCA, glyoxylate shunt, acetate excretion and ED pathway) versus the average growth rate. Each point represents the average of 1000 CAFBA solutions obtained with the same wC and different realizations of the weights of reactions in the E-sector. Both x and y error bars are shown. Different points are obtained by using different wC values. Acetate secretion is approximately linear at large values of λ. A line vac = s × (λλac) with s = 45 mmol/gDW and λac = 0.79/h is shown for comparison.
Fig 3
Fig 3. Comparison between CAFBA predictions and experimental data.
(A) Acetate secretion rates for E. coli cells grown in minimal glucose media, with data obtained from different datasets [, –51]. Full dots represent average CAFBA solutions (heterogeneous case) obtained with different degrees of carbon limitation (different wC, averages over 500 solutions). Results were obtained with two different values for the average E-sector weight, namely 〈w〉 = 8.8 × 10⁻⁴ gh/mmol (red) and 〈w〉 = 1.55 × 10⁻³ gh/mmol (blue). These choices reproduce the acetate secretion rates of NCM3722 and ML308 (open circles) and MG1655 (open triangles) strains, respectively. (B) Same as panel (A), but for the growth yield. CAFBA predictions (red and blue filled circles) are obtained by averaging the ratio of the growth rate to the glucose intake flux, divided by the molecular weight of glucose μglc = 0.18 g/mmol. Data points from [29] have been converted using 1 mM/OD600/h = 2 mmol/gDWh. x- and y-error bars for the average CAFBA solutions are too small to be visible.
Fig 4
Fig 4. Average CAFBA solutions (heterogeneous case) for six different glycolytic carbon sources.
Each plot shows a different average flux, specifically: (A) Acetate secretion, (B) TCA cycle flux (represented by αKG dehydrogenase), (C) Glyoxylate shunt flux (malate synthase), (D) CO2 secretion, (E) ED pathway flux, (6-phosphogluconate dehydratase). Each point represents the average over 500 solutions obtained with the same wC ≥ 0 and 〈w〉 = 8.8 × 10⁻⁴ gh/mmol. Vertical lines at λac = 0.79/h are shown for clarity. In panel (A), acetate secretion can be approximated, for λλac, with a straight line vac = s × (λλac) with s = 45 mmol/gDW.
Fig 5
Fig 5. Overlap between FBA and CAFBA solutions.
(A) Overlapq between pFBA and CAFBA solutions as a function of growth rate, computed for three different reaction sets: all reactions included in the reconstruction, reactions in the glycolysis/gluconeogenesis pathway, and reactions in the TCA cycle. FBA fluxes were computed for the same glucose influx as the CAFBA solution and then interpolated at the growth rates of CAFBA solutions in order to plot the overlap as a function of λ. (B) Growth yield and acetate secretion from CAFBA, together with the FBA-predicted growth yield. In both panels the value λac = 0.79/h is marked by a vertical dashed line.
Fig 6
Fig 6. CAFBA solutions with growth rate-dependent biomass composition.
Representative fluxes obtained by CAFBA for E. coli growth in glucose minimal medium with fixed (blue points) and variable biomass composition (in open red, yellow and green markers for three different values of the λ-dependent ATP hydrolysis rate βATP). (A) Acetate secretion rate, (B) CO2 secretion rate, (C) flux through TCA cycle (αKG dehydrogenase), (D) flux through glyoxylate shunt (Malate synthase), (E) growth yield. No significant differences are observed between the constant and λ-dependent cases for βATP = 45.5608 mmolATP/gDW, corresponding to the default value for the iJR904 model. We also show, for comparison, results obtained for larger and smaller values of βATP. The acetate secretion rate can always be fitted by a linear function of λ, i.e. vac = s × (λλac), albeit with different slopes and intercepts. The three dashed lines correspond to s = 39, 45, 51 mmol/gDW, respectively, while λac = 0.86, 0.79, 0.72/h, respectively. We also indicate λac = 0.79/h with a vertical dashed line in all panels. In all cases we set 〈w〉 = 8.8 × 10⁻⁴ gh/mmol, wC ≥ 0 and wmax/wmin = 10.

Similar articles

Cited by

References

    1. Monod J (1949) The growth of bacterial cultures. Ann Rev Microbiol 3: 371–394 10.1146/annurev.mi.03.100149.002103 - DOI
    1. Schaechter M, Maaløe O, Kjeldgaard N (1958) Dependency on medium and temperature of cell size and chemical composition during balanced growth of Salmonella typhimurium. J Gen Microbiol 19: 592–606 10.1099/00221287-19-3-592 - DOI - PubMed
    1. Kjeldgaard N, Kurland C (1963) The distribution of soluble and ribosomal RNA as a function of growth rate. J Mol Biol 6: 341–348 10.1016/S0022-2836(63)80093-5 - DOI
    1. Bremer H, Dennis PP (1996) Modulation of chemical composition and other parameters of the cell by growth rate. Escherichia coli and Salmonella: Cellular and Molecular Biology 2: 1553–1569
    1. Scott M, Gunderson CW, Mateescu EM, Zhang Z, Hwa T (2010) Interdependence of cell growth and gene expression: origins and consequences. Science 330: 1099–1102 10.1126/science.1192588 - DOI - PubMed

Publication types

MeSH terms