. 2016 Jun 29;11(6):e0158296.
doi: 10.1371/journal.pone.0158296. eCollection 2016.

Integration of Breast Cancer Secretomes with Clinical Data Elucidates Potential Serum Markers for Disease Detection, Diagnosis, and Prognosis

Affiliations

Integration of Breast Cancer Secretomes with Clinical Data Elucidates Potential Serum Markers for Disease Detection, Diagnosis, and Prognosis

Yvonne S Ziegler et al. PLoS One. .

Abstract

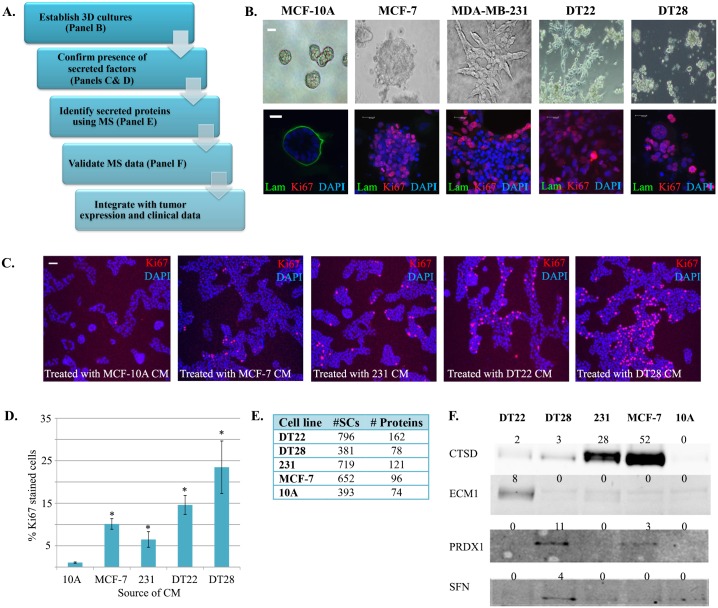
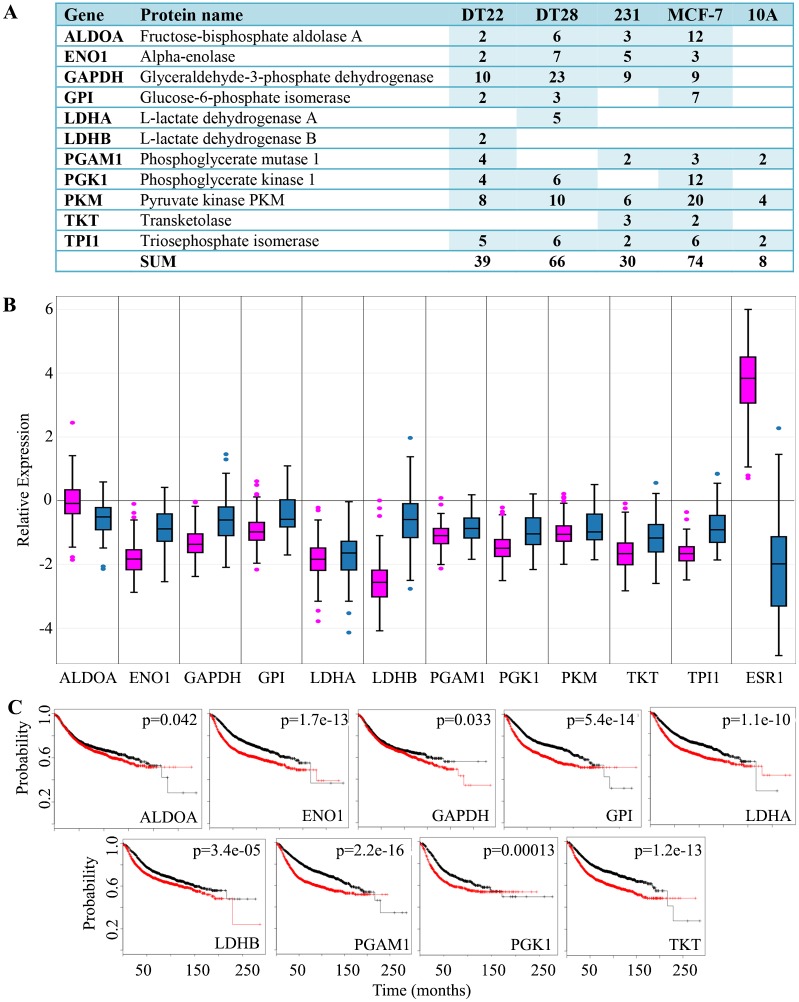
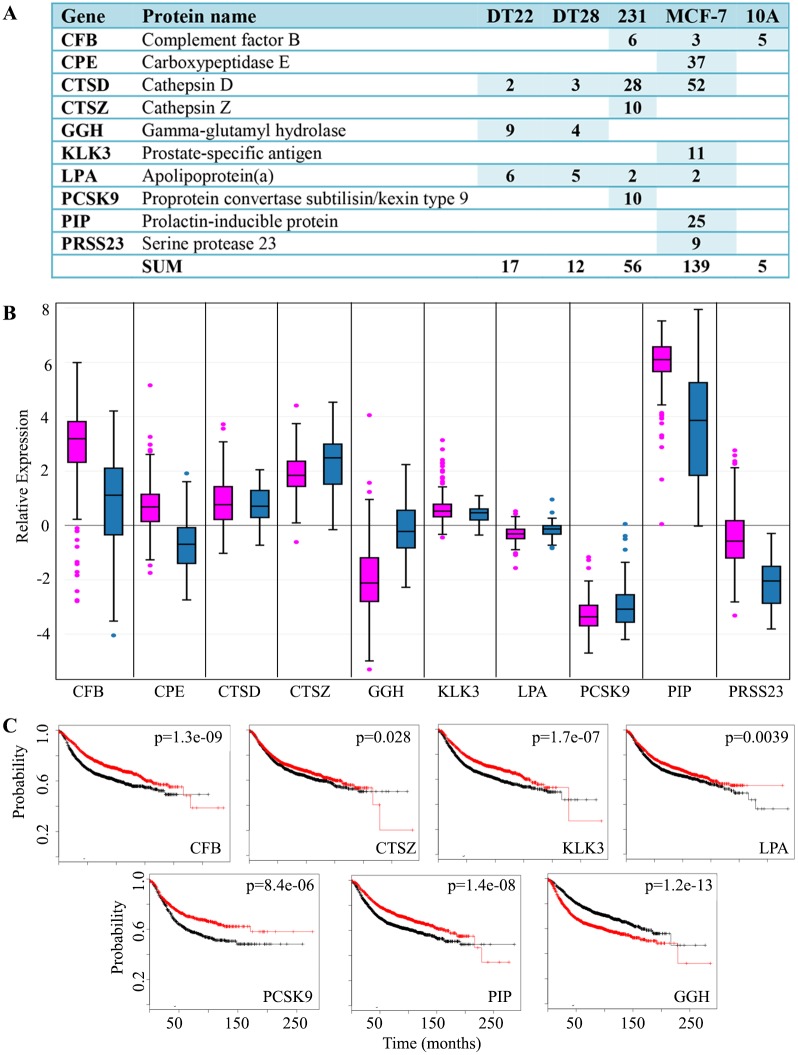
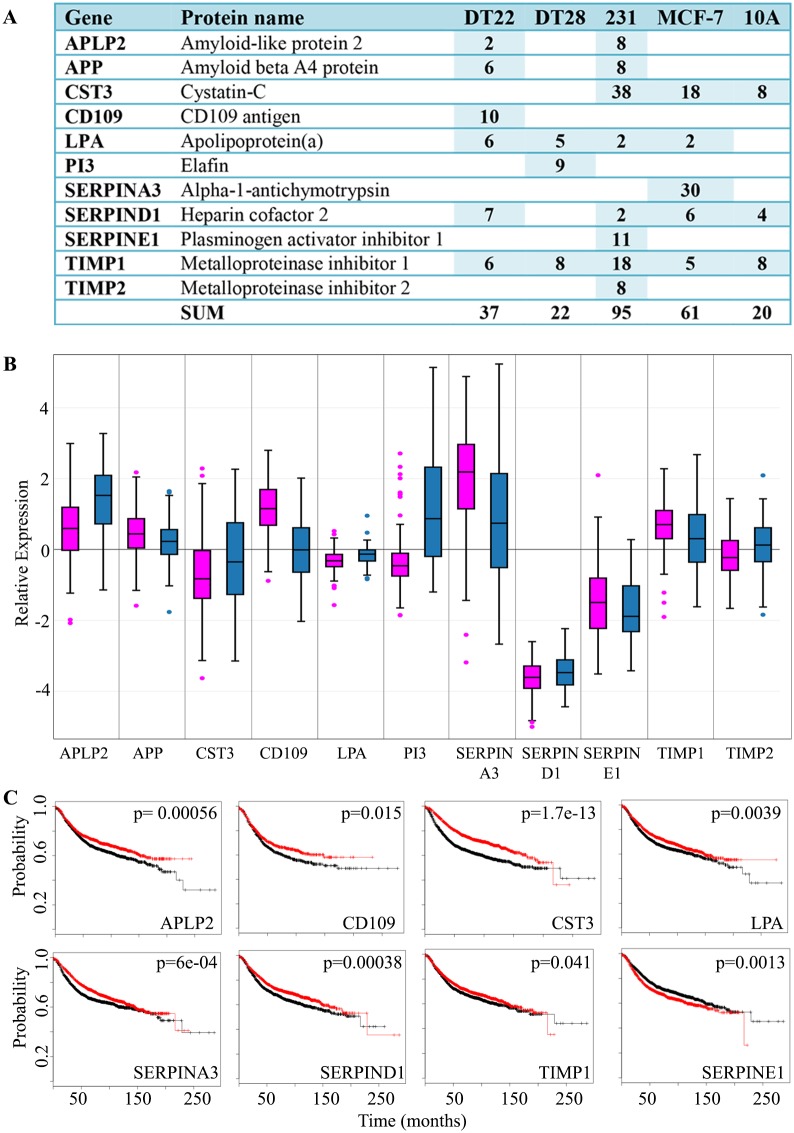
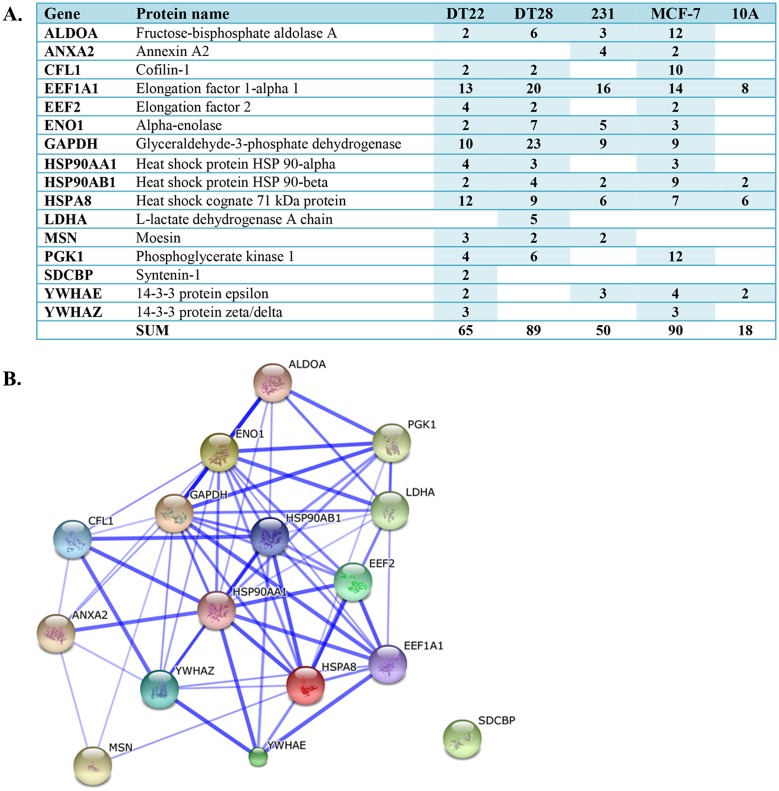
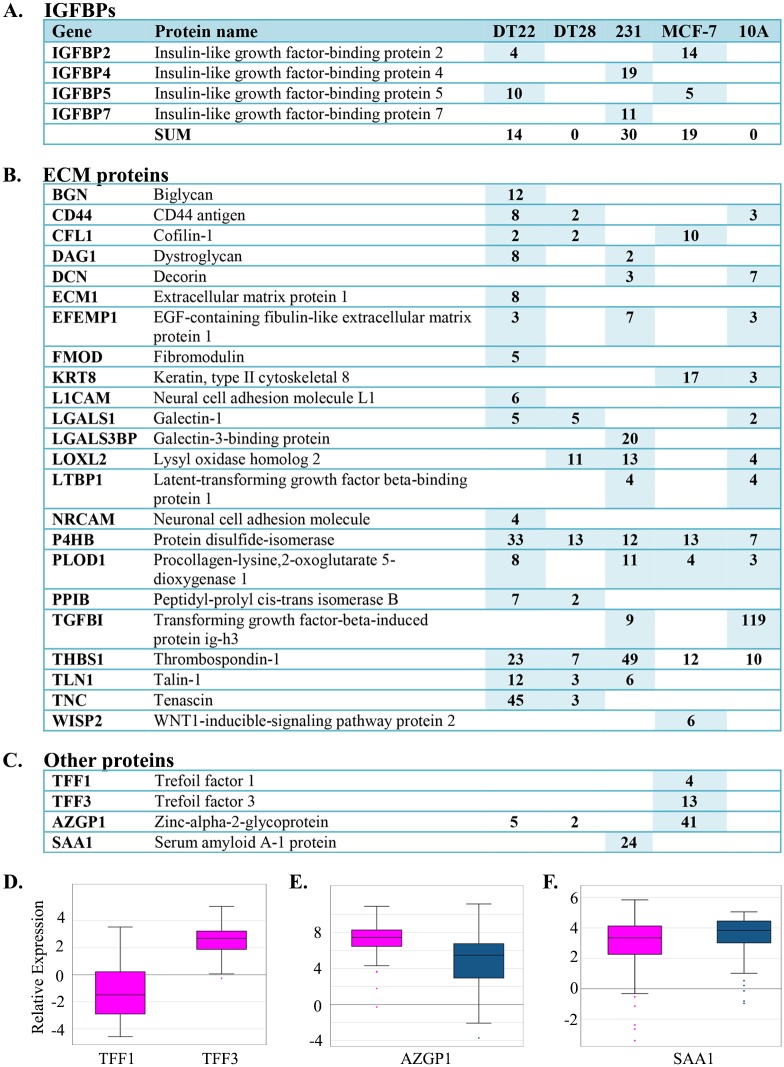
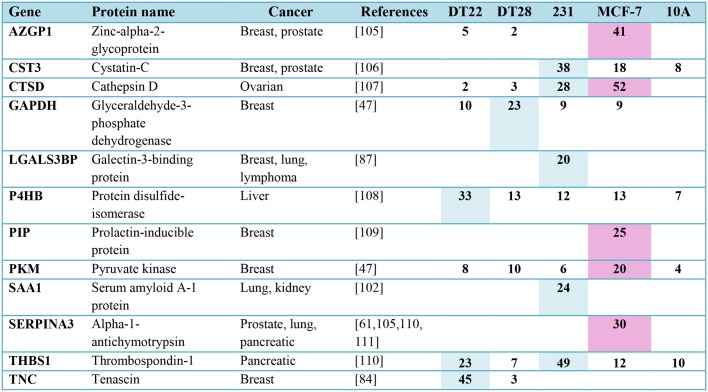
Cancer cells secrete factors that influence adjacent cell behavior and can lead to enhanced proliferation and metastasis. To better understand the role of these factors in oncogenesis and disease progression, estrogen and progesterone receptor positive MCF-7 cells, triple negative breast cancer MDA-MB-231, DT22, and DT28 cells, and MCF-10A non-transformed mammary epithelial cells were grown in 3D cultures. A special emphasis was placed on triple negative breast cancer since these tumors are highly aggressive and no targeted treatments are currently available. The breast cancer cells secreted factors of variable potency that stimulated proliferation of the relatively quiescent MCF-10A cells. The conditioned medium from each cell line was subjected to mass spectrometry analysis and a variety of secreted proteins were identified including glycolytic enzymes, proteases, protease inhibitors, extracellular matrix proteins, and insulin-like growth factor binding proteins. An investigation of the secretome from each cell line yielded clues about strategies used for breast cancer proliferation and metastasis. Some of the proteins we identified may be useful in the development of a serum-based test for breast cancer detection, diagnosis, prognosis, and monitoring.


Conflict of interest statement

Competing Interests: The authors have declared that no competing interests exist.

Figures

Fig 1
Fig 1. Identification of proteins in BC and MCF-10A cell secretomes.
A. A workflow was established to analyze the secretomes of BC and benign mammary epithelial cells. B. Benign (MCF-10A), ERα-positive BC (MCF-7), and TNBC (MDA-MB-231, DT22, and DT28) cells were established in 3D cultures using Matrigel extracellular matrix. Live (top row) and fixed (bottom row) cultures were imaged by phase contrast or immunofluorescence, respectively. Markers of proliferation (Ki67-red), basement membrane (laminin-green), and nuclei (DAPI-blue) were utilized. C. 3D cultures of MCF-10A cells were exposed to CM from MCF-10A, MCF-7, MDA-MB-231, DT22, or DT28 cells. Proliferation (red) and nuclei (blue) are indicated by Ki67 and DAPI staining, respectively. Scale bars indicate 25 μm. D. 3D cultures described in panel C were analyzed to determine the percent of proliferating MCF-10A cells for each treatment. An asterisk (*) indicates a p-value <0.05. E. CM from each cell line was subjected to MS and compiled results are shown. F. CM from 3D cultures of BC and MCF-10A cells were subjected to Western blotting analysis using antibodies to cathepsin D (CTSD), extracellular matrix protein 1 (ECM1), peroxiredoxin 1 (PRDX1), or 14-3-3 sigma (SFN). The number of spectral counts (SCs) is indicated above each lane. To visualize SFN, the CM was concentrated before blotting. MDA-MB-231 and MCF-10A cells are labeled as 231 and 10A, respectively. (Abbreviations: BC = breast cancer, TNBC = triple negative breast cancer, 3D = three dimensional, CM = conditioned medium, MS = mass spectroscopy)
Fig 2
Fig 2. Glycolytic enzymes detected in the CM of BC and MCF-10A cells.
A. The number of SCs identified in the CM of each cell line is indicated. A blank cell indicates that no SCs were detected. Both the HUGO gene symbol and Uniprot recommended protein name are provided. MDA-MB-231 and MCF-10A cells are labeled as 231 and 10A, respectively. NSAF data can be found in S3 Table. B. BC gene expression data was extracted from TCGA and boxplots were created for luminal A (pink) and TNBC (blue) tumors. ERα (ESR1) was included for comparison. Expression values are log2 normalized, tumor matched normal, with normal mammary tissue expression set to 0. C. Kaplan-Meier survival curves for human BC patients were created for 9 of the glycolytic enzymes secreted by BC cells in 3D cultures. The x axis represents the months of recurrence-free survival. Red and black curves indicate higher and lower expression, respectively. The p-value for each result is shown in the upper right quadrant. (Abbreviations: CM = conditioned medium, BC = breast cancer, SC = spectral counts, TCGA = The Cancer Genome Atlas, TNBC = triple negative breast cancer, 3D = three dimensional)
Fig 3
Fig 3. Proteases detected in the CM of BC and MCF-10A cells.
A. The number of SCs identified in the CM of each cell line is indicated. MDA-MB-231 and MCF-10A cells are labeled as 231 and 10A, respectively. NSAF data can be found in S3 Table. B. BC gene expression data was extracted from TCGA and boxplots were created for luminal A (pink) and TNBC (blue) tumors. Expression values are log2 normalized, tumor matched normal, with normal mammary tissue expression set to 0. C. Kaplan-Meier survival curves for human BC patients were created. The x axis represents the months of recurrence-free survival. Red and black curves indicate higher and lower expression, respectively. The p-value for each result is shown in the upper right quadrant. (Abbreviations: CM = conditioned medium, BC = breast cancer, SC = spectral counts, TCGA = The Cancer Genome Atlas, TNBC = triple negative breast cancer)
Fig 4
Fig 4. Protease inhibitors detected in the CM of BC and MCF-10A cells.
A. The number of SCs identified in the CM of each cell line is indicated. MDA-MB-231 and MCF-10A cells are labeled as 231 and 10A, respectively. NSAF data can be found in S3 Table. B. BC gene expression data was extracted from TCGA and boxplots were created for luminal A (pink) and TNBC (blue) tumors. Expression values are log2 normalized, tumor matched normal, with normal mammary tissue expression set to 0. C. Kaplan-Meier survival curves for human BC patients were created. The x axis represents the months of recurrence-free survival. Red and black curves indicate higher and lower expression, respectively. The p-value for each result is shown in the upper right quadrant. (Abbreviations: CM = conditioned medium, BC = breast cancer, SC = spectral counts, TCGA = The Cancer Genome Atlas, TNBC = triple negative breast cancer)
Fig 5
Fig 5. Putative exosomal proteins detected in the CM of BC and MCF-10A cells.
A. The number of SCs identified in the CM of each cell line is indicated. MDA-MB-231 and MCF-10A cells are labeled as 231 and 10A, respectively. NSAF data can be found in S3 Table. B. STRING analysis illustrates the numerous complex interactions possible among the putative exosomal proteins. Thicker lines reflect a higher confidence score. (Abbreviations: CM = conditioned medium, BC = breast cancer, SC = spectral counts)
Fig 6
Fig 6. IGFBPs, ECM proteins, and other proteins detected in the CM of BC and MCF-10A cells.
A-C. The number of SCs identified in the CM of each cell line is indicated. MDA-MB-231 and MCF-10A cells are labeled as 231 and 10A, respectively. NSAF data can be found in S3 Table. D. BC gene expression data was extracted from TCGA and boxplots were created for luminal A (pink) and TNBC (blue) tumors. Expression values are log2 normalized, tumor matched normal, with normal mammary tissue expression set to 0. (Abbreviations: CM = conditioned medium, BC = breast cancer, SC = spectral counts, TCGA = The Cancer Genome Atlas, TNBC = triple negative breast cancer)
Fig 7
Fig 7. Secreted proteins identified in the CM of BC cell lines (≥ 20 SCs) have been detected in the serum of cancer patients.
Higher secretion levels by ERα-positive (pink) and TNBC (blue) cell lines are indicated. NSAF data can be found in S3 Table. (Abbreviations: CM = conditioned medium, BC = breast cancer, SC = spectral counts, TNBC = triple negative breast cancer) [–111]

Similar articles

Cited by

References

    1. DeSantis CE, Fedewa SA, Goding Sauer A, Kramer JL, Smith RA, Jemal A. Breast cancer statistics, 2015: Convergence of incidence rates between black and white women. CA Cancer J Clin. 2016;66: 31–42. 10.3322/caac.21320 - DOI - PubMed
    1. Siegel RL, Miller KD, Jemal A. Cancer statistics, 2015. CA Cancer J Clin. 2015;65: 5–29. 10.3322/caac.21254 - DOI - PubMed
    1. Torre LA, Bray F, Siegel RL, Ferlay J, Lortet-Tieulent J, Jemal A. Global cancer statistics, 2012. CA Cancer J Clin. 2015;65: 87–108. 10.3322/caac.21262 - DOI - PubMed
    1. Stark A, Kleer CG, Martin I, Awuah B, Nsiah-Asare A, Takyi V, et al. African ancestry and higher prevalence of triple-negative breast cancer: findings from an international study. Cancer. 2010;116: 4926–4932. 10.1002/cncr.25276 - DOI - PMC - PubMed
    1. Dunn BK, Agurs-Collins T, Browne D, Lubet R, Johnson KA. Health disparities in breast cancer: biology meets socioeconomic status. Breast Cancer Res Treat. 2010;121: 281–292. 10.1007/s10549-010-0827-x - DOI - PubMed

Substances