

Strain Differences in Light-Induced Retinopathy
- PMID: 27355622
- PMCID: PMC4927188
- DOI: 10.1371/journal.pone.0158082
Strain Differences in Light-Induced Retinopathy
Abstract
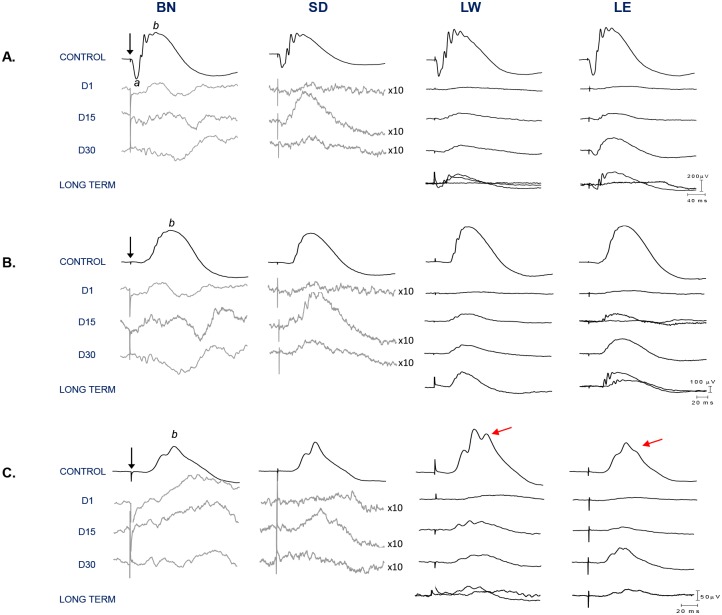
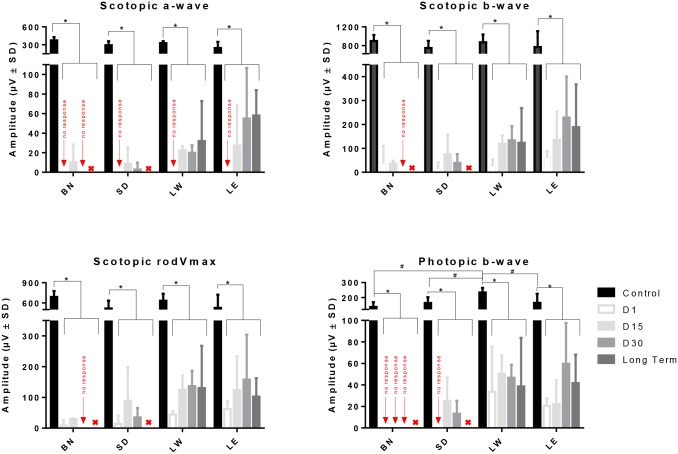
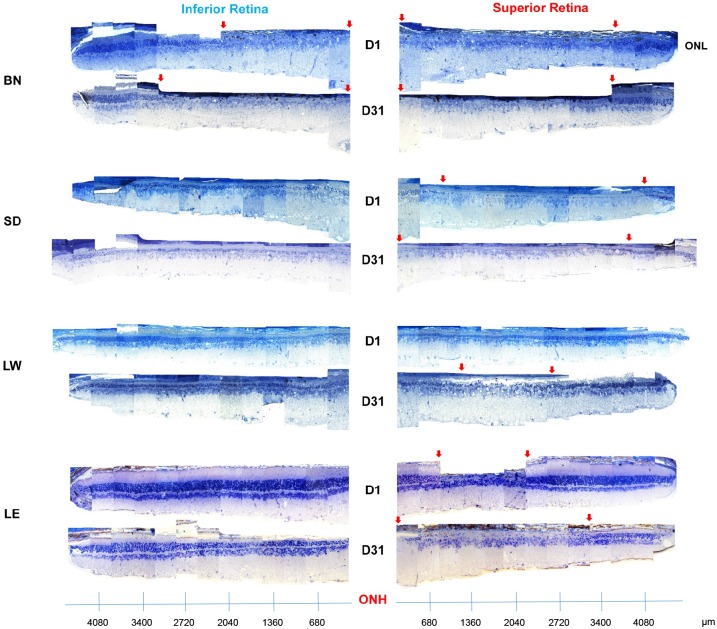
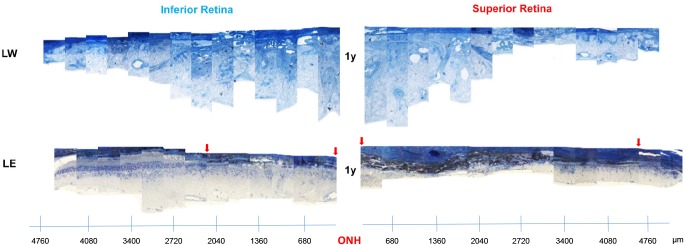
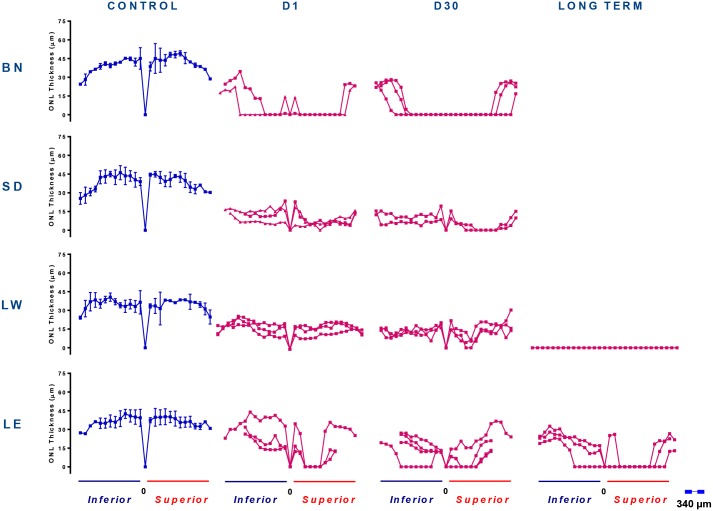
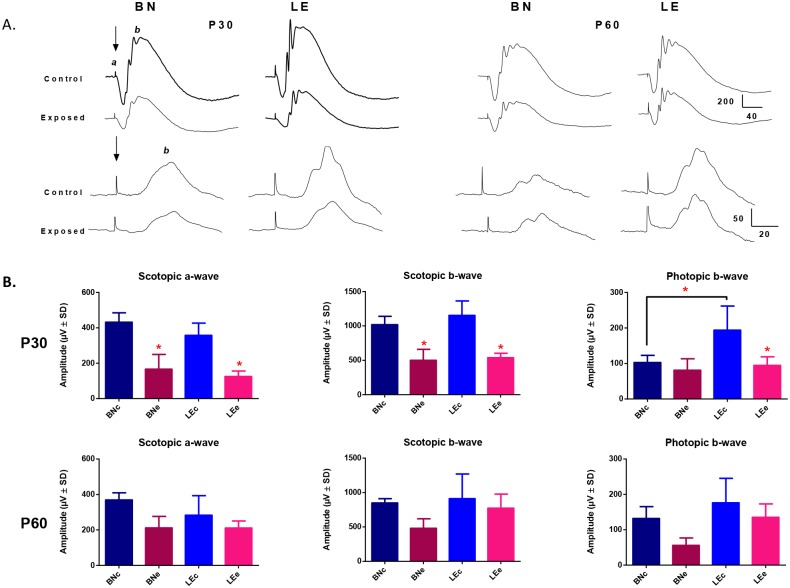
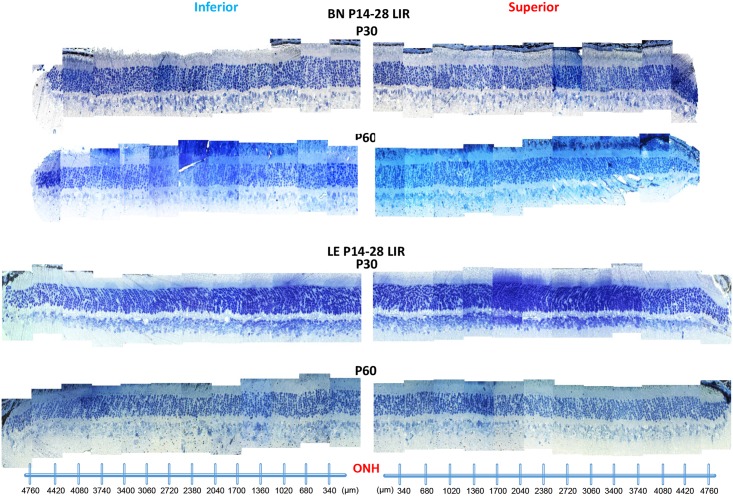
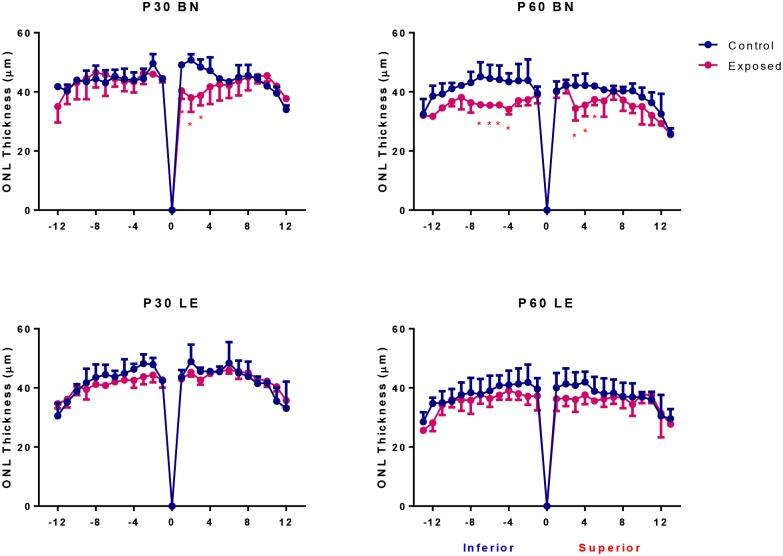
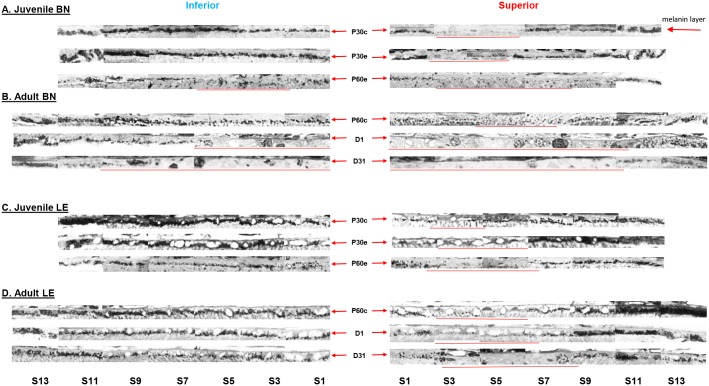
The purpose of this study was to better understand the role of ocular pigmentation and genetics in light-induced retinal damage. Adult pigmented [Long Evans (LE) and Brown Norway (BN)] and albino [Sprague Dawley (SD) and Lewis (LW)] rats were exposed to a bright cyclic light for 6 consecutive days and where compared with juvenile animals exposed to the same bright light environment from postnatal age 14 to 28. Flash ERGs and retinal histology were performed at predetermined days (D) post-light exposure. At D1, ERGs were similar in all adult groups with no recordable a-waves and residual b-waves. A transient recovery was noticed at D30 in the LW and LE only [b-wave: 18% and 25% of their original amplitude respectively]. Histology revealed that BN retina was the most damaged, while LE retina was best preserved. SD and LW rats were almost as damaged as BN rats. In contrast, the retina of juvenile BN was almost as resistant to the bright light exposure as that of juvenile LE rats. Our results strongly suggest that, although ocular pigmentation and genetic background are important factors in regulating the severity of light-induced retinal damage, the age of the animal at the onset of light exposure appears to be the most important determining factor.
Conflict of interest statement
Figures
Similar articles
-
Light-Induced Retinopathy: Young Age Protects more than Ocular Pigmentation.Curr Eye Res. 2017 Jun;42(6):924-935. doi: 10.1080/02713683.2016.1255336. Epub 2017 Jan 31. Curr Eye Res. 2017. PMID: 28139159
-
Pigmented and albino rats differ in their responses to moderate, acute and reversible intraocular pressure elevation.Doc Ophthalmol. 2017 Jun;134(3):205-219. doi: 10.1007/s10633-017-9586-x. Epub 2017 Apr 7. Doc Ophthalmol. 2017. PMID: 28389912 Free PMC article.
-
Functional and structural changes resulting from strain differences in the rat model of oxygen-induced retinopathy.Invest Ophthalmol Vis Sci. 2009 May;50(5):2436-50. doi: 10.1167/iovs.08-2297. Epub 2009 Jan 24. Invest Ophthalmol Vis Sci. 2009. PMID: 19168901
-
Light-induced retinopathy: comparing adult and juvenile rats.Invest Ophthalmol Vis Sci. 2006 Jul;47(7):3202-12. doi: 10.1167/iovs.05-1515. Invest Ophthalmol Vis Sci. 2006. PMID: 16799068
-
Melanin protects choroidal blood vessels against light toxicity.Z Naturforsch C J Biosci. 2006 May-Jun;61(5-6):427-33. doi: 10.1515/znc-2006-5-620. Z Naturforsch C J Biosci. 2006. PMID: 16869503
Cited by
-
Structural and Functional Change in Albino Rat Retina Induced by Various Visible Light Wavelengths.Int J Mol Sci. 2021 Dec 28;23(1):309. doi: 10.3390/ijms23010309. Int J Mol Sci. 2021. PMID: 35008736 Free PMC article.
-
ERG and Behavioral CFF in Light-Damaged Albino Rats.Int J Mol Sci. 2022 Apr 8;23(8):4127. doi: 10.3390/ijms23084127. Int J Mol Sci. 2022. PMID: 35456959 Free PMC article.
-
Anesthetic effects on electrophysiological responses across the visual pathway.Sci Rep. 2024 Nov 13;14(1):27825. doi: 10.1038/s41598-024-79240-2. Sci Rep. 2024. PMID: 39537872 Free PMC article.
-
Retinal Protection from LED-Backlit Screen Lights by Short Wavelength Absorption Filters.Cells. 2021 Nov 19;10(11):3248. doi: 10.3390/cells10113248. Cells. 2021. PMID: 34831470 Free PMC article.
-
Distinct Nuclear Architecture of Photoreceptors and Light-Induced Behaviors in Different Strains of Mice.Transl Vis Sci Technol. 2021 Feb 5;10(2):37. doi: 10.1167/tvst.10.2.37. Transl Vis Sci Technol. 2021. PMID: 34003922 Free PMC article.
References
-
- Noell WK, Walker VS, Kang BS, Berman S. Retinal damage by light in rats. Invest. Ophthalmol. Vis Sci. 1966;5:450–473. - PubMed
-
- Lavail MM. Eye pigmentation and constant light damage in the rat retina Williams et al. (eds), The effects of constant light on visual processes. Plenum Press, New York: 1980;357–387.
-
- Wascowicz M, Morice C, Ferrari P, Callebert J, Versaux-Botteri C. Long-term effects of light damage on the retina of albino and pigmented rats. Invest Ophthalmol Vis Sci. 2002;43:813–820. - PubMed
-
- LaVail MM, Gorrin GM, Repaci MA, Thomas LA, Ginsberg HM. Genetic regulation of light damage to photoreceptors. Invest. Ophthalmol. Vis. Sci. 1987; July;28(7):1043–8. - PubMed
MeSH terms
Substances
LinkOut - more resources
Full Text Sources
Other Literature Sources
Medical
