Comparative Study
. 2016 Jun 30:6:28952.
doi: 10.1038/srep28952.

Transcriptome comparison reveals a genetic network regulating the lower temperature limit in fish

Affiliations
Comparative Study

Transcriptome comparison reveals a genetic network regulating the lower temperature limit in fish

Peng Hu et al. Sci Rep. .

Abstract

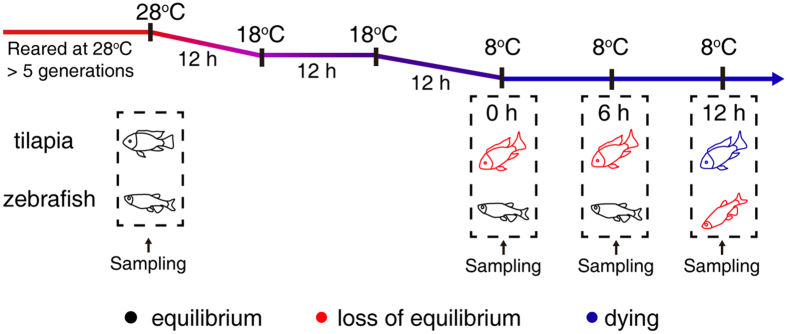
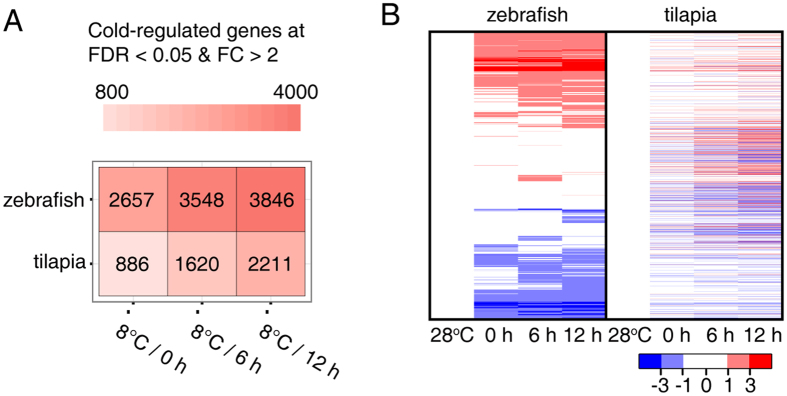
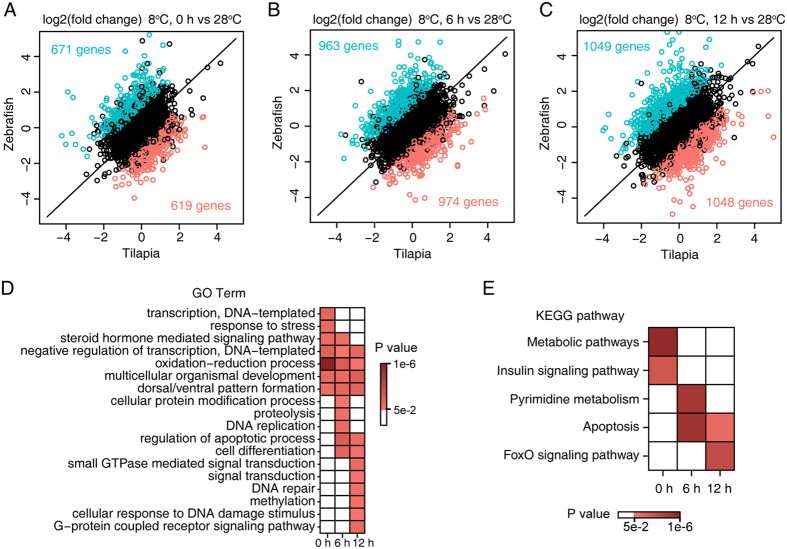
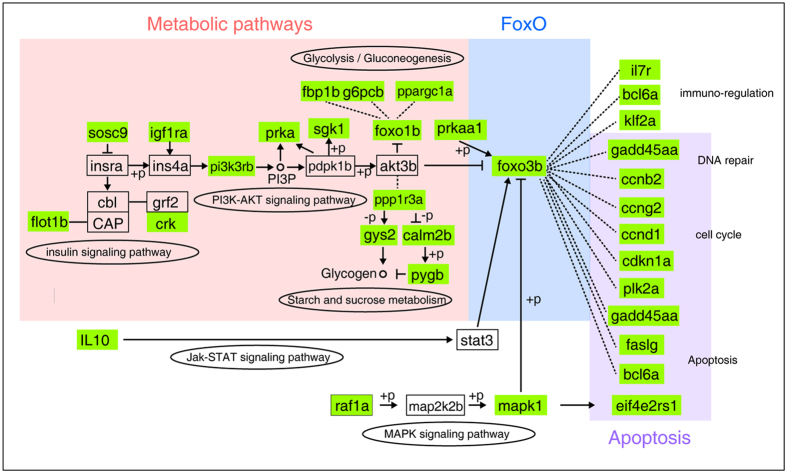
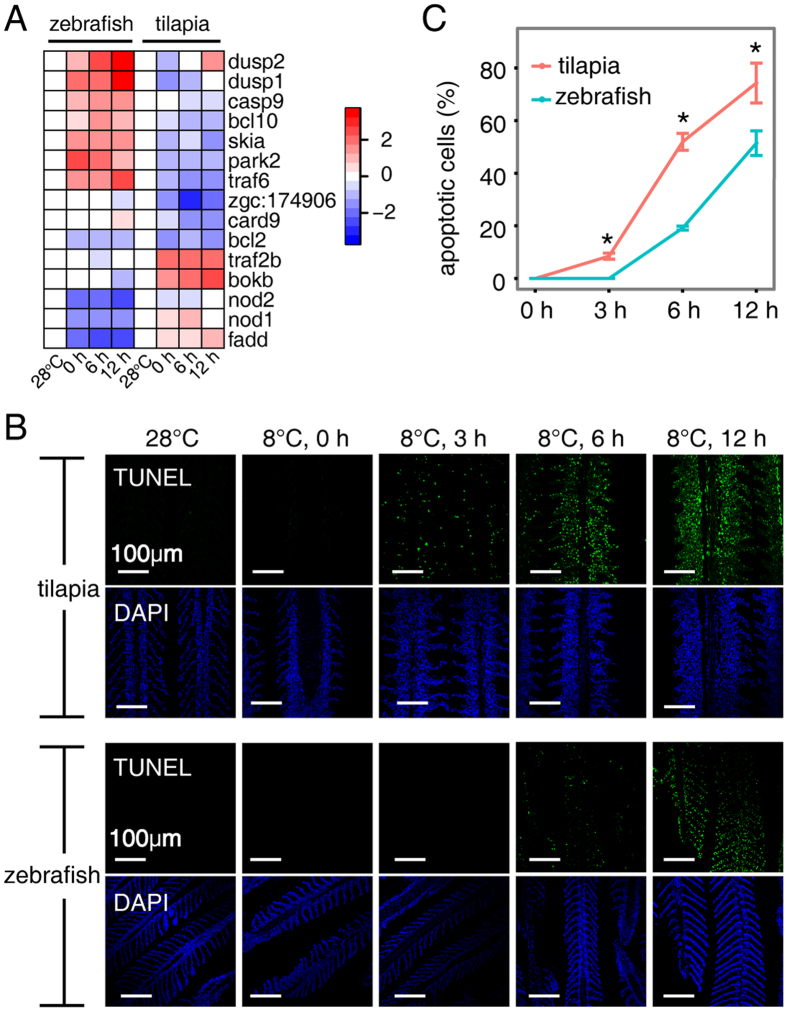
Transcriptional plasticity is a major driver of phenotypic differences between species. The lower temperature limit (LTL), namely the lower end of survival temperature, is an important trait delimiting the geographical distribution of a species, however, the genetic mechanisms are poorly understood. We investigated the inter-species transcriptional diversification in cold responses between zebrafish Danio rerio and tilapia Oreochromis niloticus, which were reared at a common temperature (28 °C) but have distinct LTLs. We identified significant expressional divergence between the two species in the orthologous genes from gills when the temperature cooled to the LTL of tilapia (8 °C). Five KEGG pathways were found sequentially over-represented in the zebrafish/tilapia divergently expressed genes in the duration (12 hour) of 8 °C exposure, forming a signaling cascade from metabolic regulation to apoptosis via FoxO signaling. Consistently, we found differential progression of apoptosis in the gills of the two species in which zebrafish manifested a delayed and milder apoptotic phenotype than tilapia, corresponding with a lower LTL of zebrafish. We identified diverged expression in 25 apoptosis-related transcription factors between the two species which forms an interacting network with diverged factors involving the FoxO signaling and metabolic regulation. We propose a genetic network which regulates LTL in fishes.


Figures

Figure 1
Figure 1. The changes in the body equilibrium of tilapia and zebrafish over time at 8 °C.
Tilapia immediately lost body equilibrium when water temperature declined to 8 °C, whereas zebrafish maintained body equilibrium for the first 12 h at 8 °C. Twelve hours after loss of equilibrium, tilapia died, whereas zebrafish began to show equilibrium loss. The different body postures are indicated by different colors: black for normal equilibrium, red for loss of equilibrium, and blue for death. The sampling points are indicated by the arrows.
Figure 2
Figure 2. Global overview of differentially expressed genes at cold temperature in zebrafish and tilapia gills.
(A) The differentially expressed genes at three time points of 8 °C exposure identified by comparing with the 28 °C control fishes. (B) Clustered profiling of 3,174 differentially one-to-one orthologous genes in zebrafish (left panel) and tilapia (right panel) based on comparisons between orthologous gene pairs. Log2 transformation of gene fold induction is indicated by the color-coded scales.
Figure 3
Figure 3. Divergent gene expression between zebrafish and tilapia in the LTL of tilapia.
1,290, 1,937 and 2,097 genes zebrafish/tilapia divergently expressed genes were identified at 0 h (A), 6 h (B) and 12 h (C), respectively. Green and red dots represent genes that are expressed in higher levels in zebrafish and tilapia respectively. (D,E) Heat map showing the enriched GO categories (D) and the KEGG pathways (E) identified from the zebrafish/tilapia divergently expressed genes at the three time points. The color scales depict the P values for the enrichment test, and cells in grey indicate a P value of >0.05.
Figure 4
Figure 4. The relationship of the over-represented KEGG pathways inferred from regulatory networking of the essential factors of these pathways based on the established FoxO signaling pathway.
The zebrafish/tilapia divergently expressed genes were highlighted by blue color. The three pathways identified as over-represented in Fig. 3B were shadowed.
Figure 5
Figure 5. Inter-specific divergence in apoptosis.
(A) Hierarchical clustering of zebrafish/tilapia divergently expressed genes contained in the GO term “regulation of apoptotic process”. Log2 transformation of gene fold change is indicated by the color-coded scale. (B) TUNEL assays in the gills of two fishes, indicating an earlier onset and more aggravated apoptosis in tilapia than in zebrafish at the same cold temperature. The nucleus was counterstained with DAPI. Scale bar is 100 μm. (C) Increased apoptotic cell populations in the gills of tilapia and zebrafish over time at 8 °C. Significant differences between the two fishes are indicated by an asterisk (Student’s t test, P < 0.05) and are based on at least three biological replicates, with each replicate having at least 3 individuals at each time point.
Figure 6
Figure 6. Regulatory networks showing the inter-specific divergence in cis- and trans- regulation of apoptosis.
(A) Hierarchical clustering of 25 zebrafish/tilapia divergently expressed transcription factors that were apoptosis-related. (B) Protein-protein interaction network for zebrafish/tilapia differently expressed and TFBS-enriched transcription factors in the metabolism, FoxO and apoptosis pathways. Quadrate nodes denote the transcription factors whose binding sites were enriched in the promoter of zebrafish/tilapia divergently expressed genes. The pathways to which the enriched transcription factors belong were indicated by different colors, with pink for metabolic pathways, red for apoptosis, and green for FoxO signaling pathway. The circles with black border represent the zebrafish/tilapia divergently expressed apoptosis-related genes, while circle without the black border indicates an intermediate protein of the network, in which significantly expressional divergence between zebrafish and tilapia was not detected in this study. Protein-protein interaction information was retrieved from the literature using GeneMANIA. The types of protein-protein interactions are represented by different types of lines, with the solid lines representing the physical interactions, parallel lines representing co-localization and dots representing genetic interactions. According to definitions in GeneMANIA, “Physical interaction” refers to an experimentally validated protein-protein interaction, and “Co-localization” refers to two proteins that co-localize in the cell. “Genetic interaction” indicates that the effects of one gene are modified by another gene identified through mutation analysis.

Similar articles

Cited by

References

    1. Carroll S. B. Evo-devo and an expanding evolutionary synthesis: a genetic theory of morphological evolution. Cell 134, 25–36 (2008). - PubMed
    1. Hoekstra H. E. & Coyne J. A. The locus of evolution: evo devo and the genetics of adaptation. Evolution 61, 995–1016 (2007). - PubMed
    1. Romero I. G., Ruvinsky I. & Gilad Y. Comparative studies of gene expression and the evolution of gene regulation. Nat. Rev. Genet. 13, 505–516 (2012). - PMC - PubMed
    1. Cossins A. R. & Crawford D. L. Fish as models for environmental genomics. Nat. Rev. Genet. 6, 324–333 (2005). - PubMed
    1. Donaldson M. R., Cooke S. J., Patterson D. A. & Macdonald J. S. Cold shock and fish. J. Fish Biol. 73, 1491–1530, 10.1111/j.1095-8649.2008.02061.x (2008). - DOI

Publication types