. 2016 Aug 26;90(18):8059-73.
doi: 10.1128/JVI.00553-16. Print 2016 Sep 15.

Establishment and Reversal of HIV-1 Latency in Naive and Central Memory CD4+ T Cells In Vitro

Affiliations

Establishment and Reversal of HIV-1 Latency in Naive and Central Memory CD4+ T Cells In Vitro

Jennifer M Zerbato et al. J Virol. .

Abstract

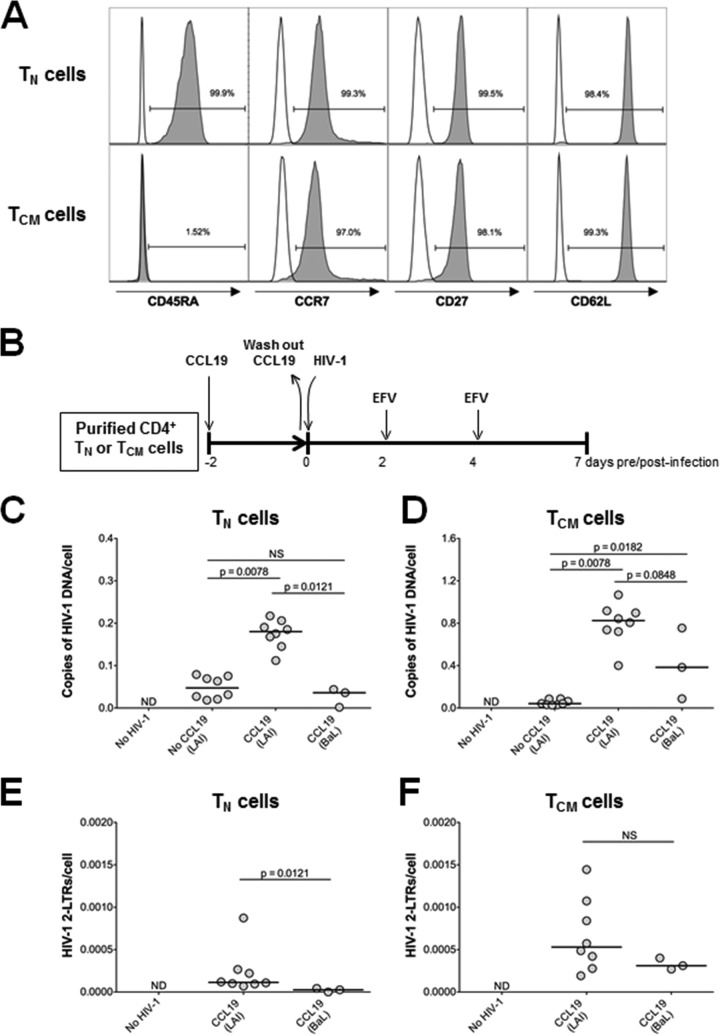
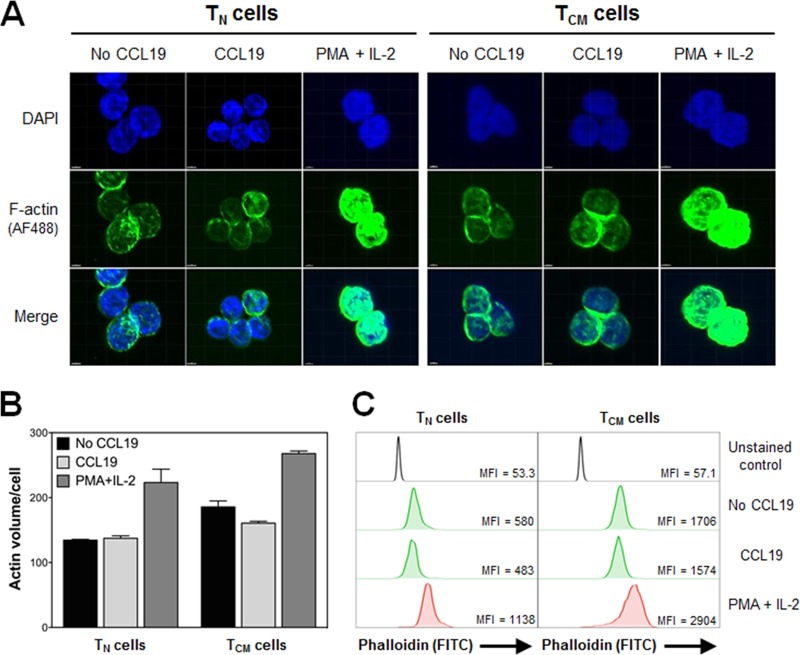
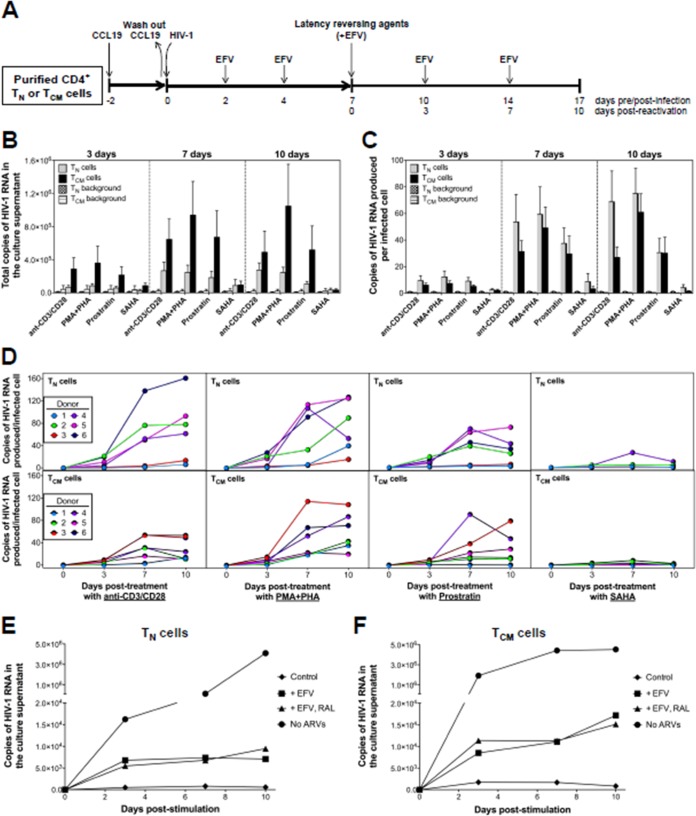
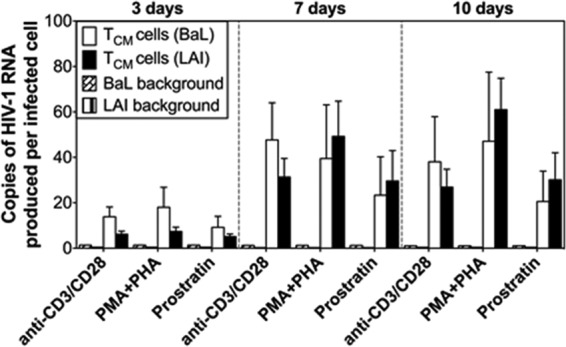
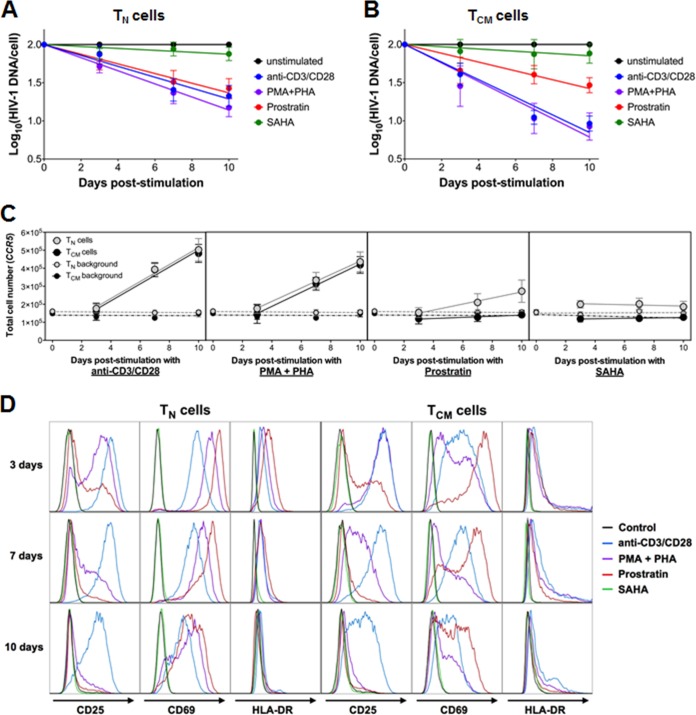
The latent HIV-1 reservoir primarily resides in resting CD4(+) T cells which are a heterogeneous population composed of both naive (TN) and memory cells. In HIV-1-infected individuals, viral DNA has been detected in both naive and memory CD4(+) T cell subsets although the frequency of HIV-1 DNA is typically higher in memory cells, particularly in the central memory (TCM) cell subset. TN and TCM cells are distinct cell populations distinguished by many phenotypic and physiological differences. In this study, we used a primary cell model of HIV-1 latency that utilizes direct infection of highly purified TN and TCM cells to address differences in the establishment and reversal of HIV-1 latency. Consistent with what is seen in vivo, we found that HIV-1 infected TN cells less efficiently than TCM cells. However, when the infected TN cells were treated with latency-reversing agents, including anti-CD3/CD28 antibodies, phorbol myristate acetate/phytohemagglutinin, and prostratin, as much (if not more) extracellular virion-associated HIV-1 RNA was produced per infected TN cell as per infected TCM cell. There were no major differences in the genomic distribution of HIV-1 integration sites between TN and TCM cells that accounted for these observed differences. We observed decay of the latent HIV-1 cells in both T cell subsets after exposure to each of the latency-reversing agents. Collectively, these data highlight significant differences in the establishment and reversal of HIV-1 latency in TN and TCM CD4(+) T cells and suggest that each subset should be independently studied in preclinical and clinical studies.

Importance: The latent HIV-1 reservoir is frequently described as residing within resting memory CD4(+) T cells. This is largely due to the consistent finding that memory CD4(+) T cells, specifically the central (TCM) and transitional memory compartments, harbor the highest levels of HIV-1 DNA in individuals on suppressive therapy. This has yielded little research into the contribution of CD4(+) naive T (TN) cells to the latent reservoir. In this study, we show that although TN cells harbor significantly lower levels of HIV-1 DNA, following latency reversal, they produced as many virions as did the TCM cells (if not more virions). This suggests that latently infected TN cells may be a major source of virus following treatment interruption or failure. These findings highlight the need for a better understanding of the establishment and reversal of HIV-1 latency in TN cells in evaluating therapeutic approaches to eliminate the latent reservoir.


Figures

FIG 1
FIG 1
Infection of TN and TCM cells by CXCR4-tropic (HIV-1LAI) and CCR5-tropic (HIV-1BaL) HIV-1 in the absence and presence of CCL19. (A) TN and TCM cells were purified from resting CD4+ T cells based on the variable cell surface expression of CD45RA, CCR7, CD27, and CD62L. TN cells were defined as CD45RA+ CCR7+ CD27+ CD62L+. TCM cells were defined as CD45RA CCR7+ CD27+ CD62L+. The purity of each subset was determined by surface expression of each marker as measured by flow cytometry. Representative histograms from one donor are shown. (B) Schematic representation of the experimental approach. (C) Quantification of total HIV-1 DNA in TN cells at 7 days postinfection. (D) Quantification of total HIV-1 DNA in TCM cells at 7 days postinfection. (E) Quantification of HIV-1 2-LTR circles in TN cells at 7 days postinfection. (F) Quantification of HIV-1 2-LTR circles in TCM cells at 7 days postinfection. For graphs in panels C to F, each dot represents a unique donor, and data are normalized to cell number. ND, not detected; NS, not significant. P values for results in HIV-1LAI-infected cells with and without CCL19 were calculated using a Wilcoxon matched-pairs signed-rank test. P values between HIV-1LAI and HIV-1BaL results were calculated using a Mann-Whitney test.
FIG 2
FIG 2
CCL19 treatment does not alter the expression of HIV-1 coreceptor expression on primary CD4+ TN or TCM cells. (A) Percent expression of CCR5 or CXCR4 on TN or TCM cells 2 days following treatment with CCL19 or anti-CD3/CD28 antibodies as determined by antibody staining and flow cytometry. Untreated cells were used as a control. (B) CCR5 and CXCR4 surface density as assessed by mean fluorescence intensity under the same conditions as described for panel A. No significant differences in the number of cells expressing CCR5 or CXCR4 or density of expression were noted between control cells or cells treated with CCL19 (statistics not shown; n = 5).
FIG 3
FIG 3
T cell activation, proliferation, and cell viability of purified CD4+ TN and TCM cells. (A) T cell activation markers CD25, CD69, and HLA-DR were assessed by antibody staining and flow cytometry on TN and TCM cells following purification (day −2), CCL19-treatment (day 0), and HIV-1LAI infection (day 7, left) and on uninfected cells (day 7, right). Data are presented as the means ± standard errors of the means (n = 7). (B) Cellular proliferation of unstimulated cells was measured by qPCR of the CCR5 gene throughout the time course of the experiment. Data are presented as the means ± standard errors of the means (n = 6). (C) Intracellular staining and flow cytometry for Ki-67. Data are presented as the means ± standard errors of the means (n = 2 performed in duplicate). (D) Cell viability was measured by Live/Dead staining and flow cytometry in freshly isolated, TN and TCM cells, in cells with and without CCL19 treatment for 2 days, and in cells with and without HIV-1 infection after 7 days, as indicated. Data are presented as the means ± TN and TCM cells (n = 3 performed in duplicate).
FIG 4
FIG 4
Inhibition of F-actin polymerization blocks HIV-1 infection of total resting CD4+ T cells in a dose-dependent manner. (A) Schematic representation of the experimental approach. (B) Cells were treated with different concentrations of Lat-A for 6 h, followed by treatment with CCL19 for an additional 2 days. F-actin was stained with phalloidin and measured by flow cytometry. Cells stimulated with PMA plus IL-2 were used as a positive control. (C) Following the same experimental conditions as in described for panel B, cell viability was assessed by flow cytometry using Live/Dead staining. Untreated cells were used as a negative control, and cells heated at 56°C for 1 h prior to staining were used as a dead cell control. (D) F-actin density and HIV-1 infection of resting CD4+ T cells are plotted. Following the experimental approach shown in panel A, HIV-1 infection was measured at 7 days postinfection by quantification of total intracellular HIV-1 DNA, normalized to cell number. HIV-1 DNA and F-actin density were normalized to treatment with CCL19 only. Data shown for panels B to D are representative of two independent experiments and, error bars represent standard deviations. MFI, mean fluorescence intensity.
FIG 5
FIG 5
CCL19 does not have an effect on F-actin density in TN or TCM cells. (A) Representative confocal microscopy images of TN and TCM cells in the absence or presence of CCL19 or PMA plus IL-2 for 2 days. Phalloidin and DAPI were used to stain F-actin and nuclei, respectively. (B) Total F-actin volume was quantified in TN and TCM cells from confocal microscopy images using Imaris software. (C) Flow cytometric analysis of F-actin density was measured by phalloidin staining in TN or TCM cells under the same conditions as described for panel A. Data are representative of three independent experiments. MFI, mean fluorescence intensity.
FIG 6
FIG 6
Reversal of HIV-1 latency in CD4+ TN and TCM cells infected with HIV-1LAI following treatment with LRAs. (A) Schematic representation of the experimental approach. (B) Total copies of extracellular virion-associated HIV-1LAI RNA produced from TN or TCM cells after exposure to anti-CD3/CD28 antibodies, PMA-PHA, prostratin, or SAHA. Background HIV-1 RNA from unstimulated controls at each time point is also shown. Data are the means ± the standard errors of the means from 6 donors. (C) Copies of extracellular virion-associated HIV-1LAI RNA produced per infected TN or TCM cell after exposure to anti-CD3/CD28 antibodies, PMA-PHA, prostratin, or SAHA, normalized to the level of infection at each respective time point. Background HIV-1 RNA from unstimulated controls is shown. Data are shown as the means ± standard errors of the means from 6 donors. (D) Copies of extracellular vRNA produced per infected TN or TCM cell after exposure to anti-CD3/CD28 antibodies from 6 donors. The contribution of unintegrated HIV-1LAI DNA to the total vRNA copy number after exposure of infected TN cells (E) or TCM cells (F) with anti-CD3/CD28 antibodies was determined with or without EFV only or EFV-RAL treatment throughout the experiment. Unstimulated cells treated with EFV only were used as a control. Cells stimulated in the absence of any antiretroviral drugs were used as a positive control. Data are representative of two independent experiments.
FIG 7
FIG 7
Reversal of HIV-1 latency in CD4+ TCM cells infected with HIV-1BaL following treatment with LRAs. The experimental approach was the same here as shown in Fig. 5A. The number of copies of extracellular virion-associated HIV-1BaL RNA produced per infected TCM cell after exposure to anti-CD3/CD28 antibodies, PMA-PHA, or prostratin, normalized to the level of infection at each respective time point, is shown. Background HIV-1 RNA from unstimulated controls at each time point is shown. Data are shown as the means ± standard errors of the means from 3 donors. For comparative purposes, data for HIV-1LAI RNA from infected TCM cells (Fig. 6C) are included.
FIG 8
FIG 8
Decay of HIV-1LAI-infected cells and T cell activation posttreatment of latently infected CD4+ TN and TCM cells. Decay of HIV-1LAI-infected TN (A) or TCM (B) cells was measured over 10 days of treatment with anti-CD3/CD28 antibodies, PMA-PHA, prostratin, or SAHA. Total intracellular HIV-1 DNA was quantified as described in the legend of Fig. 1. Data are presented as the means ± standard errors of the means from 6 donors (except for the SAHA data, where n = 4). (C) Cellular proliferation of TN and TCM cells was measured by qPCR of the CCR5 gene following stimulation with anti-CD3/CD28 antibodies, PMA-PHA, prostratin, or SAHA. Background samples represent unstimulated CD4+ TN and TCM cells. Data are presented as the means ± standard errors of the means (n = 6, except for SAHA data, where n = 4). (D) T cell activation was measured by antibody staining and flow cytometry of the surface expression of CD25, CD69, and HLA-DR on TN or TCM cells at 3, 7, and 10 days after treatment with anti-CD3/CD28 antibodies, PMA-PHA, prostratin, or SAHA. Untreated cells were used as a negative control. Data are representative of two independent experiments.

Similar articles

Cited by

References

    1. Chun TW, Engel D, Berrey MM, Shea T, Corey L, Fauci AS. 1998. Early establishment of a pool of latently infected, resting CD4+ T cells during primary HIV-1 infection. Proc Natl Acad Sci U S A 95:8869–8873. doi: 10.1073/pnas.95.15.8869. - DOI - PMC - PubMed
    1. Schacker T, Little S, Connick E, Gebhard K, Zhang ZQ, Krieger J, Pryor J, Havlir D, Wong JK, Schooley RT, Richman D, Corey L, Haase AT. 2001. Productive infection of T cells in lymphoid tissues during primary and early human immunodeficiency virus infection. J Infect Dis 183:555–562. doi: 10.1086/318524. - DOI - PubMed
    1. Schacker T, Little S, Connick E, Gebhard-Mitchell K, Zhang ZQ, Krieger J, Pryor J, Havlir D, Wong JK, Richman D, Corey L, Haase AT. 2000. Rapid accumulation of human immunodeficiency virus (HIV) in lymphatic tissue reservoirs during acute and early HIV infection: implications for timing of antiretroviral therapy. J Infect Dis 181:354–357. doi: 10.1086/315178. - DOI - PubMed
    1. Archin NM, Vaidya NK, Kuruc JD, Liberty AL, Wiegand A, Kearney MF, Cohen MS, Coffin JM, Bosch RJ, Gay CL, Eron JJ, Margolis DM, Perelson AS. 2012. Immediate antiviral therapy appears to restrict resting CD4+ cell HIV-1 infection without accelerating the decay of latent infection. Proc Natl Acad Sci U S A 109:9523–9528. doi: 10.1073/pnas.1120248109. - DOI - PMC - PubMed
    1. Whitney JB, Hill AL, Sanisetty S, Penaloza-MacMaster P, Liu J, Shetty M, Parenteau L, Cabral C, Shields J, Blackmore S, Smith JY, Brinkman AL, Peter LE, Mathew SI, Smith KM, Borducchi EN, Rosenbloom DI, Lewis MG, Hattersley J, Li B, Hesselgesser J, Geleziunas R, Robb ML, Kim JH, Michael NL, Barouch DH. 2014. Rapid seeding of the viral reservoir prior to SIV viraemia in rhesus monkeys. Nature 512:74–77. doi: 10.1038/nature13594. - DOI - PMC - PubMed

Publication types

LinkOut - more resources