. 2016 Jun 30:6:29072.
doi: 10.1038/srep29072.

Expansion of amphibian intronless interferons revises the paradigm for interferon evolution and functional diversity

Affiliations

Expansion of amphibian intronless interferons revises the paradigm for interferon evolution and functional diversity

Yongming Sang et al. Sci Rep. .

Abstract

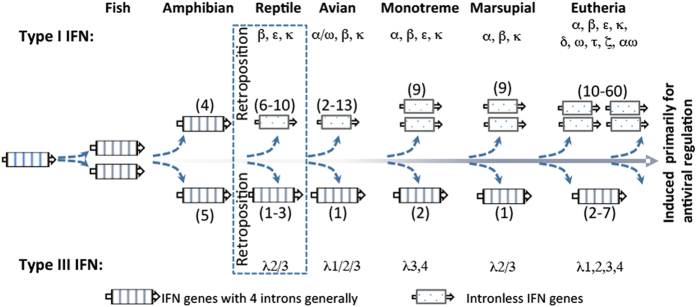
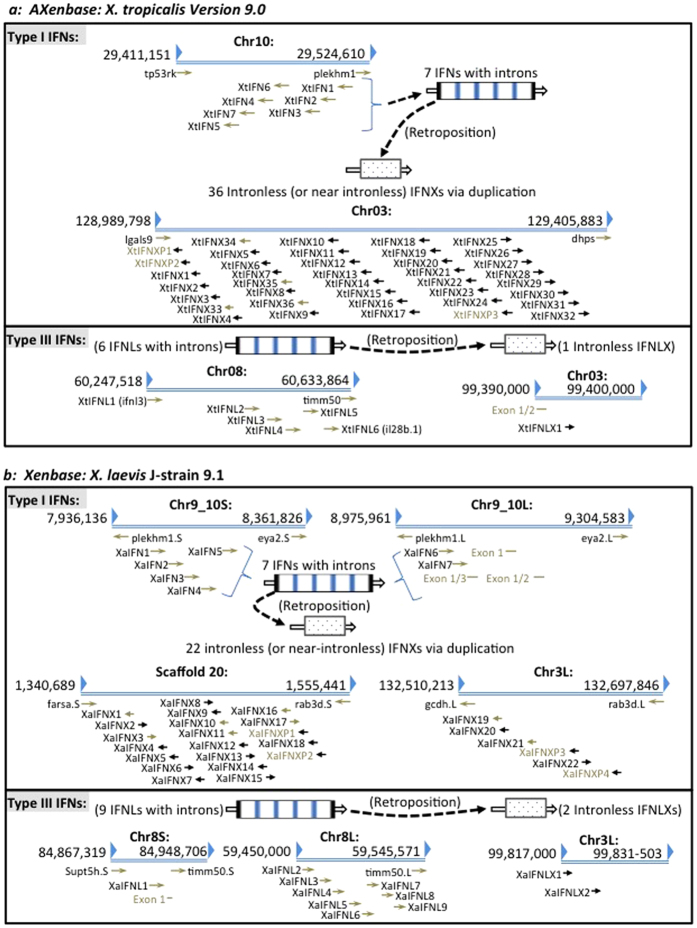
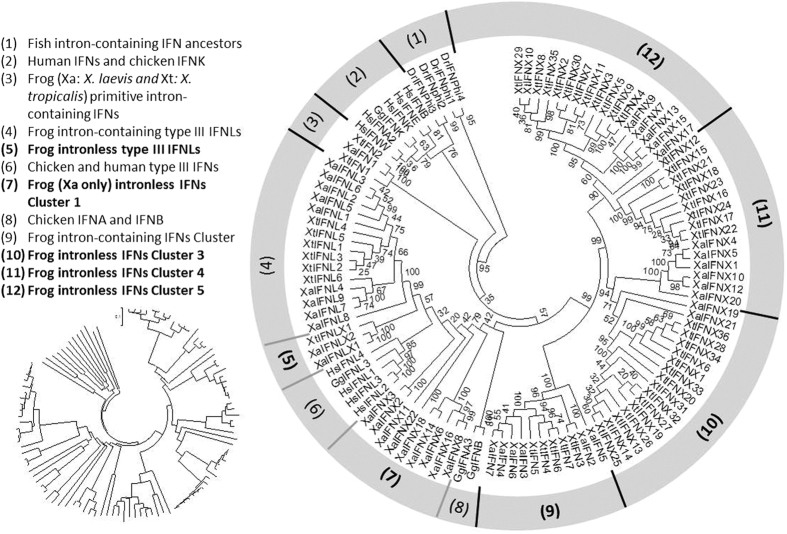
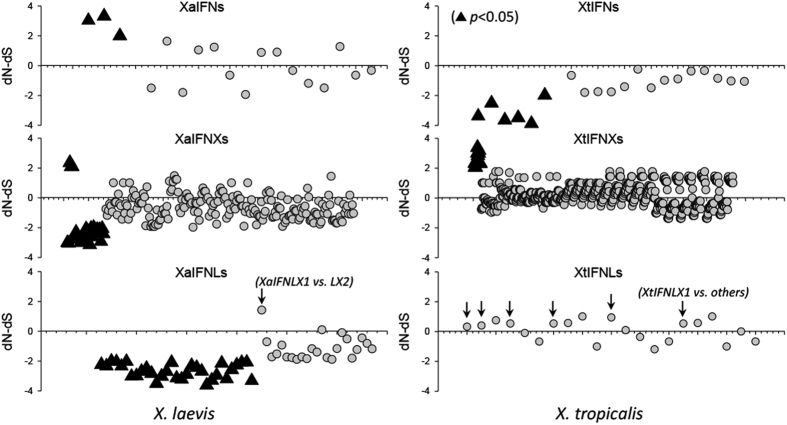
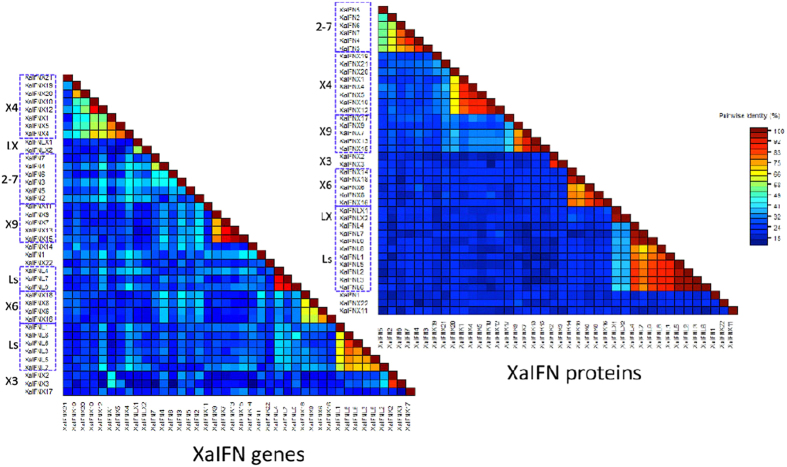
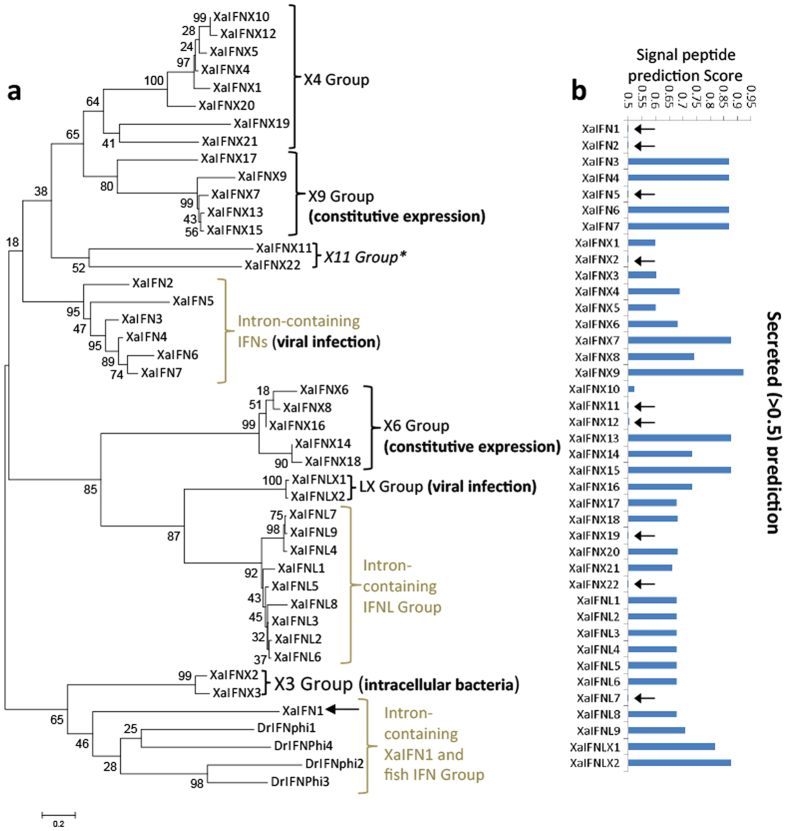
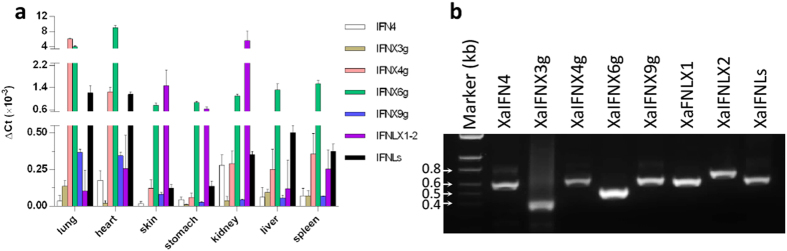
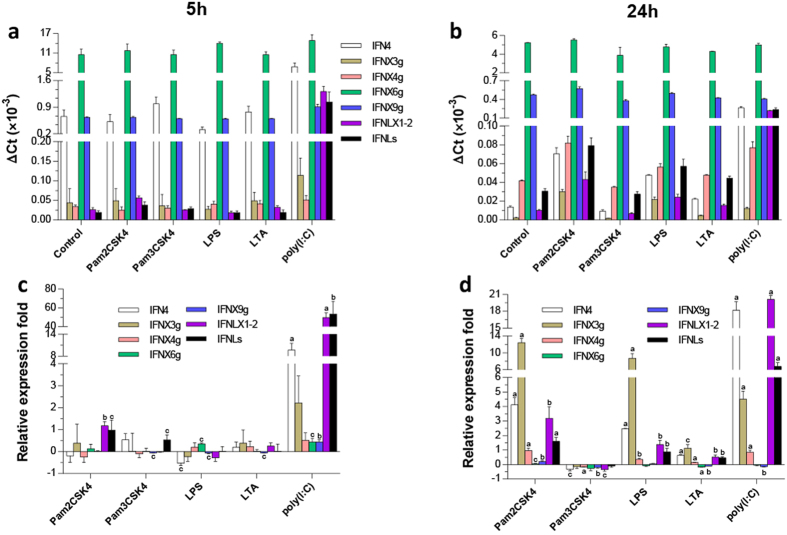
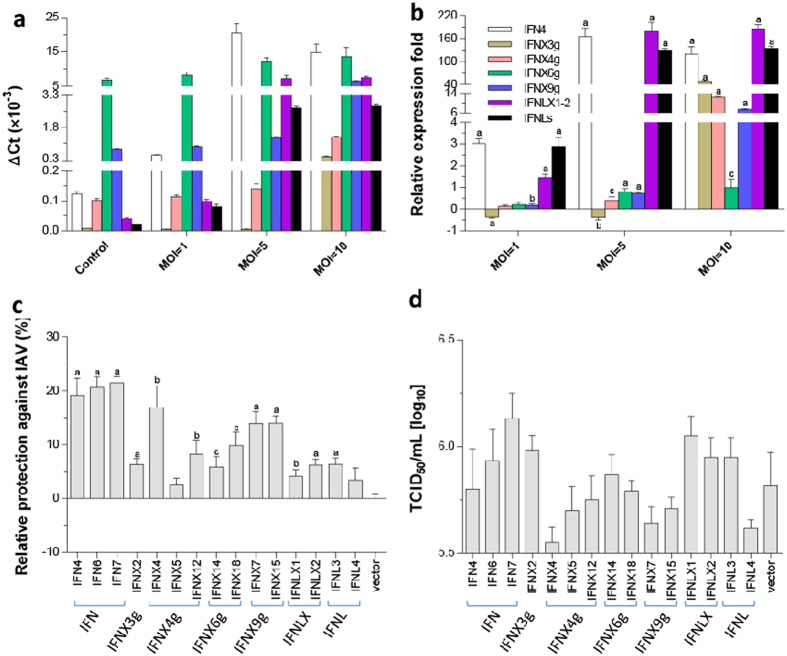
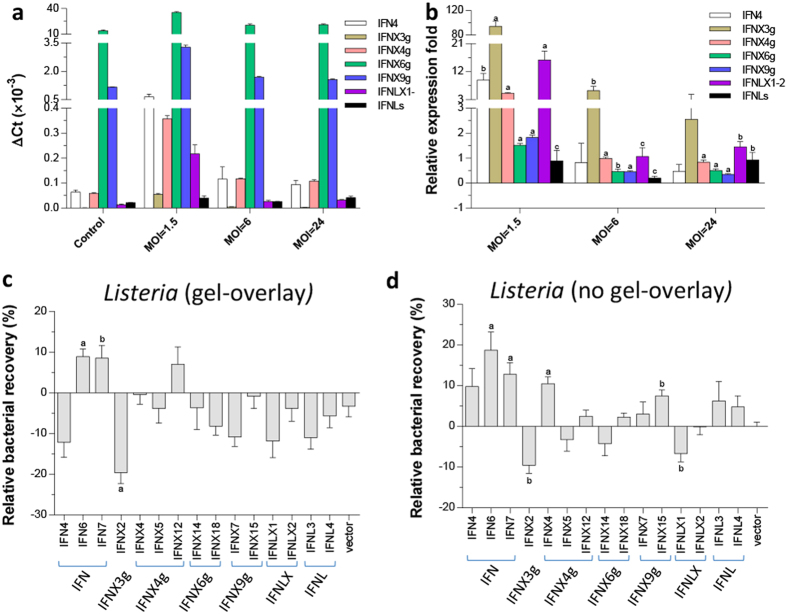
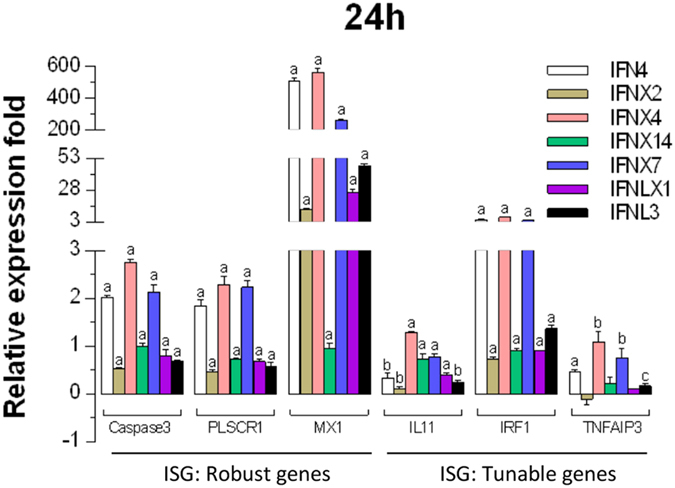
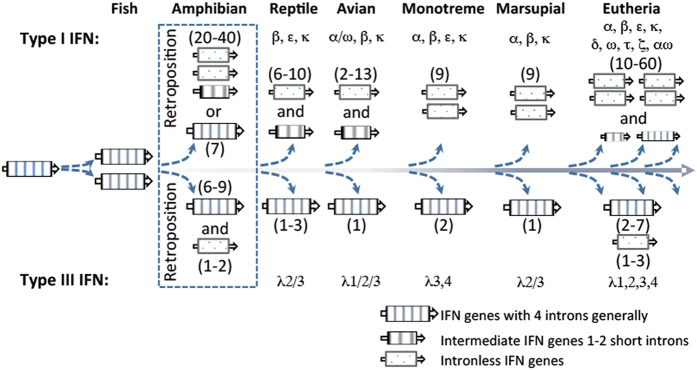
Interferons (IFNs) are key cytokines identified in vertebrates and evolutionary dominance of intronless IFN genes in amniotes is a signature event in IFN evolution. For the first time, we show that the emergence and expansion of intronless IFN genes is evident in amphibians, shown by 24-37 intronless IFN genes in each frog species. Amphibian IFNs represent a molecular complex more complicated than those in other vertebrate species, which revises the established model of IFN evolution to facilitate re-inspection of IFN molecular and functional diversity. We identified these intronless amphibian IFNs and their intron-containing progenitors, and functionally characterized constitutive and inductive expression and antimicrobial roles in infections caused by zoonotic pathogens, such as influenza viruses and Listeria monocytogenes. Amphibians, therefore, may serve as overlooked vectors/hosts for zoonotic pathogens, and the amphibian IFN system provides a model to study IFN evolution in molecular and functional diversity in coping with dramatic environmental changes during terrestrial adaption.


Figures

Figure 1
Figure 1. Previous model proposed for the evolution of type I and type III IFNs in vertebrates.
In this model, intronless type I IFNs were suggested to first appear in reptiles and diversify linearly in amniotes thereafter. Conversely, type III IFNs maintain highly conserved intron-containing gene structures and family numbers throughout vertebrates.
Figure 2
Figure 2. Schematic of types I and III IFN gene loci in amphibians.
Schematic distribution of intron-containing and intronless type I and type III IFN genes in chromosomes (or scaffold) in (a) X. tropicalis, and (b) X. laevis. The IFN genes were annotated based on three genome assemblies: X. tropicalis (Silurana) at NCBI (http://www.ncbi.nlm.nih.gov/genome/80, submitted by the DOE Joint Genome Institute), X. tropicalis 9.0 genome (Nigerian) and X. leaves J-strain 9.1 at Xenbase (http://www.xenbase.org/). Some IFN genes and genes bordering IFN loci were identified by automated prediction at Xenbase. The potential retroposition event leading to the emergence of intronless IFNs was depicted to indicate the origin of intronless IFNs from its intron-containing progenitors in amphibians. IFN and IFNX, intron-containing and intronless type I IFNs; IFNL and IFNLX, intron-containing and intronless type III IFNs, respectively.
Figure 3
Figure 3. Evolutionary relationships of the IFN complex in X. laevis (XaIFNs) and X. tropicalis (XtIFNs), and comparison with homologs from zebrafish (DrIFNs), chicken (GgIFNs) and humans (HsIFNs).
The evolutionary history was inferred using the Neighbor-Joining method. Percentage of replicate trees in which the associated taxa clustered together in the bootstrap test (1000 replicates) is shown next to the branches. The tree is drawn to scale, with branch lengths in the same units as those of the evolutionary distances used to infer the phylogenetic tree. The evolutionary distances were computed using the p-distance method and are in units of the number of amino acid differences per site. Evolutionary analyses were conducted in MEGA632. The 12 clades/clusters of IFNs, including primarily 5 Clusters of intronless IFNs in amphibians, are listed on the left, and shown with bootstrap values in the main topological tree. The inlet phylogenetic tree at the bottom reflects the relative distance of each leaf. IFN and IFNX, intron-containing and intronless type I IFNs; IFNL and IFNLX, intron-containing and intronless type III IFNs, respectively. IFN taxa used: IFNA, IFNB, IFNE, IFNK, IFNL, and IFNW correspond to genes for IFN-α, IFN-β, IFN-ε, IFN-κ, IFN-λ, and IFN-ω, respectively, in classic nomenclature, and stand for relevant IFN protein precursors here.
Figure 4
Figure 4. Codon-based test of neutrality for analysis between sequences of amphibian IFN coding regions.
The dS and dN are numbers of synonymous and nonsynonymous substitutions per site, respectively. Probabilities of rejecting the null hypothesis of strict-neutrality (dN = dS, middle zero lines) is shown. Values of p less than 0.05 are considered significant at the 5% level and are highlighted (black triangles). The test statistic (dN–dS) is shown on Y-axis. Symbols below the dN = dS line are considered in negative selection (or purifying selection) and above the zero lines, positive selection. Analyses were conducted using the Nei-Gojobori method and evolutionary analyses were conducted in MEGA632. Results suggest that an eventual functional transition occurred from the coexisting intron-containing IFNs to the newly emerged and more effective intronless antiviral IFNs in amphibians, showing that significant positive selections occurred in both intron-containing (left top) and intronless (left middle) type I IFNs in X. laevis, but only were detected in intronless IFNX genes in X. tropicalis (right middle). In addition, most cases of positive selection were detected between the sequence pairs containing one or two intronless type III IFNs (indicated by arrows in the bottom two plots, and Supplemental Excel sheet 4). IFN and IFNX, intron-containing and intronless type I IFNs; IFNL and IFNLX, intron-containing and intronless type III IFNs, respectively.
Figure 5
Figure 5. Pairwise identity (%) plots among protein (top right) and gene (bottom left) sequences of IFNs in X. laevis.
Comparison and plot drawing were performed using a SDT program. Molecular subgroups of IFN complex in X. laevis were clustered based on sequence identity, in particular protein sequences, which generally show >60% pairwise identity among sequences within each subgroup. Note that gene sequences containing tentative 5′-promoter and 3′-untranslated regions (UTR) have more rapid diversification (bottom left), indicating further divergence pertinent to epigenetic regulation than only genetic coding. IFN and IFNX, intron-containing and intronless type I IFNs; IFNL and IFNLX, intron-containing and intronless type III IFNs, respectively.
Figure 6
Figure 6. Categorization of IFN genes based on regulatory elements predicted in their proximal promoter regions.
Regulatory elements (and pertinent binding factors) in the ~1 kb proximal promoter regions were examined against both human and animal TFD Database using a Nsite program (Version 5.2013, at http://www.softberry.com). Shown here are IFNs in X. laevis, whose promoters contain at least one IFN- or virus-stimulated response elements (ISRE, PRDI, and/or STAT1/3 factors). Other subgroups of IFN genes, whose promoters do not contain these IFN or virus regulatory elements, and a spreadsheet of all predicted regulatory elements (and relevant binding factors) are listed in the Supplemental Excel Sheet 6. Legend: ○, containing such as GATA-1 regulating constitutive expression; ◊, containing IFN-stimulated response element (ISRE) and PRDI to interact with IRF, ISGF3 and STAT factors; □, containing cis-elements interacting with factors to mediate immune/inflammatory responses including C/EBP, NF-kB, NF-IL6, and p53; ●, containing cis-elements reacting with other factors significant in other developmental/physiological responses.
Figure 7
Figure 7. Molecular and functional subgroups of the IFN complex in X. laevis.
(a) Evolutionary analyses were conducted in MEGA6, and the tree was inferred by using the Maximum Likelihood method based on the Poisson correction model. Percentage of trees in which the associated taxa clustered together is shown next to the branches. In addition to the molecular subgroups based on their phylogenetic relationship at the molecular level, we inferred the functional subgroups (bold texts in parenthesis) based on overall examination of their gene and peptide sequences as well as experimental data. (b) Signal peptides of XaIFN precursors were examined using PrediSi (http://www.predisi.de) to determine the secretory potency of relevant IFN mature peptides, indicating the evolution of intracellular IFNs (indicated by arrows, signal peptide prediction score 0–0.5) in each subgroup, particularly of intronless IFNs. IFN and IFNX, intron-containing and intronless type I IFNs; IFNL and IFNLX, intron-containing and intronless type III IFNs, respectively.
Figure 8
Figure 8. Family-wide expression analysis of X. laevis IFN genes (IFNs) in different tissues.
(a) Gene expression was analyzed using a SYBR Green-based real-time RT-PCR assay. Total RNA (100 ng) was used in each 20 μl of PCR reaction. Ct values of genes were normalized against Ct values of a housekeeping gene (beta-actin) amplified from the same RNA samples to obtain 2−ΔCt, reflecting expression of each subgroup of IFN genes relative to beta-actin. Data are means ± SE; n = 3 replicates. (b) Representative IFN cDNA was amplified from a pooled RNA sample for cloning purposes. Primers for RT-PCR detection and cloning are listed in Supplemental Excel Sheet 9.
Figure 9
Figure 9
Induced expression analysis of X. laevis IFN genes (IFNs) in a kidney-derived cell line (A6) treated with pathogenic mimics for 5 (a,c) or 24 h (b,d). Gene expression was analyzed using a SYBR Green-based real-time RT-PCR assay. Total RNA (100 ng) was used in each 20 μl of PCR reaction. Ct values of the genes were normalized against Ct values of a housekeeping gene (beta-actin) amplified from the same RNA samples to obtain 2−ΔCt (a,b), which reflect the expression of each subgroup of IFN genes relative to beta-actin; or to normalize for fold changes to control (mock) stimulation (c,d). Data are means ± SE; n = 3 replicates of 2–3 independent assays, *(a–c) p < 0.001, 0.01, and 0.05, respectively, compared to control. Pam2/3CSK4, LTA and LPS are bacterial mimics to act through TLR2/6, TLR2/1, TLR2, and TLR4 pathways, respectively; and poly (I:C) is a mimic of viral dsRNA. Primers for RT-PCR detection and cloning are listed in Supplemental Excel Sheet 9.
Figure 10
Figure 10. Induced expression and antiviral activity of X. laevis IFN genes (IFNs) in amphibian kidney A6 cells.
(a,b) Cells were infected for 48 h by a swine influenza virus (TX98 strain) at the MOI of 1, 5, or 10. Gene expression was analyzed using a SYBR Green-based real-time RT-PCR assay as previously defined. Ct values of the genes were normalized against Ct values of a housekeeping gene (β-actin) amplified from the same RNA samples to obtain −ΔCt (a), which reflect the expression of each subgroup of IFN genes relative to beta-actin; or 2−ΔCt normalized to get fold changes relative to the non-infected control (b). (c) Sequence-confirmed overexpression constructs (in a pcDNA3.3 Topo-mammalian expression vector, Invitrogen) representing each group of X. laevis IFNs were transfected into A6 cells (0.25 μg DNA/well in 96-well culture plates, >60% transfection efficacy). The cells were then infected with the TX98 virus at 5 MOI. The protection of IFNs from the viral infections was then quantified at 2 days post infection using a crystal violet staining procedure. (d) Virus titers in the cells treated with different amphibian IFNs as in (c). The cells were transfected with different amphibian IFNs as described in the (c), then infected with the TX98 virus at a MOI of 5. Culture supernatants were collected for virus titration using an endpoint dilution assay to define 50% tissue culture infective dose (TCID50) in MDCK cells. Data represent results of two independent experiments. Data are means ± SE; n = 3 replicates, (a–c) p < 0.001, 0.01 and 0.05, respectively, compared to control. Primers for RT-PCR detection and cloning are listed in Supplemental Excel Sheet 9.
Figure 11
Figure 11. Induced expression and antibacterial activity of X. laevis IFN genes (IFNs) in amphibian kidney cells (A6).
(a,b) Cells were infected by an intracellular bacterium, L. monocytogenes (ATCC 19115) at 1.5, 6 and 24 MOI. Bacterial infection was performed using an agarose-gel-overlay procedure to limit intracellular infection during the test periods. Gene expression was analyzed using a SYBR Green-based real-time RT-PCR assay as described above. (c,d) Sequence-confirmed overexpression constructs (in a pcDNA3.3 Topo-mammalian expression vector, Invitrogen) representing each groups of X. laevis IFNs were transfected into A6 cells (1.0 μg DNA/well in 24-well cell culture plates, >60% transfection efficacy). Cells were then infected with the bacteria at 1.5 MOI for 1 h, washed and overlaid with the medium containing 0.7% agarose and gentamicin (10 μg/ml) (c), or cultured without gel overlay but with the medium containing gentamicin (d). Bacterial loads from the cell culture were then quantified at 72 h post infection using an alamarBlue bacterial quantification procedure (AbD Serotec). Data are means ± SE; n = 3 replicates, (a–c) p < 0.001, 0.01 and 0.05, respectively, compared to control. Primers for RT-PCR detection and cloning are listed in Supplemental Excel Sheet 9.
Figure 12
Figure 12. Amphibian IFNs induced expression of IFN-stimulated genes (ISGs) in frog cells.
Frog cells at 80% confluence were treated with overexpressed IFN peptides (20 ng/ml) for 24 h. Gene expression was analyzed using a SYBR Green-based real-time RT-PCR assay. Total RNA (100 ng) was used in each 20 μl of PCR reaction. Ct values of the genes were normalized against Ct values of a housekeeping gene (beta-actin) amplified from the same RNA samples to obtain 2−ΔCt, which reflects the expression of each subgroup of IFN genes relative to beta-actin and were further normalized for fold changes to the control (mock). Data are means ± SE; n = 3 replicates of 2–3 independent assays, *(a–c) p < 0.001, 0.01, and 0.05, respectively, compared to control. Abbreviations: IL11, interleukin 11; IRF1, IFN-regulatory factor 1; MX1, an IFN-induced dynamin-like GTPase; PLSCR1, phospholipid scramblase 1; and TNFAIP3, tumor necrosis factor alpha-induced protein 3. Primers for RT-PCR detection and cloning are listed in Supplemental Excel Sheet 9.
Figure 13
Figure 13. Revised model for the evolution of type I and type III IFNs in vertebrates.
This model shows intronless type I IFNs originating and expanding in amphibians with independent diversification in amniotes thereafter. In contrast, the classical IFN evolution model (Fig. 1), depicted a linear increase of IFN complexity from fish to eutherian animals. Discovery of IFN expansion in amphibians highlights two large IFN expansions in both amphibian and eutherian species, which then envisions a non-linear IFN evolution process throughout jawed vertebrates. Conversely, type III IFNs are preeminent for their conserved intron-containing gene structures and family numbers throughout vertebrates. One to several intronless type III IFNs were also identified in amphibians, as well as in many eutherian species. Given the similar antiviral signaling evoked by type I and type III IFNs, it remains unknown why intronless type III IFNs underwent little expansion and even elimination in contrast to the intronless type I IFN genes in most vertebrate species.

References

    1. Ivashkiv L. B. & Donlin L. T. Regulation of type I interferon responses. Nat. Rev. Immunol. 14, 36–49 (2014). - PMC - PubMed
    1. McNab F., Mayer-Barber K., Sher A., Wack A. & O’Garra A. Type I interferons in infectious disease. Nat. Rev. Immunol. 15, 87–103 (2015). - PMC - PubMed
    1. Zitvogel L., Galluzzi L., Kepp O., Smyth M. J. & Kroemer G. Type I interferons in anticancer immunity. Nat. Rev. Immunol. 15, 405–414 (2015). - PubMed
    1. Lazear H. M., Nice T. J. & Diamond M. S. Interferon-λ: Immune functions at barrier surfaces and beyond. Immunity. 43, 15–28 (2015). - PMC - PubMed
    1. Wack A., Terczyńska-Dyla E. & Hartmann R. Guarding the frontiers: the biology of type III interferons. Nat. Immunol. 16, 802–809 (2015). - PMC - PubMed

Publication types

MeSH terms