Xanthine oxidoreductase mediates membrane docking of milk-fat droplets but is not essential for apocrine lipid secretion
- PMID: 27357166
- PMCID: PMC5063925
- DOI: 10.1113/JP272390
Xanthine oxidoreductase mediates membrane docking of milk-fat droplets but is not essential for apocrine lipid secretion
Abstract
Key points: Xanthine oxidoreductase (XOR) modulates milk lipid secretion and lactation initiation. XOR is required for butyrophilin1a1 clustering in the membrane during milk lipid secretion. XOR mediates apical membrane reorganization during milk lipid secretion. Loss of XOR delays milk fat globule secretion. XOR loss alters the proteome of milk fat globules.
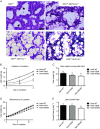
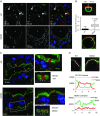
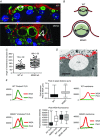
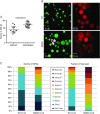
Abstract: Apocrine secretion is utilized by epithelial cells of exocrine glands. These cells bud off membrane-bound particles into the lumen of the gland, losing a portion of the cytoplasm in the secretion product. The lactating mammary gland secretes milk lipid by this mechanism, and xanthine oxidoreductase (XOR) has long been thought to be functionally important. We generated mammary-specific XOR knockout (MGKO) mice, expecting lactation to fail. Histology of the knockout glands showed very large lipid droplets enclosed in the mammary alveolar cells, but milk analysis showed that these large globules were secreted. Butyrophilin, a membrane protein known to bind to XOR, was clustered at the point of contact of the cytoplasmic lipid droplet with the apical plasma membrane, in the wild-type gland but not in the knockout, suggesting that XOR mediates 'docking' to this membrane. Secreted milk fat globules were isolated from mouse milk of wild-type and XOR MGKO dams, and subjected to LC-MS/MS for analysis of protein component. Proteomic results showed that loss of XOR leads to an increase in cytoplasmic, cytoskeletal, Golgi apparatus and lipid metabolism proteins associated with the secreted milk fat globule. Association of XOR with the lipid droplet results in membrane docking and more efficient retention of cytoplasmic components by the secretory cell. Loss of XOR then results in a reversion to a more rudimentary, less efficient, apocrine secretion mechanism, but does not prevent milk fat globule secretion.
Keywords: LC_MS/MS; Xanthine Oxidoreductase; apocrine secretion; lactation; milk fat globule; proteomics.
© 2016 The Authors. The Journal of Physiology © 2016 The Physiological Society.
Figures



Comment in
-
Piggyback packaging in the mammary gland.J Physiol. 2016 Oct 15;594(20):5729-5730. doi: 10.1113/JP272960. J Physiol. 2016. PMID: 27739077 Free PMC article. No abstract available.
Similar articles
-
Functional regulation of xanthine oxidoreductase expression and localization in the mouse mammary gland: evidence of a role in lipid secretion.J Physiol. 2002 Dec 1;545(2):567-79. doi: 10.1113/jphysiol.2002.027185. J Physiol. 2002. PMID: 12456835 Free PMC article.
-
The housekeeping gene xanthine oxidoreductase is necessary for milk fat droplet enveloping and secretion: gene sharing in the lactating mammary gland.Genes Dev. 2002 Dec 15;16(24):3223-35. doi: 10.1101/gad.1032702. Genes Dev. 2002. PMID: 12502743 Free PMC article.
-
The PRY/SPRY/B30.2 domain of butyrophilin 1A1 (BTN1A1) binds to xanthine oxidoreductase: implications for the function of BTN1A1 in the mammary gland and other tissues.J Biol Chem. 2009 Aug 14;284(33):22444-22456. doi: 10.1074/jbc.M109.020446. Epub 2009 Jun 15. J Biol Chem. 2009. PMID: 19531472 Free PMC article.
-
Disorder in milk proteins: adipophilin and TIP47, important constituents of the milk fat globule membrane.J Biomol Struct Dyn. 2020 Mar;38(4):1214-1229. doi: 10.1080/07391102.2019.1592027. Epub 2019 Mar 21. J Biomol Struct Dyn. 2020. PMID: 30896308 Review.
-
Regulation of milk lipid formation and secretion in the mouse mammary gland.Adv Exp Med Biol. 2004;554:263-79. doi: 10.1007/978-1-4757-4242-8_22. Adv Exp Med Biol. 2004. PMID: 15384582 Review.
Cited by
-
Symposium review: Intravital imaging of the lactating mammary gland in live mice reveals novel aspects of milk-lipid secretion.J Dairy Sci. 2019 Mar;102(3):2760-2782. doi: 10.3168/jds.2018-15459. Epub 2018 Nov 22. J Dairy Sci. 2019. PMID: 30471915 Free PMC article.
-
TDP-43 facilitates milk lipid secretion by post-transcriptional regulation of Btn1a1 and Xdh.Nat Commun. 2020 Jan 17;11(1):341. doi: 10.1038/s41467-019-14183-1. Nat Commun. 2020. PMID: 31953403 Free PMC article.
-
Pseudogenization of the Slc23a4 gene is necessary for the survival of Xdh-deficient mice.Sci Rep. 2025 Jan 25;15(1):3250. doi: 10.1038/s41598-025-87751-9. Sci Rep. 2025. PMID: 39863758 Free PMC article.
-
Piggyback packaging in the mammary gland.J Physiol. 2016 Oct 15;594(20):5729-5730. doi: 10.1113/JP272960. J Physiol. 2016. PMID: 27739077 Free PMC article. No abstract available.
-
Maternal obesity during lactation may protect offspring from high fat diet-induced metabolic dysfunction.Nutr Diabetes. 2018 Apr 25;8(1):18. doi: 10.1038/s41387-018-0027-z. Nutr Diabetes. 2018. PMID: 29695710 Free PMC article.
References
-
- Affolter M, Grass L, Vanrobaeys F, Casado B & Kussmann M (2010). Qualitative and quantitative profiling of the bovine milk fat globule membrane proteome. J Proteomics 73, 1079–1088. - PubMed
-
- Barneda D, Planas‐Iglesias J, Gaspar ML, Mohammadyani D, Prasannan S, Dormann D, Han GS, Jesch SA, Carman GM, Kagan V, Parker MG, Ktistakis NT, Klein‐Seetharaman J, Dixon AM, Henry SA & Christian M (2015). The brown adipocyte protein CIDEA promotes lipid droplet fusion via a phosphatidic acid‐binding amphipathic helix. Elife 4, e07485. - PMC - PubMed
-
- Brasaemle DL, Dolios G, Shapiro L & Wang R (2004). Proteomic analysis of proteins associated with lipid droplets of basal and lipolytically stimulated 3T3‐L1 adipocytes. J Biol Chem 279, 46835–46842. - PubMed
MeSH terms
Substances
Grants and funding
LinkOut - more resources
Full Text Sources
Other Literature Sources
Molecular Biology Databases

