. 2016 Oct;186(1):46-56.
doi: 10.1111/cei.12834. Epub 2016 Aug 24.

Altered regulatory T cell phenotype in latent autoimmune diabetes of the adults (LADA)

Affiliations

Altered regulatory T cell phenotype in latent autoimmune diabetes of the adults (LADA)

M Radenkovic et al. Clin Exp Immunol. 2016 Oct.

Abstract

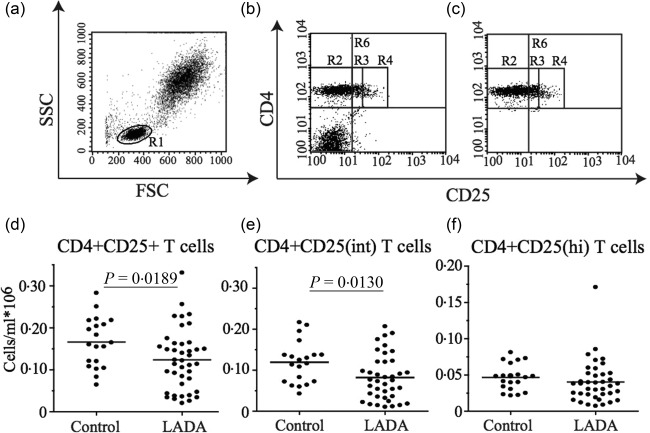
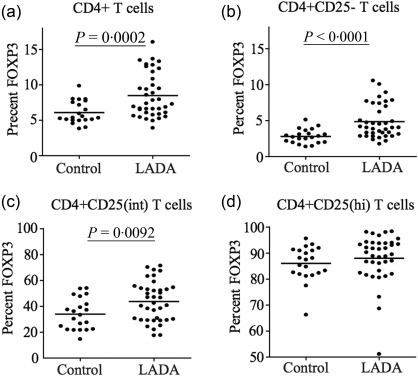
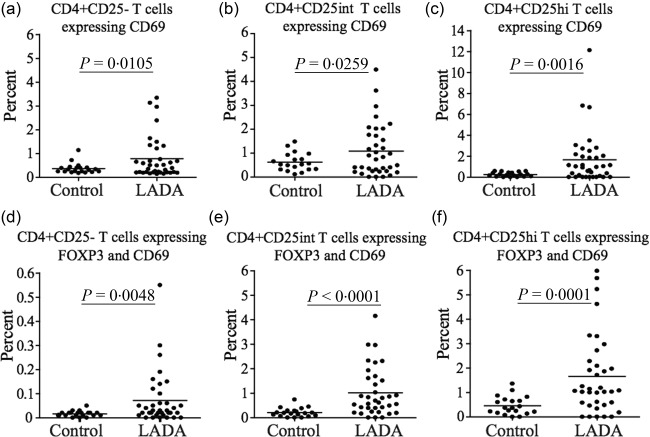
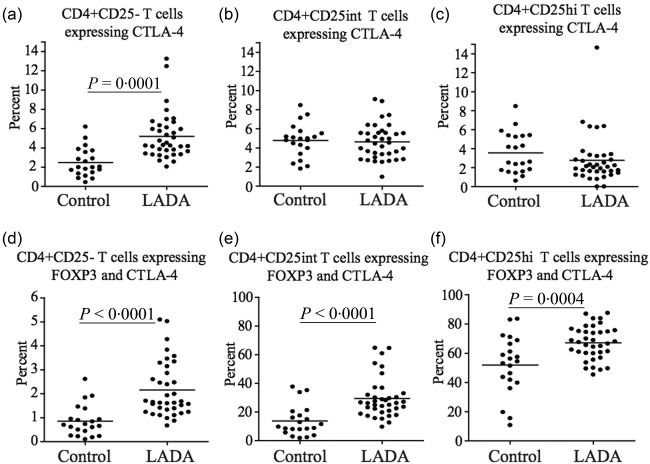
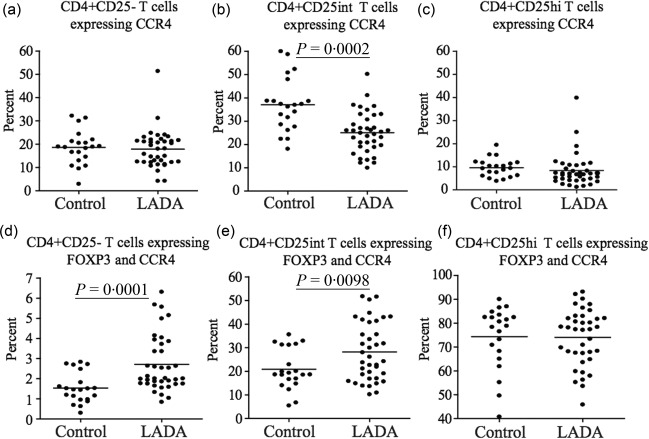
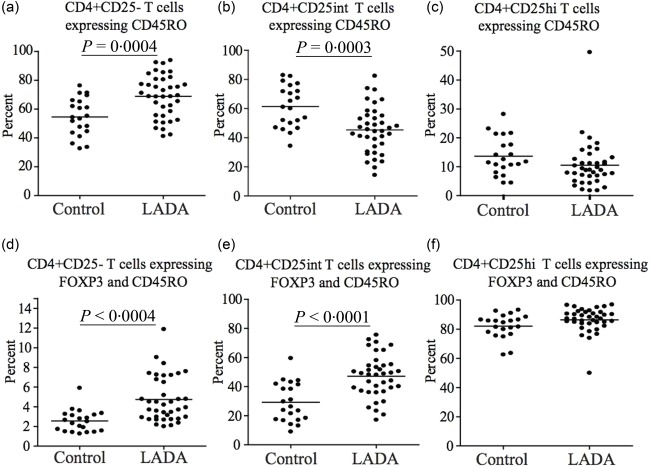
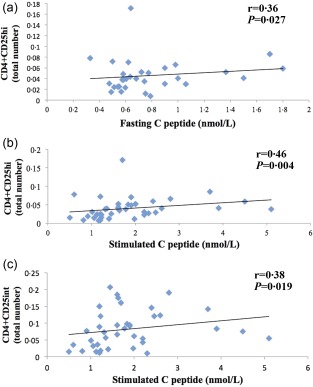
Latent autoimmune diabetes of the adults (LADA) accounts for up to 12% of all patients with diabetes. Initially the disease resembles type 2 diabetes (T2D); however, the typical presence of β cell autoantibodies indicates an autoimmune basis of LADA. While dysfunctional regulatory T cells (Tregs ) have been implicated in autoimmune diabetes, these cells have been scarcely studied in LADA. The aim of this study was to investigate the frequency and phenotype of circulating Tregs in LADA patients early during disease progression. Flow cytometric analysis was performed on whole blood and peripheral mononuclear cells (PBMC) from patients diagnosed with LADA prior to insulin deficiency (n = 39) and from healthy volunteers (n = 20). Overall, we found the frequency and activation status of peripheral putative Tregs to be altered in LADA patients compared to healthy controls. While total T cells and CD4(+) T cells expressing high levels of CD25 (CD4(+) CD25(hi) ) were unchanged, the frequency and total numbers of CD4(+) T cells expressing an intermediate level of CD25 (CD4(+) CD25(int) ) were decreased in LADA patients. Interestingly, the expression of the Treg -specific marker forkhead box protein 3 (FoxP3), as well as the activation and memory makers CD69, cytotoxic T lymphocyte associated antigen 4 (CTLA-4), CCR4 and CD45RO were increased in CD4(+) CD25(+) T cells of the patients. Our data depict phenotypical changes in T cells of LADA patients that may reflect a derangement in peripheral immune regulation contributing to the slow process leading to insulin-dependent diabetes in these patients.

Keywords: autoimmunity; diabetes; regulatory T cells.


Figures

Figure 1
Figure 1
Flow cytometric analysis of T cell populations in whole blood. (a) Gating strategy of the lymphocyte populations. The lymphocyte population (R1) was gated based on its characteristic appearance in forward scatter–side‐scatter (FSC‐SSC). (b) Representative dot‐plots showing the gating for total CD4+CD25+ T cells (R6) and (c) Representative dot‐plots of R6 used to calculate the frequency and total cell numbers of different populations within the CD4+ T cells. The CD4+ T cell population was divided based on the CD25 expression into CD4+CD25 T cells (R2), CD4+CD25int T cells (R3) and CD4+CD25hi T cells (R4). Frequency of total CD4+CD25+ (d), CD4+CD25int (e) and CD4+CD25hi (f) T cells in the 39 of the total 47 LADA patients of which we could performed the analysis on frozen peripheral blood mononuclear cells (PBMC) and healthy control individuals (n = 20). Mean value for each group is indicated with a horizontal line.
Figure 2
Figure 2
Flow cytometric analysis of forkhead box protein 3 (FoxP3) expression in CD4+ T cells. Percentage of FoxP3 expression in the total CD4+ T cell pool (a), among the CD4+CD25 T cells (b), the CD4+CD25int T cells (c) and the CD4+CD25hi T cells (d) in latent autoimmune diabetes of adults (LADA) patients (n = 38) and healthy control individuals (n = 20). Mean value for each group is indicated with a horizontal line.
Figure 3
Figure 3
Flow cytometric analysis of CD69 expression in CD4+ T cells. Flow cytometric comparison of CD69 expression in the (a) CD4+CD25, (b) CD4+CD25int and (c) CD4+CD25hi T cell populations in latent autoimmune diabetes of adults (LADA) patients (n = 36) and healthy control individuals (n = 20). Flow cytometric comparison of the percentage of CD69+FoxP3+ T cells among the (d) CD4+CD25, (e) CD4+CD25int and (f) CD4+CD25hi T cell populations in LADA (n = 36) and healthy control individuals (n = 20). Mean value for each group is indicated with a horizontal line.
Figure 4
Figure 4
Flow cytometric analysis of cytotoxic T lymphocyte antigen (CTLA)−4 expression in CD4+ T cells. Flow cytometric comparison of CTLA‐4 expression in the (a) CD4+CD25, (b) CD4+CD25int and (c) CD4+CD25hi T cell populations in latent autoimmune diabetes of adults (LADA) (n = 37) and healthy control individuals (n = 20). Flow cytometric comparison of the percentage of CTLA‐4 forkhead box protein 3 (FoxP3)+ T cells among (d) CD4+CD25, (e) CD4+CD25int and (f) CD4+CD25hi T cell populations in LADA patients (n = 37) and healthy control individuals (n = 20). Mean value for each group is indicated with a horizontal line.
Figure 5
Figure 5
Flow cytometric analysis of CCR4 expression in CD4+ T cells. Flow cytometric comparison of CCR4 expression in the (a) CD4+CD25, (b) CD4+CD25int and (c) CD4+CD25hi T cell populations in latent autoimmune diabetes of adults (LADA) (n = 38) and healthy control individuals (n = 20). Flow cytometric comparison of the percentage of CCR4+ forkhead box protein 3 (FoxP3)+ T cells among the (d) CD4+CD25, (e) CD4+CD25int and (f) CD4+CD25hi T cell populations in LADA (n = 38) and healthy control individuals (n = 20). Mean value for each group is indicated with a horizontal line.
Figure 6
Figure 6
Flow cytometric analysis of CD45RO expression in CD4+ T cells. Flow cytometric comparison of CD45RO expression in the (a) CD4+CD25, (b) CD4+CD25int and (c) CD4+CD25hi T cell populations in latent autoimmune diabetes of adults (LADA) (n = 38) and healthy control individuals (n = 20). Flow cytometric comparison of the percentage of CD45RO+ forkhead box protein 3 (FoxP3)+ T cells among the (d) CD4+CD25, (e) CD4+CD25int and (f) CD4+CD25hi T cell populations in LADA (n = 38) and healthy control individuals (n = 20). Mean value for each group is indicated with a horizontal line.
Figure 7
Figure 7
Statistical correlations between CD4+CD25+ T cell populations and C‐peptide in latent autoimmune diabetes of adults (LADA) patients. (a) Correlation between high and CD4+CD25hi T cells and fasting C‐peptide; (b) correlation between CD4+CD25hi T cells and stimulated C‐peptide and (c) correlation between CD4+CD25int T cells and stimulated C‐peptide.

References

    1. Redondo MJ. LADA: time for a new definition. Diabetes 2013; 62:339–40. - PMC - PubMed
    1. Nambam B, Aggarwal S, Jain A. Latent autoimmune diabetes in adults: a distinct but heterogeneous clinical entity. World J Diabetes 2010; 1:111–5. - PMC - PubMed
    1. Tuomi T, Groop LC, Zimmet PZ, Rowley MJ, Knowles W, Mackay IR. Antibodies to glutamic acid decarboxylase reveal latent autoimmune diabetes mellitus in adults with a non‐insulin‐dependent onset of disease. Diabetes 1993; 42:359–62. - PubMed
    1. Tuomi T, Carlsson A, Li H et al Clinical and genetic characteristics of type 2 diabetes with and without GAD antibodies. Diabetes 1999; 48:150–7. - PubMed
    1. Zhang Y, Zhou ZG, Yang L, Lin J, Li X, He WM. [Abnormal T cell autoimmunity against GAD65 in LADA patients]. Zhonghua Yi Xue Za Zhi 2010; 90:1963–5. - PubMed

Publication types

MeSH terms