. 2016 Jul 19;113(29):8302-7.
doi: 10.1073/pnas.1600372113. Epub 2016 Jun 29.

Temporal and intrinsic factors of rifampicin tolerance in mycobacteria

Affiliations

Temporal and intrinsic factors of rifampicin tolerance in mycobacteria

Kirill Richardson et al. Proc Natl Acad Sci U S A. .

Abstract

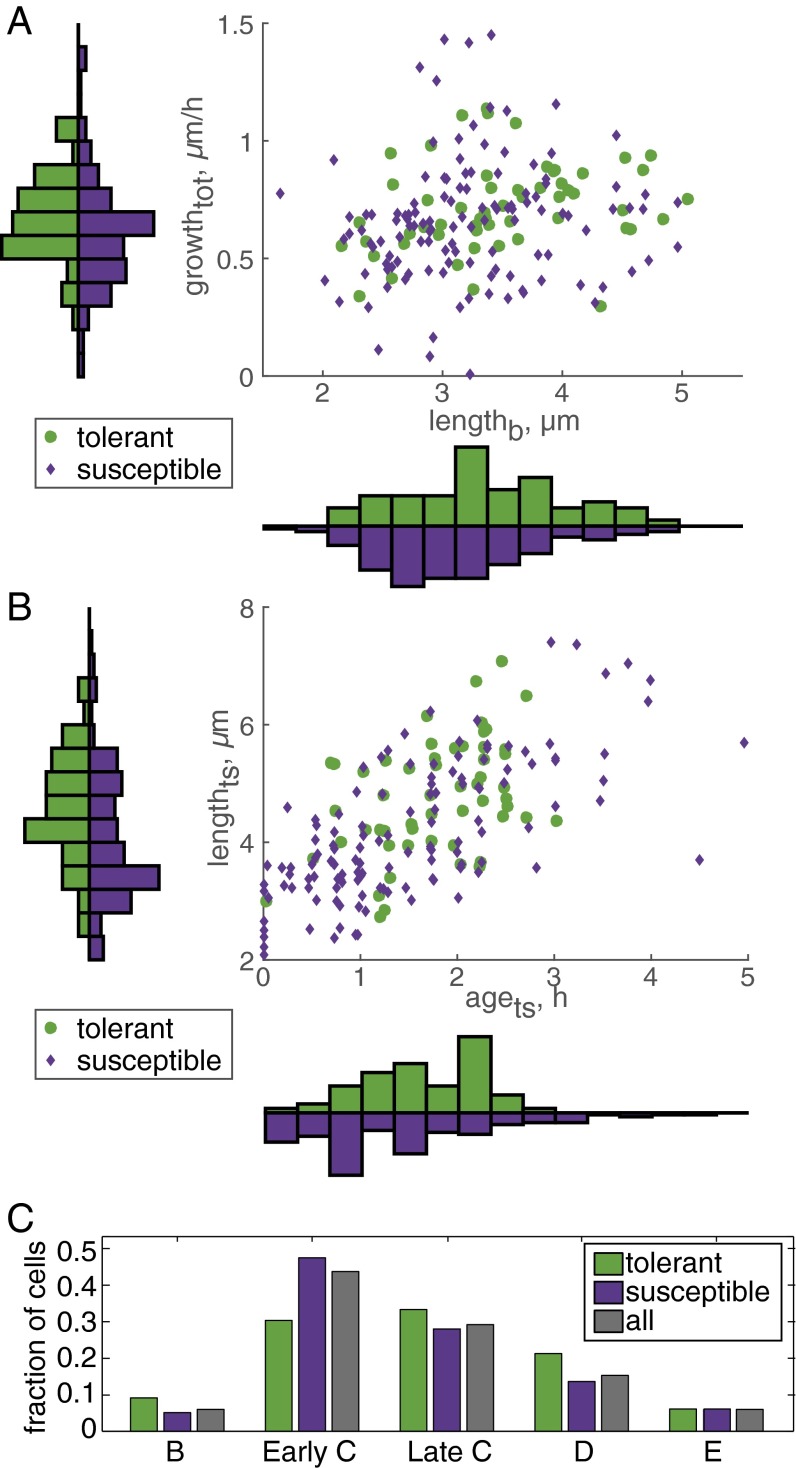
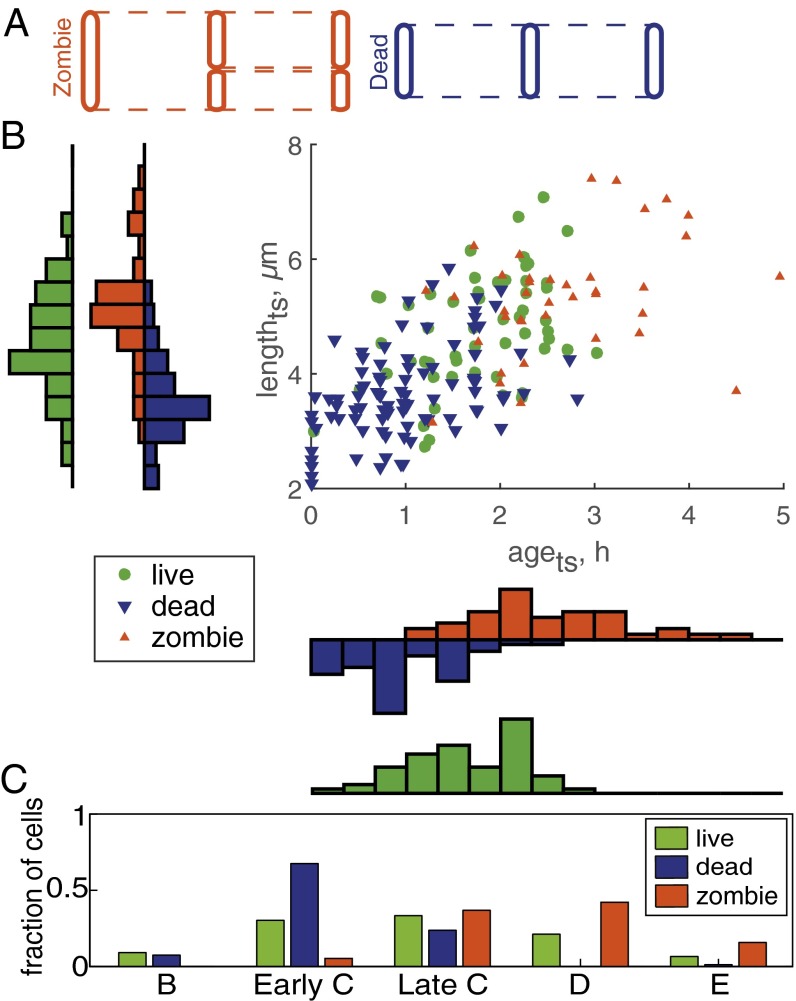
Mycobacteria grow and divide asymmetrically, creating variability in growth pole age, growth properties, and antibiotic susceptibilities. Here, we investigate the importance of growth pole age and other growth properties in determining the spectrum of responses of Mycobacterium smegmatis to challenge with rifampicin. We used a combination of live-cell microscopy and modeling to prospectively identify subpopulations with altered rifampicin susceptibility. We found two subpopulations that had increased susceptibility. At the initiation of treatment, susceptible cells were either small and at early stages of the cell cycle, or large and in later stages of their cell cycle. In contrast to this temporal window of susceptibility, tolerance was associated with factors inherited at division: long birth length and mature growth poles. Thus, rifampicin response is complex and due to a combination of differences established from both asymmetric division and the timing of treatment relative to cell birth.

Keywords: antibiotic susceptibility; cell biology; mathematical modeling; mycobacteria; single cell.


Conflict of interest statement

The authors declare no conflict of interest.

Figures

Fig. 1.
Fig. 1.
Measuring drug treatment response in M. smegmatis. (A) Experiment design, cellular parameters, and microfluidics device schematic. Two syringes, controlled by microfluidic pumps, were connected to a mixing device. M. smegmatis SSB-GFP cells were seeded in a microfluidics device and then placed in a heated environmental chamber for imaging every 15 min. The media syringe pump dispensed medium for the entire duration of the experiment (26.25 h), and the drug syringe pump was activated 10 h after the start of the experiment and dispensed rifampicin for 6 h. (B) Cellular parameters measured before and during treatment. Cells that were born and divided during the predrug growth period were used as controls. Cells that were born after the time lapse began but had not divided before the drug treatment were annotated for cell length and relative growth pole age (numbers, in black: 1 = youngest pole, 4 = oldest pole) for the remainder of the experiment. Accelerator and alternator cells are denoted as “acc” or “alt,” respectively. Schematics of cells demonstrate two possible drug treatment outcomes. A cell was classified as rifampicin-tolerant if it either resumed growth during the recovery period or produced at least one daughter cell that resumed growth. (C) Microfluidic device image sequence. The brightfield image sequence depicts an M. smegmatis microcolony (Left to Right) immediately before drug treatment, immediately after drug treatment, and at the end of the recovery period. Two drug treatment outcomes are illustrated: rifampicin-tolerant (green) and rifampicin-susceptible (violet). (D) Cellular parameters measured at the start of treatment. The following cell parameters were tracked: length at birth (indicated as lengthb), length and age at division (indicated as lengthts and agets), average growth rate and elongation rate immediately before treatment start (indicated as growthtot and growthinst), and presence of SSB-foci (green dots in the schematic), which were used to determine cell cycle stage and timing (B-C-D line, where C is DNA replication stage). SSB-foci were recorded and tracked throughout the course of growth, drug treatment, and recovery.
Fig. 2.
Fig. 2.
Rifampicin-tolerant cells are larger and have older growth poles than susceptible cells. (A) Scatter plot of cell birth length (lengthb), average growth rate from birth to treatment start (growthtot), and drug treatment outcome. Histograms display the distribution of tolerant and susceptible cells along each axis; distributions were normalized by setting the area to one. Each bin of the histogram of the x axis (lengthb) covers 0.29 µm of cell length, and each bin of the y axis (growth rate) covers 0.11 µm/h. Rifampicin-tolerant cells had a larger average length at birth (P < 0.005). No significant difference was detected for the average growth rate of susceptible and tolerant subpopulations. (B) Scatter plot of cell age (agets) and length (lengthts) at the start of drug treatment and drug treatment outcome. Each bin of the histogram of the x axis (agets) spans 0.36 h of cell age, and each bin of the y axis (lengthts) spans 0.43 µm of cell length at treatment start. Drug-tolerant cells had a larger average length at treatment start (P < 0.005). No significant difference was detected for the average age of susceptible and tolerant subpopulations. (C) Distribution of cell cycle stages (B prereplication, early C replication, late C replication, D postreplication, and E predivision replication) at the start of drug treatment. There was no significant difference between cell cycle distribution for tolerant and susceptible cells.
Fig. 3.
Fig. 3.
Two rifampicin-susceptible subpopulations have distinct growth and cell state properties. (A) Subcategorization of susceptible cell populations. Susceptible cell classification was refined by introducing two subcategories of nonelongating susceptible cells: (i) dead cells that did not divide after the application of drug and (ii) zombie cells, which divided into two nonelongating cells after the start of rifampicin treatment. (B) Scatter plot of age (agets) and length (lengthts) at the start of drug treatment and drug treatment outcome. The histogram bin size is identical to Fig. 2B. The difference in lengthts was significant for two pairs: live–dead (P < 0.0001), and dead–zombie (P < 0.0001). The difference in birth time relative to the start of drug treatment was significant for all three pairs: live–dead (P < 0.001), live–zombie (P < 0.0005), and dead–zombie (P < 0.0001). (C) Distribution of cell cycle stages (B prereplication, early C replication, late C replication, D postreplication, and E predivision replication) at the start of drug treatment. Refined drug-susceptible cell categorization demonstrates that compared with the drug-tolerant population, the dead cell population was skewed toward early cell cycle stages (P < 0.0005), whereas the zombie population was skewed toward late cell cycle stages (P < 0.001).
Fig. 4.
Fig. 4.
Using phenotypic characteristics to predict rifampicin (rif) treatment outcome. (A) Partial least-squares regression coefficients (coef) of cellular parameters. The correlations are shown between rifampicin treatment outcome and the phenotypic M. smegmatis characteristics that served as outcome predictor variables. The y axis represents relative correlation strength (maximum 1.0). Positive values represent covariable relationships between the input–output variable pair, whereas negative values represent negative correlation. SEs displayed as error bars at the end of each column were calculated with jack-knifing. Arrows at the bottom represent the most important contributions to each of the treatment outcomes; arrow direction represents positive (up) and negative (down) correlations. (B) PLSR loading plot of cellular parameters. The loading plot demonstrates the relative influence of predictor values on drug treatment outcome, i.e., how well x variables correlate with y, and how responses vary in relation to each other. The low contribution values are 1, B cycle state; 2, elongation rate immediately before treatment start (growthinst, µm/h); 3, pole age 2 (young accelerator); 4, C cycle duration (h); 5, drug concentration (µg/mL); 6, average growth rate (growthtot, µm/h); 7, late C cycle state; and 8, E cycle state. (C) Flowchart of phenotype selection rules for predicting rifampicin treatment outcome. The categorization process consisted of splitting the bulk population into accelerators and alternators and then defining zombie and dead cells by using cell length and age thresholds derived from the main dataset. At each sequential step, cells that met the predefined selection criteria were assigned to a particular drug treatment classification: zombie, dead, and, finally, live. Drug tolerance response was then determined for cells in a separate test set. Sixty-percent of the cells in a test set were correctly identified as either live, dead, or zombie, compared to 37% when using random selection.

Comment in

Similar articles

Cited by

References

    1. Connolly LE, Edelstein PH, Ramakrishnan L. Why is long-term therapy required to cure tuberculosis? PLoS Med. 2007;4(3):e120. - PMC - PubMed
    1. Barry CE, 3rd, et al. The spectrum of latent tuberculosis: Rethinking the biology and intervention strategies. Nat Rev Microbiol. 2009;7(12):845–855. - PMC - PubMed
    1. Sacchettini JC, Rubin EJ, Freundlich JS. Drugs versus bugs: In pursuit of the persistent predator Mycobacterium tuberculosis. Nat Rev Microbiol. 2008;6(1):41–52. - PubMed
    1. Allison KR, Brynildsen MP, Collins JJ. Heterogeneous bacterial persisters and engineering approaches to eliminate them. Curr Opin Microbiol. 2011;14(5):593–598. - PMC - PubMed
    1. Lewis K. Persister cells, dormancy and infectious disease. Nat Rev Microbiol. 2007;5(1):48–56. - PubMed

Publication types

MeSH terms

LinkOut - more resources