. 2016 Jul 12;113(28):E4025-34.
doi: 10.1073/pnas.1520213113. Epub 2016 Jun 28.

Algorithmic methods to infer the evolutionary trajectories in cancer progression

Affiliations

Algorithmic methods to infer the evolutionary trajectories in cancer progression

Giulio Caravagna et al. Proc Natl Acad Sci U S A. .

Abstract

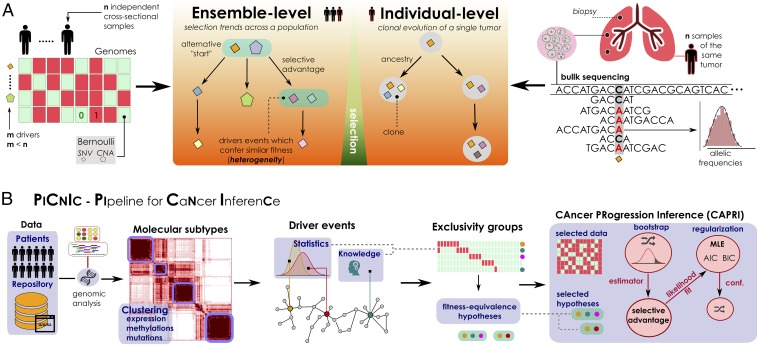
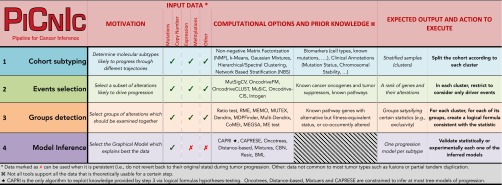
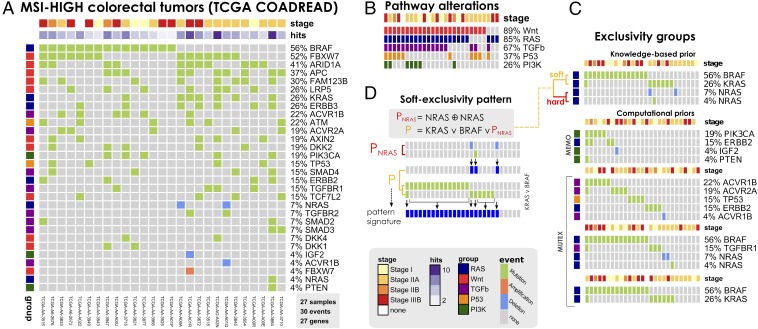
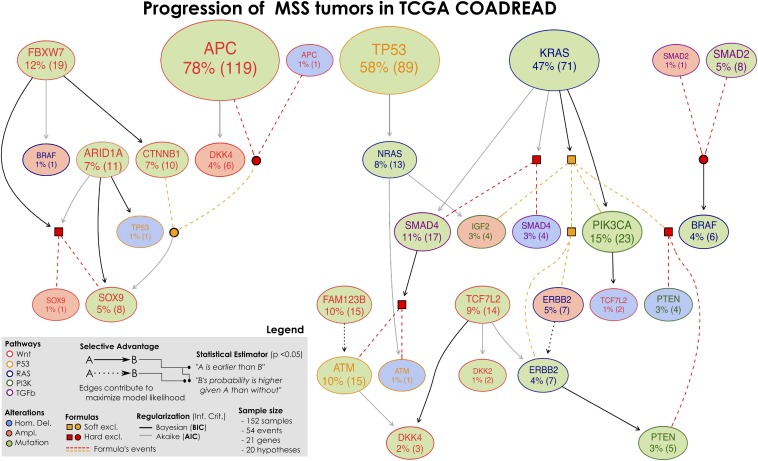
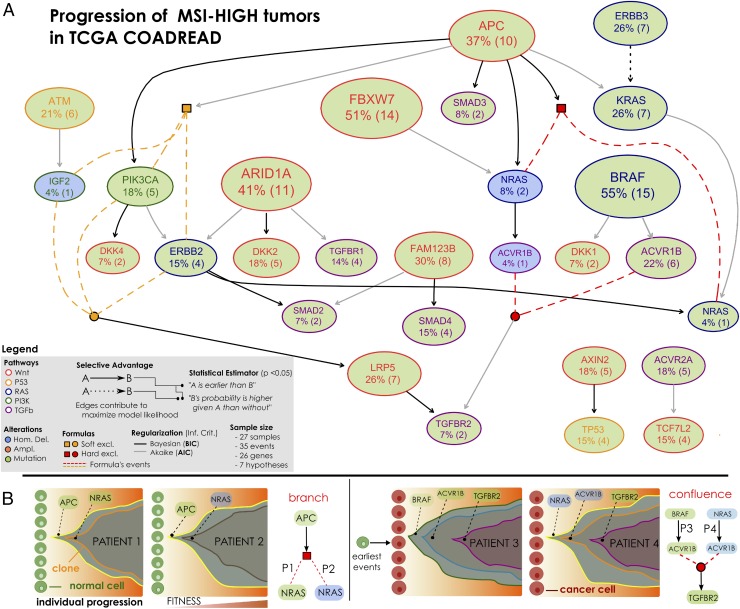
The genomic evolution inherent to cancer relates directly to a renewed focus on the voluminous next-generation sequencing data and machine learning for the inference of explanatory models of how the (epi)genomic events are choreographed in cancer initiation and development. However, despite the increasing availability of multiple additional -omics data, this quest has been frustrated by various theoretical and technical hurdles, mostly stemming from the dramatic heterogeneity of the disease. In this paper, we build on our recent work on the "selective advantage" relation among driver mutations in cancer progression and investigate its applicability to the modeling problem at the population level. Here, we introduce PiCnIc (Pipeline for Cancer Inference), a versatile, modular, and customizable pipeline to extract ensemble-level progression models from cross-sectional sequenced cancer genomes. The pipeline has many translational implications because it combines state-of-the-art techniques for sample stratification, driver selection, identification of fitness-equivalent exclusive alterations, and progression model inference. We demonstrate PiCnIc's ability to reproduce much of the current knowledge on colorectal cancer progression as well as to suggest novel experimentally verifiable hypotheses.

Keywords: Bayesian structural inference; cancer evolution; causality; next generation sequencing; selective advantage.


Conflict of interest statement

The authors declare no conflict of interest.

Figures

Fig. 1.
Fig. 1.
(A) Problem statement. (A, Left) Inference of ensemble-level cancer progression models from a cohort of n independent patients (cross-sectional). By examining a list of somatic mutations or CNAs per patient (0/1 variables) we infer a probabilistic graphical model of the temporal ordering of fixation and accumulation of such alterations in the input cohort. Sample size and tumor heterogeneity complicate the problem of extracting population-level trends, because this requires accounting for patients’ specificities such as multiple starting events. (A, Right) For an individual tumor, its clonal phylogeny and prevalence is usually inferred from multiple biopsies or single-cell sequencing data. Phylogeny-tree reconstruction from an underlying statistical model of reads coverage or depths estimates alterations’ prevalence in each clone, as well as ancestry relations. This problem is mostly worsened by the high intratumor heterogeneity and sequencing issues. (B) The PiCnIc pipeline for ensemble-level inference includes several sequential steps to reduce tumor heterogeneity, before applying the CAPRI (40) algorithm. Available mutation, expression, or methylation data are first used to stratify patients into distinct tumor molecular subtypes, usually by exploiting clustering tools. Then, subtype-specific alterations driving cancer initiation and progression are identified with statistical tools and on the basis of prior knowledge. Next is the identification of the fitness-equivalent groups of mutually exclusive alterations across the input population, again done with computational tools or biological priors. Finally, CAPRI processes a set of relevant alterations within such groups. Via bootstrap and hypothesis testing, CAPRI extracts a set of “selective advantage relations” among them, which is eventually narrowed down via maximum likelihood estimation with regularization (with various scores). The ensemble-level progression model is obtained by combining such relations in a graph, and its confidence is assessed via various bootstrap and cross-validation techniques.
Fig. 2.
Fig. 2.
The PiCnIc pipeline. We do not provide a unique all-encompassing rationale to instantiate PiCnIc because all steps refer to a research area currently under development, where the optimal approach is often dependent on the type of data available and prior knowledge about the cancer under study. References are provided for each tool that can be used to instantiate PiCnIc: NMF (61), k-means, Gaussian mixtures, hierarchical/spectral clustering (62), NBS (66), MutSigCV (68), OncodriveFM (69), OncodriveCLUST (70), MuSiC (71), Oncodrive-CIS (72), Intogen (73), Ratio (74), RME (75), MEMO (76), MUTEX (77), Dendrix (78), MDPFinder (79), Multi-Dendrix (80), CoMEt (81), MEGSA (82), ME (83), CAPRI (40), CAPRESE (39), Oncotrees (31, 33), distance-based (32), mixtures (34), CBN (35, 36), Resic (37), and BML (38).
Fig. 3.
Fig. 3.
(A) MSI-HIGH colorectal tumors from the TCGA COADREAD project (56), restricted to 27 samples with both somatic mutations and high-resolution CNA data available and a selection out of 33 driver genes annotated to WNT, RAS, PI3K, TGF-β, and P53 pathways. This dataset is used to infer the model in Fig. 5. (B) Mutations and CNAs in MSI-HIGH tumors mapped to pathways confirm heterogeneity even at the pathway level. (C) Groups of mutually exclusive alterations were obtained from ref. —which run the MEMO (76) tool—and by MUTEX (77) tool. In addition, previous knowledge about exclusivity among genes in the RAS pathway was exploited. (D) A Boolean formula input to CAPRI tests the hypothesis that alterations in the RAS genes KRAS, NRAS, and BRAF confer equivalent selective advantage. The formula accounts for hard exclusivity of alterations in NRAS mutations and deletions, jointly with soft exclusivity with KRAS and NRAS alterations.
Fig. 4.
Fig. 4.
Selective advantage relations inferred by CAPRI constitute MSS progression; the input dataset is given in SI Appendix, Figs. S4 and S5. Formulas written on groups of exclusive alterations (e.g., SOX9 amplifications and mutations) are displayed in expanded form; their events are connected by dashed lines with colors representing the type of exclusivity (red for hard, orange for soft). Logical connectives are squared when the formula is selected and circular when the formula selects for a downstream node. For this model of MSS tumors in COADREAD we find strong statistical support for many edges (P values, bootstrap scores, and cross-validation statistics shown in the SI Appendix), as well as the overall model. This model captures both current knowledge about CRC progression—for example, selection of alterations in PI3K genes by the KRAS mutations (directed or via the MEMO group, with BIC)—as well as novel interesting testable hypotheses [e.g., selection of SOX9 alterations by FBXW7 mutations (with BIC)].
Fig. 5.
Fig. 5.
(A) Selective advantage relations inferred by CAPRI constitute MSI-HIGH progression; the input dataset is given in Fig. 3. Formulas written on groups of exclusive alterations are expanded as in Fig. 4. For each relation, confidence is estimated as for MSS tumors and reported in the SI Appendix. In general, this model is supported by weaker statistics than MSS tumors—possibly because of this small sample size (n=27). Still, we can find interesting relations involving APC mutations that select for PIK3CA ones (via BIC) as well as selection of the MEMO group (ERBB2/PIK3CA mutations or IGF2 deletions) predicted by AIC. Similarly, we find a strong selection trend among mutations in ERBB2 and KRAS, despite the fact that in this case the temporal precedence among those mutations is not disentangled because the two events have the same marginal frequencies (26%). (B) Branching and confluent evolutionary trajectories of clonal expansion inferred from the selective advantage relations implicit in the data. Such trajectories capture progression trends that are representative of alternative trajectories among patients, as driven by different types of genomic lesions. Note, that while the majority of the selectivity inferences are genuine, some of them could be spurious: e.g., the suggestion that APC-mutated clones shall enjoy expansion, up to acquisition of further selective advantage via mutations or homozygous deletions in NRAS. Nonetheless, the putative genuine selectivity relations need to be further validated: e.g., the suggestion that the clones of patients harbouring distinct alterations in ACVR1B—and different upstream events—will enjoy further selective advantage from mutation in the TGFBR2 gene.

References

    1. Nowell PC. The clonal evolution of tumor cell populations. Science. 1976;194(4260):23–28. - PubMed
    1. Fidler IJ. Tumor heterogeneity and the biology of cancer invasion and metastasis. Cancer Res. 1978;38(9):2651–2660. - PubMed
    1. Dexter DL, et al. Heterogeneity of tumor cells from a single mouse mammary tumor. Cancer Res. 1978;38(10):3174–3181. - PubMed
    1. Merlo LM, Pepper JW, Reid BJ, Maley CC. Cancer as an evolutionary and ecological process. Nat Rev Cancer. 2006;6(12):924–935. - PubMed
    1. Hanahan D, Weinberg RA. The hallmarks of cancer. Cell. 2000;100(1):57–70. - PubMed

Publication types