. 2016 Jul 19;113(29):8290-5.
doi: 10.1073/pnas.1601571113. Epub 2016 Jun 29.

Sleeping Beauty screen reveals Pparg activation in metastatic prostate cancer

Affiliations

Sleeping Beauty screen reveals Pparg activation in metastatic prostate cancer

Imran Ahmad et al. Proc Natl Acad Sci U S A. .

Abstract

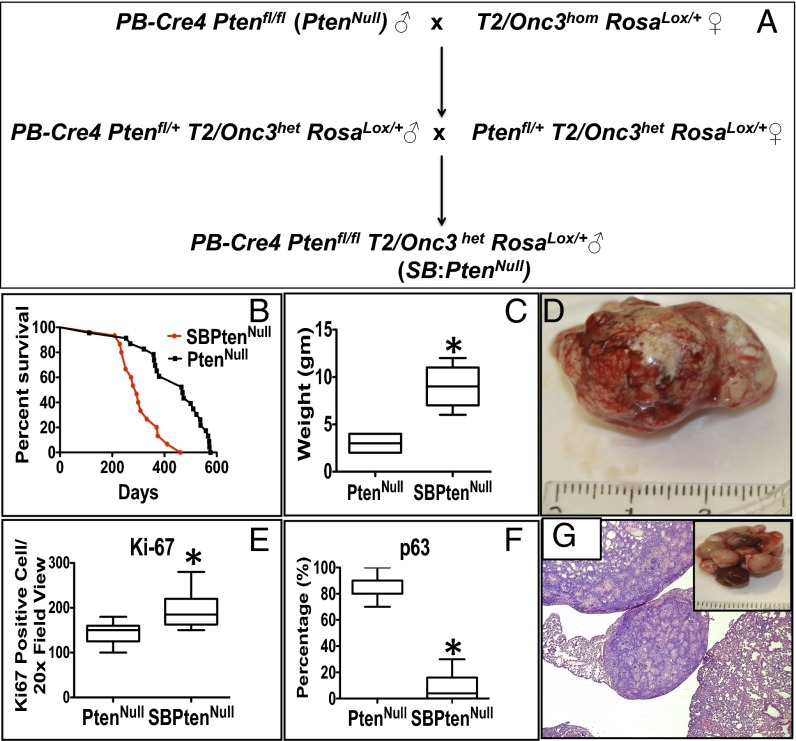
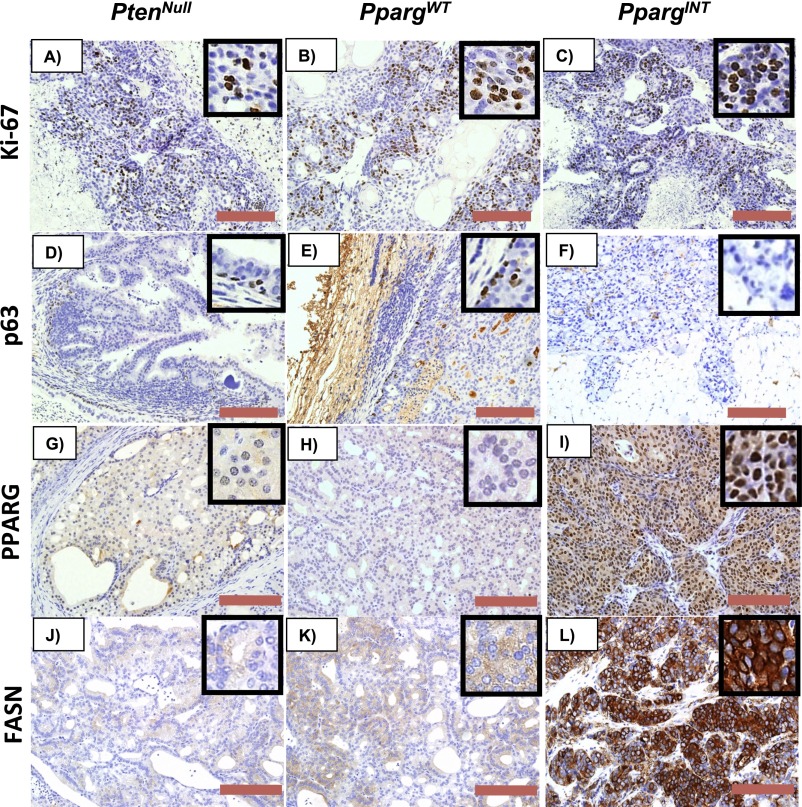
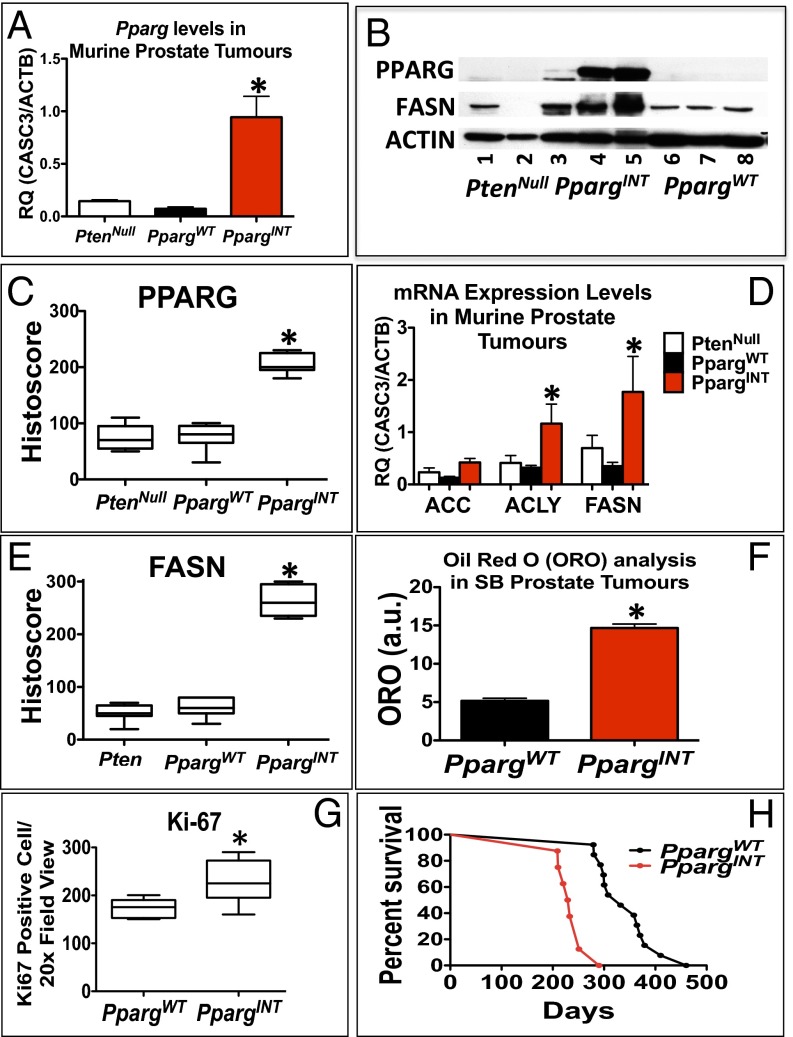
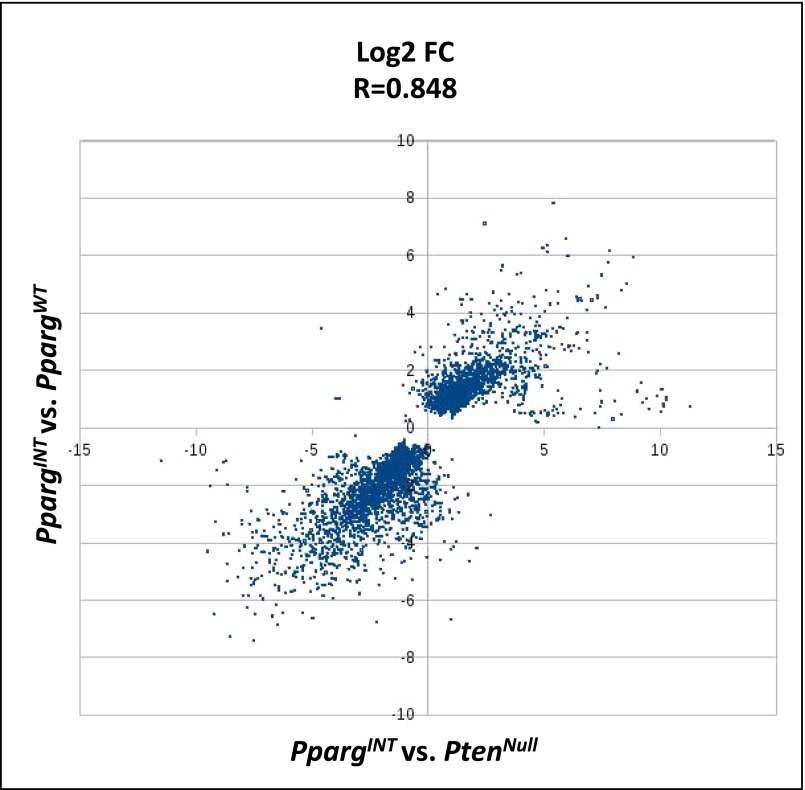
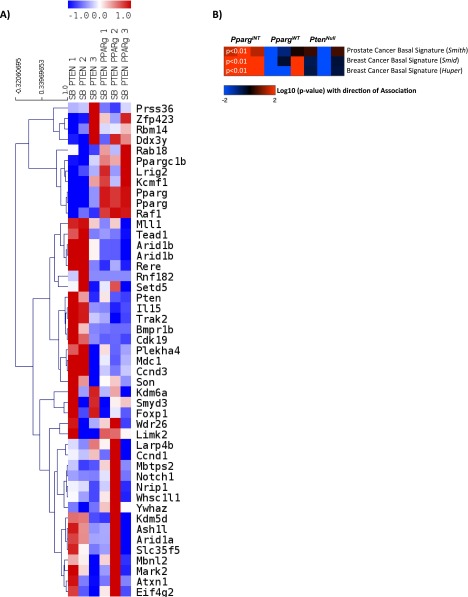
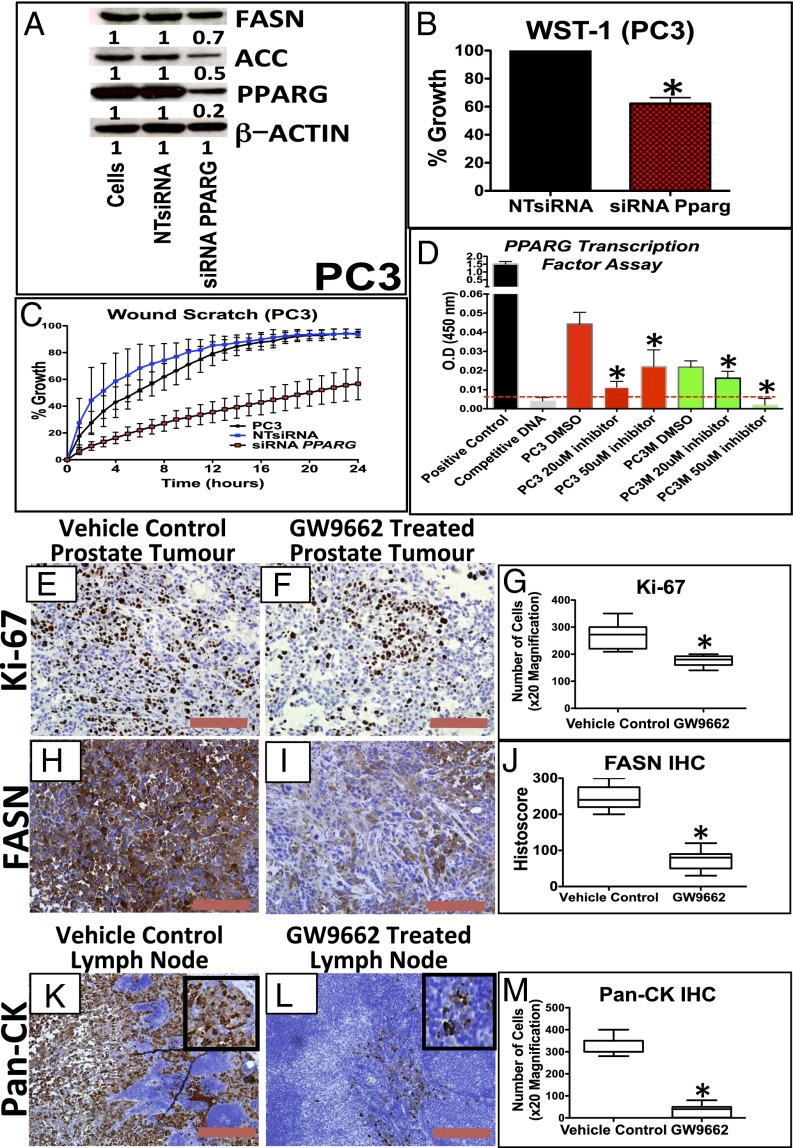
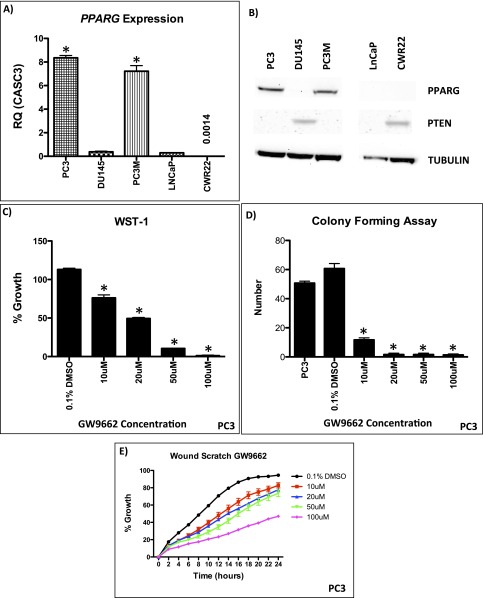
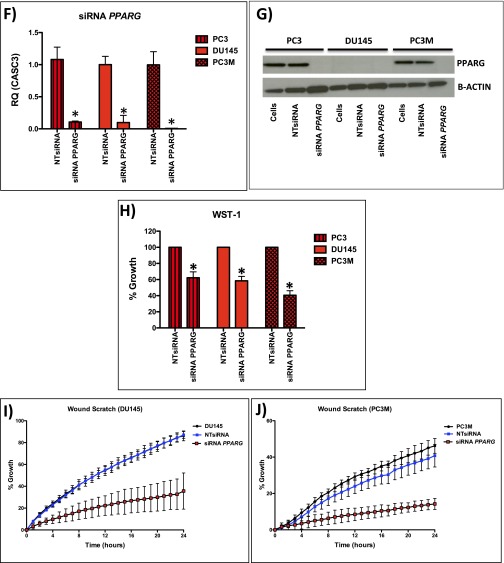
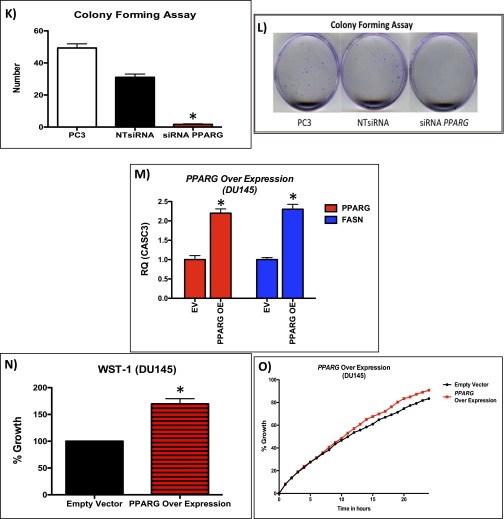
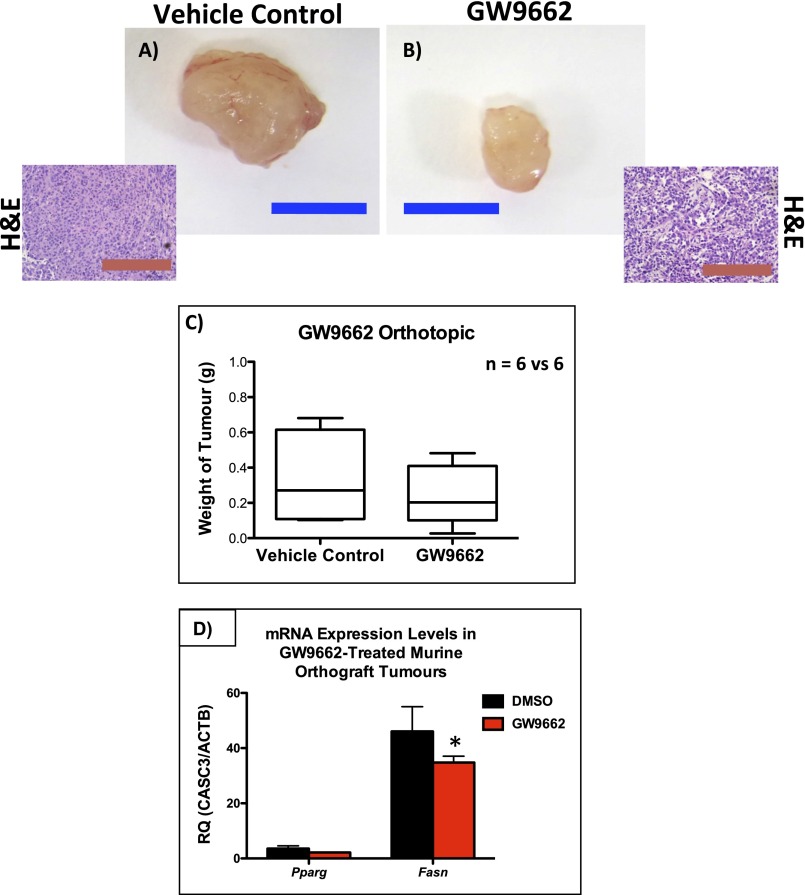
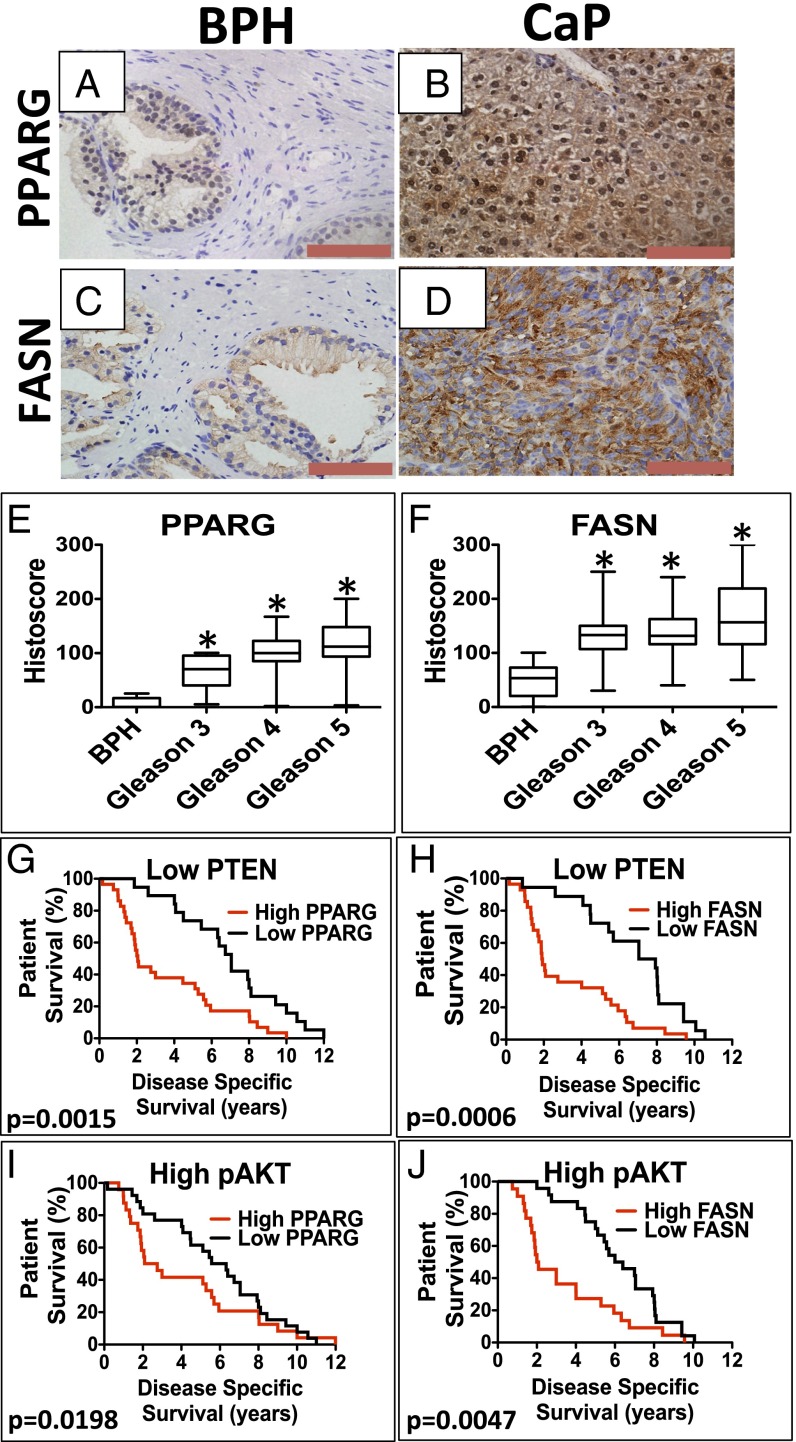
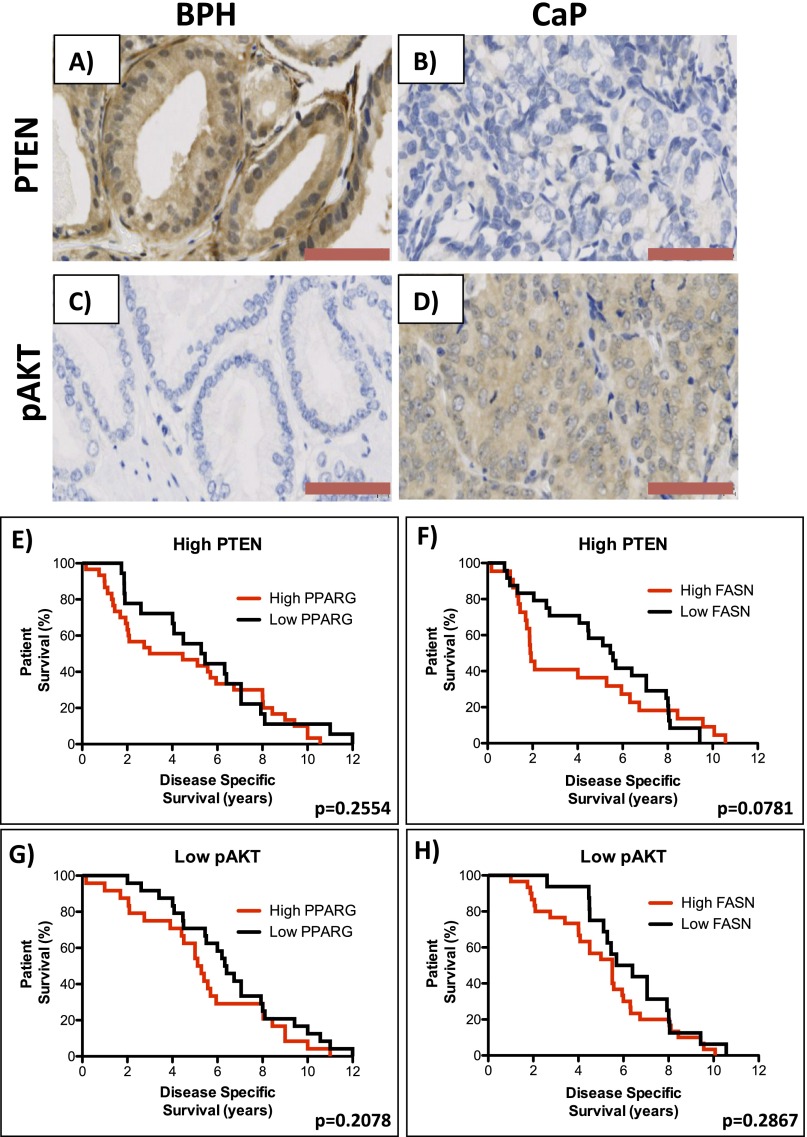
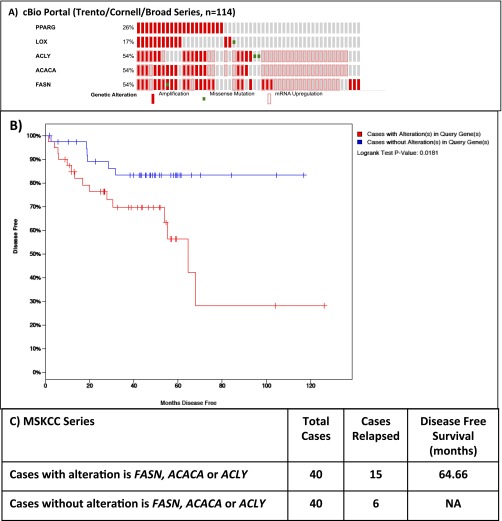
Prostate cancer (CaP) is the most common adult male cancer in the developed world. The paucity of biomarkers to predict prostate tumor biology makes it important to identify key pathways that confer poor prognosis and guide potential targeted therapy. Using a murine forward mutagenesis screen in a Pten-null background, we identified peroxisome proliferator-activated receptor gamma (Pparg), encoding a ligand-activated transcription factor, as a promoter of metastatic CaP through activation of lipid signaling pathways, including up-regulation of lipid synthesis enzymes [fatty acid synthase (FASN), acetyl-CoA carboxylase (ACC), ATP citrate lyase (ACLY)]. Importantly, inhibition of PPARG suppressed tumor growth in vivo, with down-regulation of the lipid synthesis program. We show that elevated levels of PPARG strongly correlate with elevation of FASN in human CaP and that high levels of PPARG/FASN and PI3K/pAKT pathway activation confer a poor prognosis. These data suggest that CaP patients could be stratified in terms of PPARG/FASN and PTEN levels to identify patients with aggressive CaP who may respond favorably to PPARG/FASN inhibition.

Keywords: PPARG; PTEN; Sleeping Beauty; metastasis; prostate cancer.


Conflict of interest statement

The authors declare no conflict of interest.

Figures

Fig. 1.
Fig. 1.
Identification of novel genes from a SB transposon screen on a background of PtenNull-driven prostate cancer. (A) Breeding schedule to generate SB:PtenNull (PB-Cre4:Ptenfl/flT2Onc3het Rosa26Lox66SBLox71/+). (B) Kaplan–Meier (log-rank) curve demonstrating reduced survival in the SB:PtenNull cohort, compared with the PtenNull mice (n = 21 vs. 21, P < 0.0001). (C) Boxplot comparing the weight of primary prostate tumors (n = 21 vs. 21, *P = 0.002; Mann–Whitney). (D) Prostate tumor from SB:PtenNull mice. (E) Boxplot comparing Ki-67 staining between the cohorts (n = 21 vs. 21, *P < 0.0001; Mann–Whitney). (F) Comparison of p63 IHC between the cohorts (y axis represents percentage of glandular basement left intact; n = 21 vs. 21 *P < 0.0001; Mann–Whitney). (G) Representative lung metastasis from SB:PtenNull mouse.
Fig. S1.
Fig. S1.
Representative IHC of (A–C) Ki-67, (D–F) p63, (G–I) PPARG, and (J–L) FASN in prostate tumors from PtenNull, PpargWT, and PpargINT, respectively. (Red bar, 200 µm.)
Fig. 2.
Fig. 2.
Characterization of SB:PtenNull tumors reveals oncogenic role for Pparg. (A) RT-PCR for Pparg1 expression in PtenNull, PpargWT, and PpargINT (n = 3, *P < 0.0001; Mann–Whitney). (B) Representative immunoblotting of PPARG and FASN in PtenNull, PpargINT, and PpargWT. (C) PPARG and (E) FASN quantification of staining using histoscore in PtenNull, PpargWT, and PpargINT, respectively, demonstrating a statistically significant increase in protein levels in PpargINT mice (n = 5, *P < 0.005 and *P < 0.0001, respectively; Mann–Whitney). (D) PCR analysis for mRNA expression of Pparg and genes encoding downstream lipogenic enzymes (Acc, Acly, and Fasn; n = 3, error bars represent SEM, *P < 0.05; Mann–Whitney). (F) Oil Red O staining quantification of triglyceride and cholesterol esters in snap frozen prostate tumors of PpargWT and PpargINT samples (n = 3 vs. 3, error bars represent SEM, *P < 0.001; Mann–Whitney). (G) Quantification of Ki-67–positive cells in PpargINT demonstrated increased levels of proliferation compared with PpargWT tumors (n = 8 vs.13, *P = 0.0008; Mann–Whitney). (H) Kaplan–Meier (log-rank) curve demonstrating reduced survival in the PpargINT compared with the PpargWT mice (*n = 8 vs.13, P < 0.0001).
Fig. S2.
Fig. S2.
The scatter plot shows the correlation of log2-fold change values from the PpargINT vs. PpargWT analysis on the vertical axis against the log2-fold change values from the PpargINT vs. PtenNull analysis on the horizontal axis.
Fig. S3.
Fig. S3.
(A) Heatmap analysis for the expression status for genes harboring CIS based on RNA-seq data. Based on the data from CIS analysis, two separate Pparg hotspots for insertion were observed, which are demonstrated individually in the heatmap. (B) Heatmap analysis demonstrating the increased basal phenotype of the PpargINT tumors compared with the PpargWT and PtenNull tumors (P < 0.01; t test). P value refers to the enrichment in PpargINT derived samples vs. the other samples for a basal-like signature).
Fig. 3.
Fig. 3.
Down-regulation of PPARG reduces proliferation and invasion in vitro and lymph node metastasis in an in vivo prostate orthograft model. (A) Immunoblotting for PPARG, FASN, and ACC in PC3 cells demonstrating reduction of PPARG protein expression following siRNA, along with its effects on FASN and ACC expression. (B) Following siRNA-mediated knockdown of PPARG expression (controlled with NTsiRNA), PC3 cells were functionally assessed using (B) WST-1 proliferation assay, demonstrating reduced growth (n = 3, error bars represent SEM, *P < 0.01; Mann–Whitney), and (C) wound scratch assay, demonstrating reduced migration (n = 3, error bars represent SD, P < 0.001; ANOVA). (D) ELISA-based PPARG transcription reporter assay demonstrating that GW9662 treatment (20 and 50 μM) reduced PPARG transcriptional activity in PC3 and PC3M cells compared with DMSO controls (n = 3, error bars represent SEM, *P < 0.01; Mann–Whitney). Dotted red line signifies the background signal level. (E and F) Representative IHC staining and (G) boxplot of quantification of Ki-67 staining between vehicle control and GW9662-treated PC3 orthotopic prostate tumors (n = 6 vs. 6, 20× magnification, three fields per mouse, *P < 0.0001; Mann–Whitney). (H and I) Representative IHC staining and (J) boxplot quantification of FASN staining between vehicle control and GW9662-treated PC3 orthotopic prostate tumors (n = 6 vs. 6, 20× magnification, three fields per mouse, *P = 0.0004; Mann–Whitney). (K and L) Representative IHC staining and (M) boxplot quantification Pan-CK staining in the lymph nodes between vehicle control and GW9662-treated PC3 orthograft-bearing mice (n = 6 vs. 6, 20× magnification, three fields per mouse, *P < 0.0001; Mann–Whitney). (Red bar, 200 µm.)
Fig. S4.
Fig. S4.
(A) RT-PCR of PPARG in human CaP cell lines (*P < 0.0001; Mann–Whitney). (B) Representative immunoblotting of PPARG in human CaP cell lines. (C–E) Functional analysis of GW9662 treated PC3 cells: (C) WST-1 (n = 3, error bars represent SEM, *P < 0.05; Mann–Whitney), (D) colony forming assay (n = 3, error bars represent SEM, *P < 0.0001; Mann–Whitney), and (E) wound scratch assay demonstrate statistically significant reductions at GW9662 doses of 10 μM and upward (n = 3, error bars represent SD, P < 0.001; ANOVA). (F) mRNA levels of PPARG in siRNA mediated knockdown in PC3, PC3M, and DU145 cells (n = 3, error bars represent SEM, *P < 0.001; Mann–Whitney). (G) Immunoblotting of PPARG in PC3, PC3M, and DU145 cells demonstrating reduction of protein expression following siRNA knockdown of PPARG. Following siRNA-mediated knockdown of PPARG expression (controlled with NTsiRNA), PC3, PC3M, and DU145 cells were functionally assessed using (H) WST-1 proliferation assay, demonstrating reduced growth (n = 3, error bars represent SEM, *P < 0.01; Mann–Whitney); (I and J) wound scratch assay, demonstrating reduced migration (n = 3, error bars represent SD, P < 0.001; ANOVA); and (K and L) colony forming assay, demonstrating a reduction in number of colonies (n = 3, error bars represent SEM, *P < 0.0001; Mann–Whitney). (M) Overexpression of PPARG in DU145 cells demonstrates up-regulation of PPARG and FASN at the mRNA level (n = 3, error bars represent SEM, *P < 0.001; Mann–Whitney). (N) WST-1 proliferation assay, demonstrating increased growth (n = 3, error bars represent SEM, *P < 0.001; Mann–Whitney) and (O) wound scratch assay, demonstrating increased migration (n = 3, error bars represent SD, P < 0.01; ANOVA) following PPARG overexpression in DU145 cells compared with empty vector control (n = 3 repeated experiments for each of the panels, each tested in triplicate).
Fig. S4.
Fig. S4.
(A) RT-PCR of PPARG in human CaP cell lines (*P < 0.0001; Mann–Whitney). (B) Representative immunoblotting of PPARG in human CaP cell lines. (C–E) Functional analysis of GW9662 treated PC3 cells: (C) WST-1 (n = 3, error bars represent SEM, *P < 0.05; Mann–Whitney), (D) colony forming assay (n = 3, error bars represent SEM, *P < 0.0001; Mann–Whitney), and (E) wound scratch assay demonstrate statistically significant reductions at GW9662 doses of 10 μM and upward (n = 3, error bars represent SD, P < 0.001; ANOVA). (F) mRNA levels of PPARG in siRNA mediated knockdown in PC3, PC3M, and DU145 cells (n = 3, error bars represent SEM, *P < 0.001; Mann–Whitney). (G) Immunoblotting of PPARG in PC3, PC3M, and DU145 cells demonstrating reduction of protein expression following siRNA knockdown of PPARG. Following siRNA-mediated knockdown of PPARG expression (controlled with NTsiRNA), PC3, PC3M, and DU145 cells were functionally assessed using (H) WST-1 proliferation assay, demonstrating reduced growth (n = 3, error bars represent SEM, *P < 0.01; Mann–Whitney); (I and J) wound scratch assay, demonstrating reduced migration (n = 3, error bars represent SD, P < 0.001; ANOVA); and (K and L) colony forming assay, demonstrating a reduction in number of colonies (n = 3, error bars represent SEM, *P < 0.0001; Mann–Whitney). (M) Overexpression of PPARG in DU145 cells demonstrates up-regulation of PPARG and FASN at the mRNA level (n = 3, error bars represent SEM, *P < 0.001; Mann–Whitney). (N) WST-1 proliferation assay, demonstrating increased growth (n = 3, error bars represent SEM, *P < 0.001; Mann–Whitney) and (O) wound scratch assay, demonstrating increased migration (n = 3, error bars represent SD, P < 0.01; ANOVA) following PPARG overexpression in DU145 cells compared with empty vector control (n = 3 repeated experiments for each of the panels, each tested in triplicate).
Fig. S5.
Fig. S5.
Analysis of GW9662 treatment in mice bearing PC3 orthografts: a representative tumor from (A) vehicle control or (B) GW9662-treated mice, along with representative H&E staining showing similar histology. (Blue bar, 1 cm; red bar, 100 µm.) (C) Boxplot showing size of tumors from GW9662-treated mice compared with vehicle-treated controls (n = 6 vs. 6, P = 0.9143; Mann–Whitney). (D) Fasn mRNA levels were significantly reduced (n = 6 vs. 6, error bars represent SEM, *P < 0.001) in the GW9662-treated group (Mann–Whitney).
Fig. 4.
Fig. 4.
Kaplan–Meier survival analysis of patients with CaP showing PPARG and FASN up-regulation along with low levels of PTEN. Representative images of IHC for (A and B) PPARG and (C and D) FASN in human BPH and CaP. (Red bar, 100 µm.) Boxplots representing histoscores of (E) PPARG and (F) FASN in BPH and primary Gleason grade 3–5 CaP. Kaplan–Meier (log-rank test) survival curves of CaP patients on a background of low PTEN levels (below the median) with (G) high expression (above median) of PPARG [compared with low (below median) PPARG; P = 0.0015] and (H) high expression (above median) of FASN [compared with low (below median) FASN; P = 0.0006]. On a background of high pAKT level (above the median), (I) high expression (above median) of PPARG [compared with low (below median) PPARG; P = 0.0198] and (J) high expression (above median) of FASN [compared with low (below median) FASN; P = 0.0047].
Fig. S6.
Fig. S6.
Representative images of IHC for (A and B) PTEN and (C and D) pAKT in human BPH and CaP, respectively, from a previously published TMA (n = 229). (Red bar, 100 µm.) (Kaplan–Meier (log-rank test) survival curves of CaP patients on a background of high PTEN levels (above the median) who have (E) high expression (above median) of PPARG [compared with low (below median) PPARG; median of 4.79 vs. 4.885 y; P = 0.2554] and (F) high expression (above median) of FASN [compared with low (below median) FASN; median of 1.915 vs. 5.51 y; P = 0.0781]. Kaplan–Meier (log-rank test) survival curves of CaP patients on a background of low pAKT levels (below the median) who have (G) high expression (above median) of PPARG [compared with low (below median) PPARG; median of 5.2 vs. 6.36 y; P = 0.2078] and (H) high expression (above median) of FASN [compared with low (below median) FASN; median of 5.5 vs. 6.045 y; P = 0.2867].
Fig. S7.
Fig. S7.
(A) Data from cBio portal (www.cbioportal.org) demonstrating PPARG gene amplification or its up-regulated mRNA expression was found in 26% of castrate-resistant CaP specimens, with up-regulation of one or more of the lipid synthesis genes (FASN, ACC, ACLY). (B and C) Consistent with our data, Kaplan–Meier of MSKCC data demonstrating decreased of disease specific survival if one or more of these lipid synthesis genes are up-regulated (P = 0.0181).

References

    1. Andriole GL, et al. PLCO Project Team Mortality results from a randomized prostate-cancer screening trial. N Engl J Med. 2009;360(13):1310–1319. - PMC - PubMed
    1. Salmena L, Carracedo A, Pandolfi PP. Tenets of PTEN tumor suppression. Cell. 2008;133(3):403–414. - PubMed
    1. Taylor BS, et al. Integrative genomic profiling of human prostate cancer. Cancer Cell. 2010;18(1):11–22. - PMC - PubMed
    1. Robinson D, et al. Integrative clinical genomics of advanced prostate cancer. Cell. 2015;161(5):1215–1228. - PMC - PubMed
    1. Wang S, et al. Prostate-specific deletion of the murine Pten tumor suppressor gene leads to metastatic prostate cancer. Cancer Cell. 2003;4(3):209–221. - PubMed

Publication types