. 2016 Jun 30;534(7609):688-92.
doi: 10.1038/nature18601.

Basal forebrain projections to the lateral habenula modulate aggression reward

Affiliations

Basal forebrain projections to the lateral habenula modulate aggression reward

Sam A Golden et al. Nature. .

Abstract

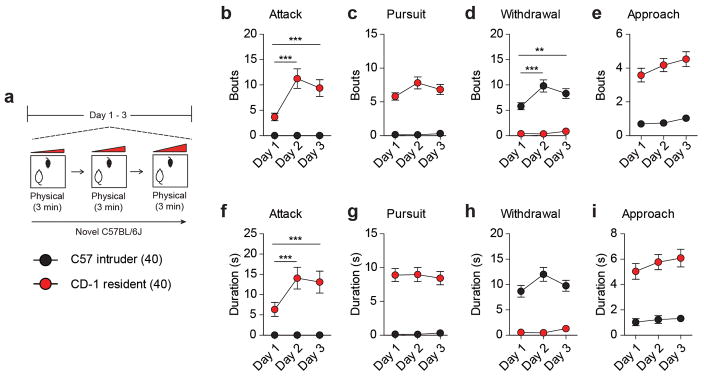
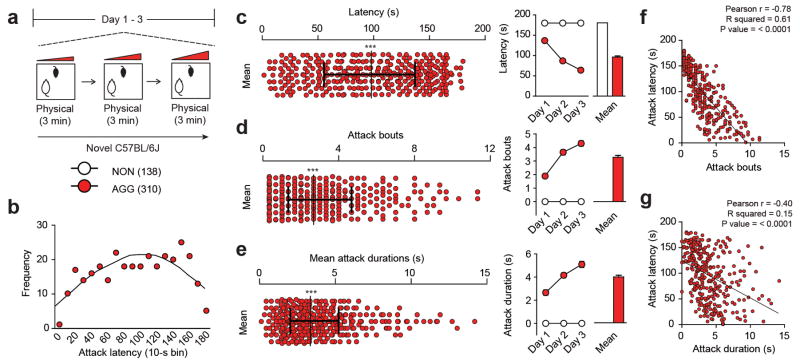
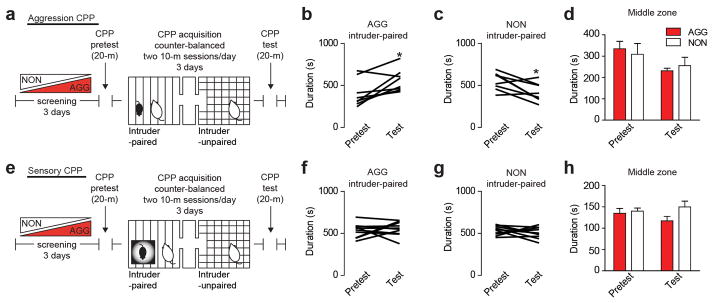
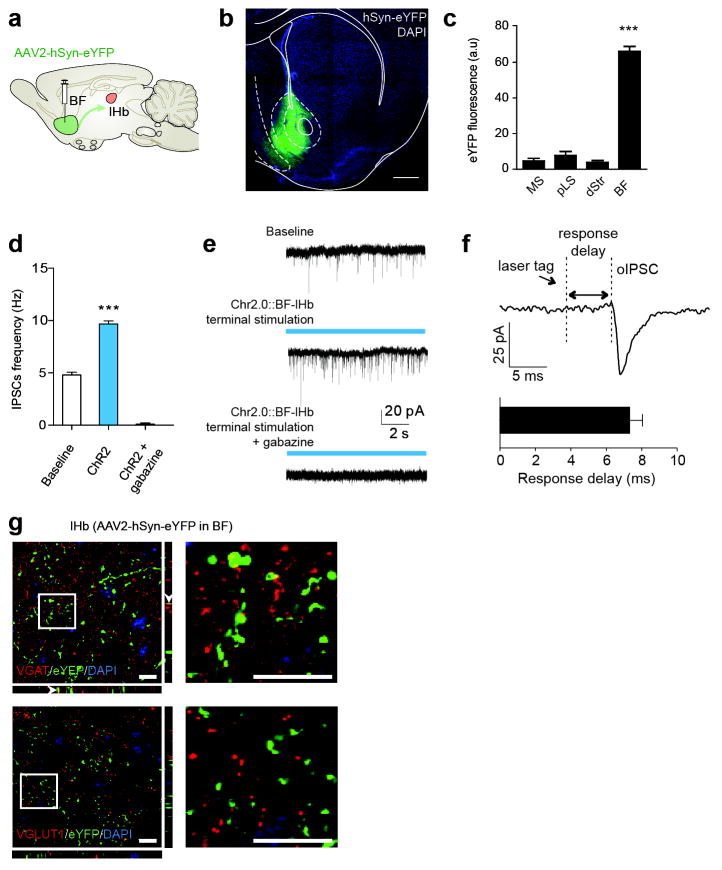
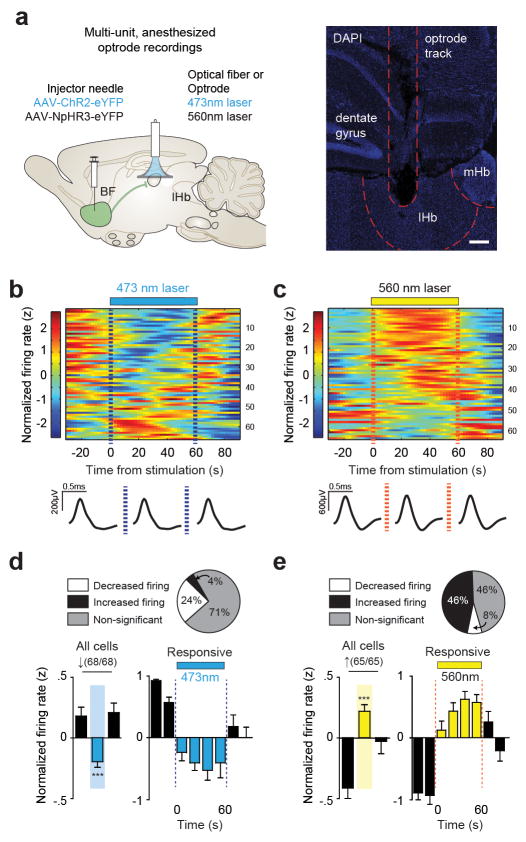
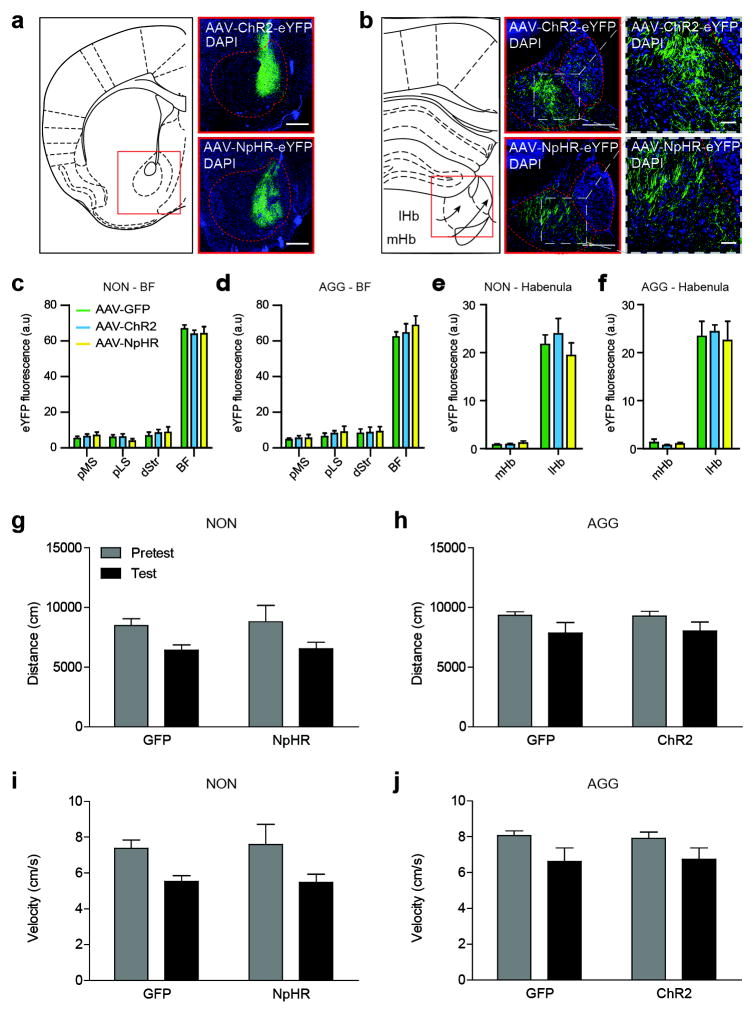
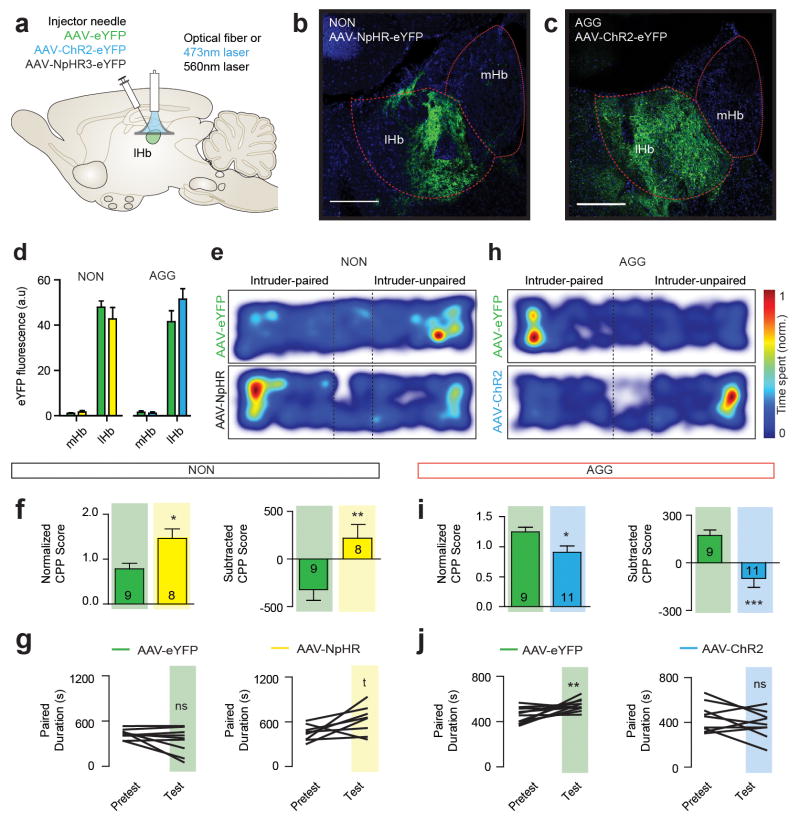
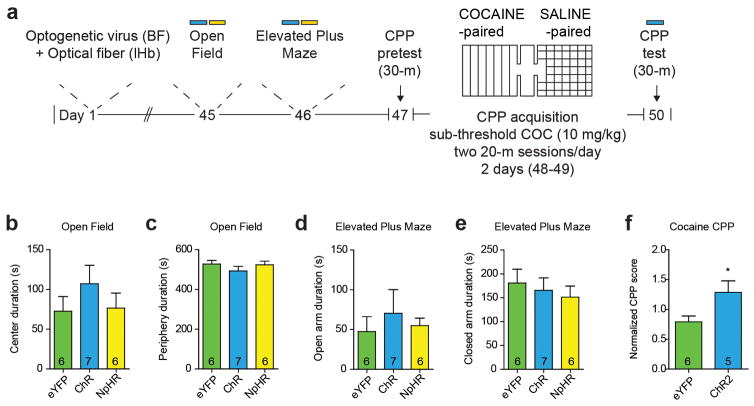
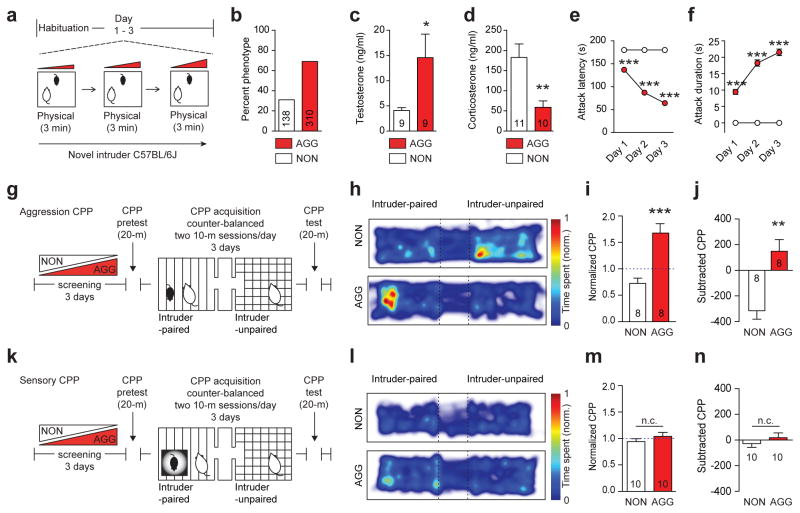
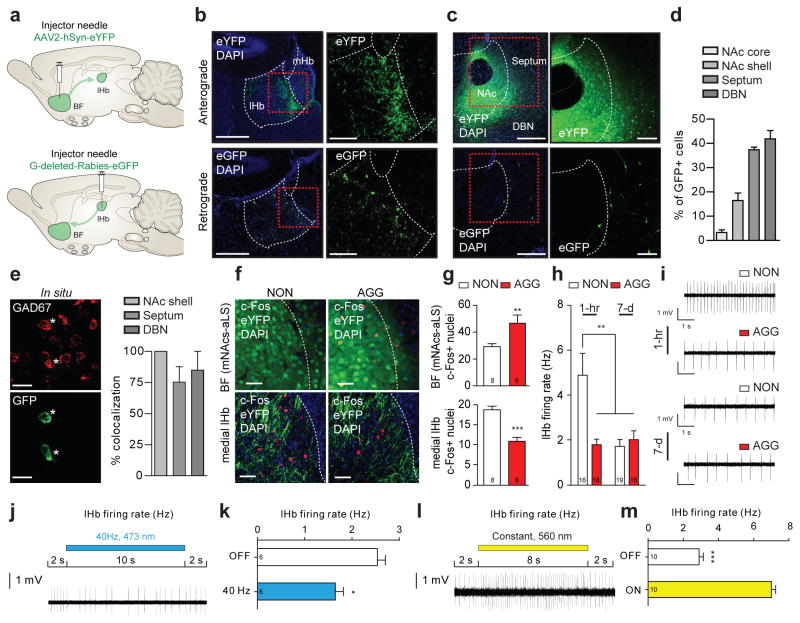
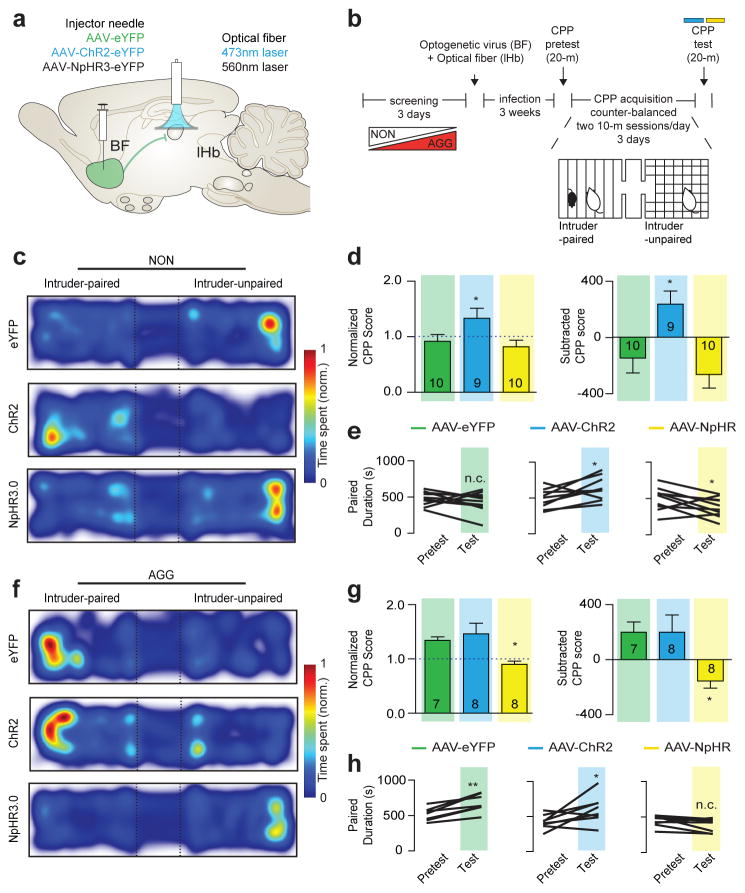
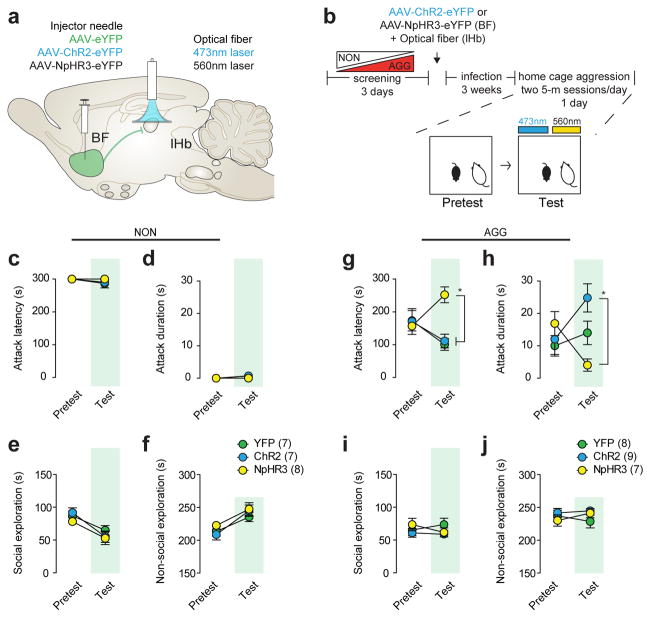
Maladaptive aggressive behaviour is associated with a number of neuropsychiatric disorders and is thought to result partly from the inappropriate activation of brain reward systems in response to aggressive or violent social stimuli. Nuclei within the ventromedial hypothalamus, extended amygdala and limbic circuits are known to encode initiation of aggression; however, little is known about the neural mechanisms that directly modulate the motivational component of aggressive behaviour. Here we established a mouse model to measure the valence of aggressive inter-male social interaction with a smaller subordinate intruder as reinforcement for the development of conditioned place preference (CPP). Aggressors develop a CPP, whereas non-aggressors develop a conditioned place aversion to the intruder-paired context. Furthermore, we identify a functional GABAergic projection from the basal forebrain (BF) to the lateral habenula (lHb) that bi-directionally controls the valence of aggressive interactions. Circuit-specific silencing of GABAergic BF-lHb terminals of aggressors with halorhodopsin (NpHR3.0) increases lHb neuronal firing and abolishes CPP to the intruder-paired context. Activation of GABAergic BF-lHb terminals of non-aggressors with channelrhodopsin (ChR2) decreases lHb neuronal firing and promotes CPP to the intruder-paired context. Finally, we show that altering inhibitory transmission at BF-lHb terminals does not control the initiation of aggressive behaviour. These results demonstrate that the BF-lHb circuit has a critical role in regulating the valence of inter-male aggressive behaviour and provide novel mechanistic insight into the neural circuits modulating aggression reward processing.


Conflict of interest statement

Competing financial interests

The authors wish to declare no competing financial interests.

Figures

Extended Data Figure 1
Extended Data Figure 1. Social behaviors exhibited by resident CD-1 and intruder C57 mice during aggression screening
(a) Experimental schematic of aggression screening procedure used in a subset (40 residents and 40 intruders) of mice to quantify social behaviors. Bouts of (b) attacks (F2,156 = 13.10, two-way ANOVA ***P < 0.0001; post hoc test ***P < 0.001; n = 40/group), (c) pursuits, (d) withdrawals (F2,156 = 5.745, two-way repeated measures ANOVA **P < 0.001; post hoc test ***P < 0.001; n = 40/group) and (e) non-aggressive social approaches. Duration of (f) attacks (F2,156 = 7.069, two-way repeated measures ANOVA **P < 0.001; post hoc test ***P < 0.001; n = 40/group), (g) pursuits, (h) withdrawals and (e) non-aggressive social approaches. All data are presented as mean ± SEM.
Extended Data Figure 2
Extended Data Figure 2. Detailed ethological analysis of AGG aggression-related behaviors
(a) Experimental schematic of aggression screening procedure used in a sample (448 mice total; 138 NON and 310 AGG) of mice. (b) Histogram of attack latency frequency using 10-s bins. Mean distribution across screening sessions (left) and individual screening sessions (right) for (c) latency to aggression (F2,1338 = 49.37, two-way repeated measures ANOVA P < 0.001; post hoc test, *P < 0.001; n = 138–310), (d) number of attack bouts (F2,1338 = 21.03, two-way repeated measures ANOVA P < 0.001; post hoc test, *P < 0.001; n = 138–310) and (e) mean attack duration (F2,1338 = 11.96, two-way repeated measures ANOVA P < 0.001; post hoc test, *P < 0.001; n = 138–310). Correlation of mean latency to initial aggression with (f) mean attack bouts (r = −0.78, P < 0.0001) and (g) mean duration of attack bouts (r = −0.40, P < 0.0001). Distribution plots are presented as the median with interquartile range and normality determined by D’Agostino-Pearson, Shapiro-Wilk and Kolmogorov-Smirnov normality tests (P < 0.0001). Summary data are represented as mean ± s.e.m.
Extended Data Figure 3
Extended Data Figure 3. Aggression CPP behavior
(a) Experimental schematic of aggression CPP procedure. Individual duration spent in the intruder-paired context for (b) AGG (t7 = 3.106, *P < 0.05; two-tailed paired t-test, n = 8/group) and (c) NON (t7 = 2.918, *P < 0.05; two-tailed paired t-test, n = 8/group). (d) Duration spent in the middle neutral chamber during pretest and test sessions. (e) Experimental schematic of sensory CPP procedure. Individual duration spent in the intruder-paired context for (f) AGG and (g) NON. (h) Duration spent in the middle neutral chamber during pretest and test sessions. Summary data are represented as mean ± s.e.m.
Extended Data Figure 4
Extended Data Figure 4. BF-lHb circuit tracing and GABAergic cell-type specificity
(a) Schematic of viral tracing strategy. Representative BF viral infection with (b) AAV2-hSyn-eYFP, scale bar 500 μm. Histological analysis of viral infection with (c) AAV2-hSyn-eYFP (F3,11 = 223.0, one-way ANOVA ***P < 0.0001, post hoc test, ***P < 0.0001; n = 3 mice, 3 slices/mouse) across adjacent anatomical regions. (d) Whole-cell electrophysiological recordings and (e) representative traces of lHb neurons photostimulated with AAV2-hSyn-ChR2.0 in the absence or presence of bath applied GABAA receptor antagonist gabazine (4 μm; F2,7 = 220, one-way ANOVA P < 0.05; post hoc test, ***P < 0.001, n =4,2,2 cells from 2 mice). (f) Optically evoked IPSC response delay (n= 21 oIPSC events, 2 mice). (g) Representative images of eYFPBF→lHb terminal co-localization between vesicular GABA transporter (top), and not vesicular glutamate transporter 1 (bottom). Scale bar is 10 μm in all panels; white arrows indicate colocalization within insets. VGAT, vesicular GABA transporter; VGLUT, vesicular glutamate transporter 1; DAPI, 4′,6-diamidino-2-phenylindole; BF, basal forebrain; lHb, lateral habenula; pLS, posterior lateral septum; MS, medial septum. Summary data are represented as mean ± s.e.m.
Extended Data Figure 5
Extended Data Figure 5. Multiunit anesthetized optrode recordings
(a) Schematic of in vivo anesthetized multi-unit optrode recording procedure (left) and representative optrode placement in lHb (right; scale bar = 200 μm). Heatmaps of normalized firing rates for lHb neurons in response to BF terminal stimulation with (b) ChR2BF→lHb or (c) NpHR3BF→lHb and averaged spike wave-form shown below for pre-stimulation, stimulation and post-stimulation epochs. (e) Percent of cells by firing response (top) and average normalized lHb firing rate (bottom) after BF-lHb terminal stimulation with ChR2BF→lHb for all identified cells (F2,134 = 8.249, one-way repeated-measure ANOVA P < 0.001; post hoc test, *P < 0.05; n = 68 cells from 3 mice) and cells that significantly decreased firing during the stimulation epoch (F7,105 = 8.868, one-way repeated-measure ANOVA P < 0.0001; post hoc test, *P < 0.05; n = 16/68 cells from 3 mice). (f) Percent of cells by firing response (top) and average normalized lHb firing rate (bottom) after BF-lHb terminal stimulation with NpHR3BF→lHb for all identified cells (F2,128 = 10.32, one-way repeated-measure ANOVA P < 0.0001; post hoc test, *P < 0.05; n = 65/65 cells from 3 mice) and cells that significantly increased firing during the stimulation epoch (F7,203 = 17.58, one-way repeated-measure ANOVA P < 0.0001; post hoc test, *P < 0.05; n = 30/65 cells from 3 mice). BF, basal forebrain; lHb, lateral habenula; mHb, medial habenula; DAPI, 4′,6-diamidino-2-phenylindole. Summary data are represented as mean ± s.e.m.
Extended Data Figure 6
Extended Data Figure 6. BF-lHb AAV infection and CPP locomotor behavior
(a) Schematic of BF coronal slice (left), alongside representative AAV-ChR2-eYFP (top) and AAV-NpHR3.0-eYFP (bottom) infections. Scale bar 500 μm. (b) Schematic of lHb coronal slice (left), alongside representative images of BF terminal infection by AAV-ChR2-eYFP (middle top) and AAV-NpHR3.0-eYFP (middle bottom) within the lHb, scale bar 200 μm. Representative close-ups of terminal regions shown in insets on right, scale bar 50 μm. All representative images counterstained with DAPI. Histological analysis of BF infection in (c) NON and (d) AGG mice. Histological analysis of habenular viral infection in (e) NON and (f) AGG mice. (g,h) Total distance travelled and (I,j) mean velocity between NON and AGG during the CPP pretest and test phase. All data are presented as mean ± SEM, and are not significant as determined by two-way ANOVA, P<0.05. NON, non-aggressor; AGG, aggressor; lHb, lateral habenula; mHb, medial habenula; BF, basal forebrain; dStr, dorsal striatum; pLS, posterior lateral septum; MS, medial septum; DAPI, 4′,6-diamidino-2-phenylindole.
Extended Data Figure 7
Extended Data Figure 7. Direct lHb stimulation bi-directionally modulates aggression reward
(a) Schematic of viral infection strategy. Representative images of lHb cell body infection in (b) NON and (c) AGG, scale bar 200 μm. (d) Histological analysis of lHb viral infection. (e) Representative CPP traces of NON. NON::NpHRlHb cell body infection mimics the physiological effect of NON::ChR2BF→lHb terminal stimulation. (f) Normalized CPP score (t15 = 2.834, *P < 0.05; two-tailed unpaired t-test, n = 8–9/group) and subtracted CPP score (t15 = 3.058, **P < 0.01; two-tailed unpaired t-test, n = 8–9/group) in NON::eYFPlHb and NON::NpHRlHb. (g) Individual duration spent in the intruder-paired context for NON::eYFPlHb (t9 = 0.9129, P > 0.05; two-tailed paired t-test, n = 10/group) and NON::NpHRlHb (t9 = 2.344, *P < 0.05; two-tailed paired t-test, n = 10/group). (h) Representative CPP traces of AGG::eYFPlHb and AGG::ChR2lHb. (i) Normalized CPP score (t18 = 2.692, *P < 0.05; two-tailed unpaired t-test, n = 9–11/group) and subtracted CPP score (t18 = 4.203, ***P < 0.01; two-tailed unpaired t-test, n = 9–11/group) for the intruder-paired context in AGG::eYFPlHb and AGG::ChR2lHb. (j) Individual duration spent in the intruder-paired context for AGG::eYFPlHb mice (t10 = 3.212, **P < 0.01; two-tailed paired t-test, n = 9/group) and AGG::ChR2lHb mice (t8 = 1.348, P < 0.05; two-tailed paired t-test, n = 11/group). Summary data are represented as mean ± s.e.m. NON, non-aggressor; AGG, aggressor; lHb, lateral habenula; mHb, medial habenula; BF, basal forebrain; dStr, dorsal striatum.
Extended Data Figure 8
Extended Data Figure 8. BF-lHb stimulation modulates cocaine CPP
(a) Experimental timeline of general anxiety and cocaine CPP testing. BF-lHb stimulation during (b–c) open field testing and (d–e) elevated plus maze testing. (f) Subthreshold cocaine (10 mg/kg, i.p.) CPP procedure with BF-lHb stimulation during CPP test (t9 = 2.403, P < 0.05; two-tailed unpaired t-test, n = 5–6/group).
Figure 1
Figure 1. Individual differences in aggression-related reward behavior
(a) Aggression screening experimental schematic. (b) Percent mice exhibiting aggressive (AGG) versus non-aggressive (NON) behaviors. (c) Serum testosterone (t16 = 2.23, *P < 0.05; two-tailed unpaired t-test, n = 9/group) and (d) corticosterone (t19 = 3.231, **P < 0.01; two-tailed unpaired t-test, n = 10–11/group). Mean (e) latency to attack (F2,1338 = 49.37, two-way ANOVA P < 0.001; post hoc test, ***P < 0.001; n = 138–310) and (f) attack duration (F2,1338 = 22.35, two-way ANOVA P < 0.001; post hoc test, ***P < 0.001; n = 138–310). (g) Aggression conditioned place preference (CPP) schematic. (h) Representative heatmaps of aggression CPP. (i) Normalized (t14 = 4.706, ***P < 0.001; two-tailed unpaired t-test, n = 8/group) and (j) subtracted CPP score (t14 = 4.013, **P < 0.01; two-tailed unpaired t-test, n = 8/group). (k) Sensory CPP schematic. (l) Representative heatmaps of sensory CPP. (m) Normalized (t18 = 1.023, P > 0.05; two-tailed unpaired t-test, n = 10/group) and (n) subtracted CPP score (t18 = 0.961, P > 0.05; two-tailed unpaired t-test, n = 10/group). Summary data are represented as mean ± s.e.m. NON, non-aggressor; AGG, aggressor; n.c., no change.
Figure 2
Figure 2. GABAergic BF-lHb circuit is differentially activated by intruder interactions
(a) Schematic of anterograde and retrograde tracing strategies. (b) Representative anterograde AAV2-hSyn-eYFP infections (top, terminals) or retrograde G-deleted-Rabies-eGFP infections (bottom, infection site) in lHb. Scale bars 500 μm, insets 150 μm. (c) Representative anterograde AAV2-hSyn-eYFP infections (top, infection site) or retrograde G-deleted-Rabies-eGFP infections (bottom, cell bodies) in the BF. Scale bars 400 μm, insets 200 μm. (d) Percent retrograde labeled eGFP+ neurons within subnuclei of the anterior BF (n = 3 mice, ~229 cells/mouse). (e) Representative in situ hybridization co-localized GAD67 and eGFP in DBN (left) and quantification (right) within the BF (n = 3 mice, 14 cells/mouse). Scale bars 20 μm. (f) Representative images of AAV2-hSyn-eYFP infection and c-Fos IR in medial NAc shell transition zone of the BF (top) and medial lHb terminals (bottom). Scale bars 30 μm. (g) Quantification of c-Fos IR in the medial NAc shell-septum transition zone (t8 = 2.655, *P < 0.05; two-tailed unpaired t-test, n = 6–8 mice/group, 3 slices/mouse) and medial lHb (t12 = 5.678, ***P < 0.001; two-tailed unpaired t-test, n = 6–8 mice/group, 3 slices/mouse). (h) Firing rate of lHb neurons in AGG and NON at 1-hr or 7 days post intruder interaction (F1,67 = 10.56, two-way ANOVA P < 0.05; post hoc test, **P < 0.01; n = 16–19 cells/group, 4–5 mice/group). (i) Representative traces of lHb in vitro cell-attached firing rates. (j) Representative traces of lHb in vitro cell-attached firing rates during ChR2BF→lHb photostimulation. (k) Average firing rates of lHb neurons during ChR2BF→lHb (t10 = 3.679, **P < 0.01; two-tailed unpaired t-test, n = 6 cells). (l) Representative traces of lHb in vitro cell-attached firing rates during NpHR3BF→lHb photostimulation. (m) Average firing rates of lHb neurons during NpHR3BF→lHb (t18 = 11.68, ***P < 0.0001; two-tailed unpaired t-test, n = 10 cells) photostimulation. Data represented as mean ± s.e.m. NON, non-aggressor; AGG, aggressor; lHb, lateral habenula; mHb, medial habenula; BF, basal forebrain; NAc, nucleus accumbens; DBN, diagonal band nuclei; DAPI, 4′,6-diamidino-2-phenylindole.
Figure 3
Figure 3. BF-lHb activity bi-directionally modulates aggression reward
Schematic of (a) optogenetic viral infection strategy and (b) aggression CPP procedure. Representative CPP heatmaps for eYFPBF→lHb, ChR2BF→lHb and NpHR3BF→lHb between (c) NON and (f) AGG mice. (d) Normalized (F2,26 = 5.019, one-way ANOVA P < 0.05; post hoc test, *P < 0.05, n = 9–10/group) and subtracted CPP score (F2,26 = 6.666, one-way ANOVA P < 0.01; post hoc test, *P < 0.05, n = 9–10/group) in NON::eYFPBF→lHb, NON::ChR2BF→lHb and NON::NpHr3BF→lHb. (e) Individual duration in intruder-paired context for NON::eYFPBF→lHb mice (t9 = 0.9129, P > 0.05; two-tailed paired t-test, n = 10/group), NON::ChR2BF→lHb mice (t8 = 2.362, *P < 0.05; two-tailed paired t-test, n = 9/group), and NON::NpHRBF→lHb mice (t9 = 2.344, *P < 0.05; two-tailed paired t-test, n = 10/group) during the Pretest and Test sessions. (g) Normalized (F2,20 = 5.470, one-way ANOVA P < 0.05; post hoc test, *P < 0.05, n = 7–8/group) and subtracted CPP score (F2,20 = 4.964, one-way ANOVA P < 0.05; post hoc test, *P < 0.05, n = 7–8/group) for intruder-paired context in AGG::eYFPBF→lHb, AGG::ChR2BF→lHb and AGG::NpHr3BF→lHb. (h) Individual duration in intruder-paired context for AGG::eYFPBF→lHb mice (t6 = 5.070, **P < 0.01; two-tailed paired t-test, n = 7/group), AGG::ChR2BF→lHb mice (t7 = 2.394, *P < 0.05; two-tailed paired t-test, n = 8/group), and AGG::NpHRBF→lHb mice (t7 = 1.763, P > 0.05; two-tailed paired t-test, n = 8/group). Summary data are represented as mean ± s.e.m. NON, non-aggressor; AGG, aggressor; lHb, lateral habenula; BF, basal forebrain; n.c., no change.
Figure 4
Figure 4. BF-lHb does not initiate attack but modulates aggression severity
(a) Schematic of optogenetic (a) viral infection strategy and (b) aggression procedure. NON (c) attack latency, (d) attack duration, (e) social exploration and (f) non-social exploration behaviors in pretest and test sessions (non-significant, n = 7–8/group). AGG (g) attack latency (F2,42 = 6.01, two-way ANOVA P <0.001, *P<0.05, n = 7–9/group), (h) attack duration (F2,42 = 5.666, two-way ANOVA P <0.001, *P<0.05, n = 7–9/group), (i) social exploration and (j) non-social exploration behaviors in pretest and test sessions. NON, non-aggressor; AGG, aggressor; lHb, lateral habenula; BF, basal forebrain.

References

    1. Anderson DJ. Optogenetics, sex, and violence in the brain: implications for psychiatry. Biol Psychiatry. 71:1081–1089. doi: 10.1016/j.biopsych.2011.11.012. - DOI - PMC - PubMed
    1. Decety J, Michalska KJ, Akitsuki Y, Lahey BB. Atypical empathic responses in adolescents with aggressive conduct disorder: a functional MRI investigation. Biological psychology. 2009;80:203–211. doi: 10.1016/j.biopsycho.2008.09.004. - DOI - PMC - PubMed
    1. Yang CF, et al. Sexually dimorphic neurons in the ventromedial hypothalamus govern mating in both sexes and aggression in males. Cell. 2013;153:896–909. doi: 10.1016/j.cell.2013.04.017. - DOI - PMC - PubMed
    1. Wasman M, Flynn JP. Directed attack elicited from hypothalamus. Arch Neurol. 1962;6:220–227. - PubMed
    1. Lin D, et al. Functional identification of an aggression locus in the mouse hypothalamus. Nature. 2011;470:221–226. doi: 10.1038/nature09736. - DOI - PMC - PubMed

Publication types

MeSH terms