. 2016 Jun 30;534(7609):700-4.
doi: 10.1038/nature18310.

Coordinating cardiomyocyte interactions to direct ventricular chamber morphogenesis

Affiliations

Coordinating cardiomyocyte interactions to direct ventricular chamber morphogenesis

Peidong Han et al. Nature. .

Abstract

Many organs are composed of complex tissue walls that are structurally organized to optimize organ function. In particular, the ventricular myocardial wall of the heart comprises an outer compact layer that concentrically encircles the ridge-like inner trabecular layer. Although disruption in the morphogenesis of this myocardial wall can lead to various forms of congenital heart disease and non-compaction cardiomyopathies, it remains unclear how embryonic cardiomyocytes assemble to form ventricular wall layers of appropriate spatial dimensions and myocardial mass. Here we use advanced genetic and imaging tools in zebrafish to reveal an interplay between myocardial Notch and Erbb2 signalling that directs the spatial allocation of myocardial cells to their proper morphological positions in the ventricular wall. Although previous studies have shown that endocardial Notch signalling non-cell-autonomously promotes myocardial trabeculation through Erbb2 and bone morphogenetic protein (BMP) signalling, we discover that distinct ventricular cardiomyocyte clusters exhibit myocardial Notch activity that cell-autonomously inhibits Erbb2 signalling and prevents cardiomyocyte sprouting and trabeculation. Myocardial-specific Notch inactivation leads to ventricles of reduced size and increased wall thickness because of excessive trabeculae, whereas widespread myocardial Notch activity results in ventricles of increased size with a single-cell-thick wall but no trabeculae. Notably, this myocardial Notch signalling is activated non-cell-autonomously by neighbouring Erbb2-activated cardiomyocytes that sprout and form nascent trabeculae. Thus, these findings support an interactive cellular feedback process that guides the assembly of cardiomyocytes to morphologically create the ventricular myocardial wall and more broadly provide insight into the cellular dynamics of how diverse cell lineages organize to create form.


Figures

Extended Data Figure 1
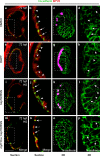
Extended Data Figure 1. Notch signaling is dynamically activated in the endocardium and myocardium during heart development
a-f, Confocal slices of Tg(Tp1:d2GFP; myl7:mCherry) hearts reveal that Notch signaling is in the ventricular endocardium (yellow arrows) but not in the myocardium at 24 hpf (n = 11) and 36 hpf (n = 8), g-i, but becomes restricted to the AV and OFT endocardium by 48 hpf (n = 12). j-o, Tg(Tp1:d2GFP; kdrl:ras-mCherry) confocal imaging confirms that Tp1:d2GFP is expressed in the ventricular endocardium at (j-l) 24 hpf (n = 8) but becomes localized to the AV or OFT endocardium as well as non-endocardial cells in the outer ventricular myocardial wall (white arrows) by (m-o) 96 hpf (n = 10). p, q, 3D confocal reconstructions of the (p) exterior and (q) interior regions of 72 hpf Tg(Tp1:d2GFP; myl7:mCherry) hearts reveal that Notch-activated Tp1:d2GFP+ cells are present in cardiomyocyte clusters (green, numbers in parentheses) and excluded from nascent cardiac trabeculae (pseudo-color magenta, numbers). r, Graph shows that the number of cardiac trabeculae (x-axis) and Tp1:d2GFP+ cardiomyocyte clusters (y-axis) are similar within the ventricle (n = 30) at 72 hpf. Size of dots indicates the number of embryos with a particular number of trabeculae and Tp1:d2GFP+ clusters. Line represents a linear regression fitted to the data. s, t, Myocardial anti-MHC/MF20 immunostaining of Tg(Tp1:d2GFP) hearts reveals a loss of myocardial Tp1:d2GFP Notch reporter signal at 30 and 90 dpf hearts (n = 5 hearts per stage). White arrows – likely Tp1:d2GFP+ cardiomyocytes, yellow arrows – Tp1:d2GFP+ endocardial cells. White and yellow asterisks – AV and OFT. Dashed line in s outlines ventricle. V– ventricle; A – atrium. Scale bar 25 μm.
Extended Data Figure 2
Extended Data Figure 2. DAPT treatment validates that the Notch reporter Tp1:d2GFP monitors dynamic Notch signaling more closely than Tp1:eGFP, and reveals opposing roles of Notch signaling on trabeculation at different developmental stages
a-d, At 48hpf, (a) Tp1:d2GFP expression is restricted to the AV and OFT endocardium (n = 8/8 embryos) whereas (c) Tp1:eGFP is expressed in the ventricular, AV and OFT endocardium (n = 6/6). However, gfp mRNA is primarily expressed in the AV and OFT regions in both (b) Tg(Tp1:d2GFP; myl7:mCherry) (n = 10/10) and (d) Tg(Tp1:eGFP; myl7:mCherry) embryos (n = 5/5), revealing that Tp1:d2GFP expression most closely matches Notch reporter activity. e-h, After 24 hour DAPT treatments of (e, f) Tg(Tp1:d2GFP; myl7:H2A-mCherry) and (g, h) Tg(Tp1:eGFP; myl7:H2A-mCherry) embryos at 72 hpf, (f) Tp1:d2GFP is more diminished throughout the heart at 96 hpf (n = 8/10) compared to (h) Tp1:eGFP (n = 6/7), confirming Tp1:d2GFP signal more faithfully recapitulates Notch signaling dynamics. m-p, Tg(Tp1:d2GFP; myl7:mCherry) hearts DAPT-treated from 60-72 hpf exhibit increased trabeculation (white arrowheads) and diminished Tp1:d2GFP Notch reporter activity (n = 12/16) compared to (i-l) DMSO-treated hearts (n = 0/20). However, (r) Tg(myl7:mCherry) hearts DAPT-treated from 20 to 48 hpf exhibit reduced trabeculae at 120 hpf (n = 12/15) when compared to (q) DMSO treated hearts (n = 0/20). s, Graph represents trabeculae/total ventricular area in embryos treated with DMSO or DAPT in q and r. White and yellow arrows – myocardial and endocardial Notch reporter activity. White arrowheads – trabeculae. White and yellow asterisks – AV and OFT. Scale bar 25 μm. Mean +/− s.e.m. *p < 0.05 by Student's t-test.
Extended Data Figure 3
Extended Data Figure 3. Tp1:eGFP labels the ventricular outer wall during early cardiac development, which becomes the distinctive ventricular primordial myocardium in adults
Using the Tp1:eGFP Notch reporter which exhibits greater fluorescence perdurance than Tp1:d2GFP, we performed limited fate mapping of Notch activated cardiac cells during ventricular morphogenesis. a-d, Tp1:eGFP is expressed not only in ventricular cardiomyocytes (red nuclei, white arrows) at 72 hpf but also throughout the ventricular endocardium due to eGFP perdurance (yellow arrows) (n = 12). c, d, Although diminishing in the ventricular endocardium (yellow arrows) at 96 hpf (n = 14), Tp1:eGFP expands in the outer ventricular myocardial wall (white arrows), yet is notably absent from myocardial trabeculae (white arrowheads). e, f, By 30 and 45 dpf (n = 6, n = 5), Tp1:eGFP remains in the peripheral ventricular (primordial) myocardial layer, which is one-cardiomyocyte thick (myl7:H2A-mCherry+/red and MF20+/blue), but is reduced in the ventricular but not the AV or OFT endocardium. g-i, At 60 dpf (n = 5), (h) new cardiomyocytes (cortical layer, yellow arrowheads) form over the Tp1:eGFP+ primordial myocardium (white arrows) at the ventricular myocardial base (yellow box in g) and extends toward the apex where (i)Tp1:eGFP+ cardiomyocytes (white arrows) still remain the outer most layer of the ventricular myocardium (white box in g). j, However, by 90 dpf (n = 5), this new cortical myocardial layer (yellow arrowheads) spreads over the apical Tp1:eGFP+ ventricular primordial myocardium (white arrows). k-m, In adult hearts (90 dpf), Tp1:eGFP is primarily found in the (k, n = 5) myl7:H2A-mCherry+ primordial myocardium but not in the (l, n = 5) endocardium marked by kdrl:ras-mCherry, nor (m, n = 3) epicardium marked by Raldh2 localization. n-t, Adult hearts (6 months) were further examined to assess the cellular attributes of the primordial layer. n, Anti-MHC/MF20 immunostaining confirms that Tp1:eGFP+ cardiac cells are myocardial (n = 5). o, Anti-α–actinin immunostaining reveals that trabecular (white arrowheads) and cortical (yellow arrowheads) cardiomyocytes display organized sarcomeric structures but the Tp1:eGFP+ primordial cardiomyocytes (arrows) do not (n = 7). p-t, Wheat germ agglutinin (WGA) staining shows that (p, q) the Tp1:eGFP+ primordial myocardial layer is surrounded by extensive extracellular matrix (n = 5) and that (r-t) Tg(myl7:ras-eGFP) primordial cardiomyocytes display a thin cellular morphology compared to other ventricular cardiomyocytes (n = 10). q is a X-Z reconstruction of confocal stacks from Tp1:eGFP and WGA stainings at the dashed line shown in p. b, d, h-i, t are magnifications of the boxed area in a, c, g, s, respectively. White and yellow arrows – myocardial and endocardial Tp1:eGFP. White and yellow arrowheads – trabeculae and cortical layer. White and yellow asterisks – AV and OFT. Scale bar 25 μm.
Extended Data Figure 4
Extended Data Figure 4. Bmp signaling, which marks trabeculae, is required for expanding but not initiating trabeculae formation and has no effect on myocardial Notch activity
a-l, Tg(BRE:d2GFP; myl7:mCherry) hearts were treated with (a-c) DMSO, (d-f) DAPT, (g-i) AG1478 or (j-l) Dorsomorphin at 60 hpf and imaged at 72 hpf. a-c, DMSO treated hearts express the BRE:d2GFP BMP reporter in trabeculae (arrowheads) and in the AV myocardium (yellow arrows, n = 11/11 embryos). d-f, DAPT treated hearts exhibit increased trabeculation and BRE:d2GFP expression in these forming trabeculae (arrowheads, n = 9/12). g-i, AG1478 treated hearts fail to form trabeculae (n = 9/10) and only express the BRE:d2GFP BMP reporter in the AV myocardium (yellow arrow). j-l, Dorsomorphin treated hearts form cardiac trabeculae (arrowheads) but fail to express the BRE:d2GFP BMP reporter in both cardiac trabeculae and the AV myocardium (n = 10/12). m-p, Treating Tg(Tp1:d2GFP; myl7:mCherry) embryos with Dorsomorphin from 60-72 hpf did not affect the initiation of trabeculae (arrowheads) nor the activation of myocardial Notch signaling (white arrows, n = 13/16) compared to treating with DMSO (see Extended Data Fig. 2i-l). q, r, Although Tg(myl7:mCherry) hearts treated with (q) DMSO or (r) Dorsomorphin from 60 hpf to 7 dpf form similar numbers of trabeculae (arrowheads), Dorsomorphin-treated hearts display trabeculae that are stunted/reduced in size (n = 12/15) when compared to DMSO-treated control hearts (n = 0/15). s, Graph reveals a significant reduction in the trabecular/ventricular area ratio in Dorsmorphin-treated fish compared to DMSO-treated controls. Arrowheads – trabeculae, yellow arrows – AV myocardium, white arrows – Tp1:d2GFP+ myocardium. White asterisks – AV. Mean +/− s.e.m. *p < 0.05 by Student's t-test. Scale bar 25 μm.
Extended Data Figure 5
Extended Data Figure 5. Altering myocardial Notch signaling affects ventricular size and wall thickness but not total number of ventricular cardiomyocytes
a-d, The Tg(myl7:Cre) transgenic line used to specifically perturb Notch signaling in the myocardium was validated by confirming that Cre expression is restricted to the myocardium. myl7:Cre activity as visualized by (c) GFP expression from the switch line, β-act2:RSG, exclusively overlaps with (b, d) myl7:Cerulean expression at 120 hpf (n = 10 embryos). Quantitative analyses of (e) ventricular size and (f) wall thickness performed on confocal images from Figure 2a-h reveal that myocardial Notch signaling restricts ventricular size while promoting ventricular wall thickness. e, Ventricular size measurements were normalized to respective controls for each condition. f, Individual measurements (dots) of myocardial thickness were taken across the outer curvature of the ventricle (n = 30 measurements, 6 measurements were taken per embryo, 5 embryos per condition). Dashed line represents the ventricular wall thickness that distinguishes trabeculated myocardial thickness from ventricular outer wall myocardial thickness in control hearts. Crosses denote mean and s.e.m. g-p, Quantitative analysis of (g) trabecular cardiomyocytes and (p) total ventricular cardiomyocytes was calculated by counting myocardial nuclei labeled with myl7:H2A-mCherry or anti-Mef2 immunostaining using embryos from Figure 2i-p for (g), or from 3D reconstructions in (h-o) for (p). In (g), trabecular/total ventricular cardiomyocytes was used to calculate the percentage of trabecular cardiomyocytes for each condition. In (p), total ventricular cardiomyocytes were normalized to respective controls for each condition. n – number of embryos analyzed per condition. Mean +/− s.e.m. *p < 0.05 by Student's t-test. n.s. – not significant. Scale bar 25 μm.
Extended Data Figure 6
Extended Data Figure 6. Myocardial Notch activation can inhibit the formation and expansion of cardiac trabeculae at various cardiac developmental stages
a-g, Tg(myl7:Cre; hsp70l:RSN) and Tg(hsp70l:RSN) (control) embryos were heat-shocked (HS) during various developmental time windows as indicated and imaged at 7 dpf to assess the effects of constitutive myocardial Notch signaling on cardiac trabeculae formation. a, Red arrows in schematic indicate the time points in which embryos in the corresponding panels were heat-shocked. b, Control Tg(hsp70l:RSN) embryos heat-shocked from 60 hpf to 7 dpf ubiquitously express mCherry but do not overexpress myocardial NICD. They form cardiac trabeculae (arrowheads) similar to wild-type embryos (control, n = 14/15). c, However, Tg(myl7:Cre; hsp70l:RSN) embryos heat-shocked from 60 hpf to 7 dpf overexpress NICD-P2A-Emerald throughout the myocardium and fail to form cardiac trabecuale (n = 9/12). Although Tg(myl7:Cre; hsp70l:RSN) embryos heat-shocked at (d) 80 hpf – 7 dpf, (e) 96 hpf – 7 dpf, and (f) 120 hpf – 7 dpf form trabeculae, these embryos exhibit stunted/smaller trabeculae after heat-shocking (n = 9/10, 10/14, 12/16, respectively). g, Graph of trabeculae/total ventricular area of heat-shocked embryos from b-f, shows that myocardial Notch over-activation inhibits the progression of cardiac trabeculae formation. h, i, Although heat-shocking Tg(myl7:Cre; hsp70l:RSN) from 60-120 hpf initially inhibits trabeculae formation, (i) the ventricular myocardium (detected by anti-MHC/MF20 immunostaining – magenta) can still form trabeculae albeit at reduced numbers (n = 4/5) by 30 dpf after stopping NICD overexpression when compared to (h) heat-shocked Tg(hsp70l:RSN) hearts (control, n = 0/8). HS – heat-shock. White arrowheads – trabeculae. Scale bar 25 μm. Mean +/− s.e.m. *p < 0.05 by Student's t-test.
Extended Data Figure 7
Extended Data Figure 7. Notch signaling regulates cardiomyocyte cell junctions during cardiac trabeculae formation
a-d, In DMSO treated (control) 72 hpf wild-type hearts, N-cadherin is localized at cell junctions of cardiomyocytes within the ventricular outer wall (arrows) but redistributes away from these cell-cell contacts in cardiomyocytes that extend into the lumen to form trabeculae (arrowheads) (n = 12/12). e-h, Notch inhibition by DAPT treatment promotes N-cadherin redistribution and results in increased trabeculation (n = 8/11). m-p, Conversely, myocardial Notch activation by heat shocking (HS) Tg(myl7:Cre; hsp70l:RSN) leads to diminished N-cadherin redistribution and reduced trabeculation (n = 7/10) compared to (i-l) heat-shocked Tg(hsp70l:RSN) control hearts (n = 0/10). Nascent cardiac trabeculae were pseudo-colored magenta in (c, g, k). b, d, f, h, j, l, n, p, Insets are magnifications of a, c, e, g, i, k, m, o boxed areas, respectively. Arrowheads – N-cadherin redistributed from cell-cell contacts, arrows – N-cadherin at cell-cell contacts within outer wall. Scale bar 25 μm.
Extended Data Figure 8
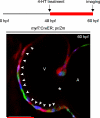
Extended Data Figure 8. Tamoxifen treatment of Tg(myl7:CreER; priZm) embryos at 48 hpf labels adjacent individual cardiomyocytes with combinations of distinct fluorescent colors
Tg(myl7:CreER; priZm) embryos were treated with 4-HT at 48 hpf and confocal imaged at 60 hpf prior to the initiation of cardiomyocytes forming trabeculae. Individual cardiomyocytes (arrowheads) are labeled with distinct combinations of fluorescent proteins allowing for tracking of specific cardiomyocyte clones (n = 6). White arrowheads – cardiomyocytes. V – ventricle, A – atrium. White asterisk – AV. Scale bar 25 μm.
Extended Data Figure 9
Extended Data Figure 9. Notch and Erbb2 signaling pathways form a feedback loop during cardiac trabeculation
a-c, Compared to (a) DMSO-treated Tg(Tp1:d2GFP; myl7:mCherry) (controls) embryos, (b) inhibiting Erbb2 function with AG1478 from 60-72 hpf blocks trabeculation and myocardial Notch signaling (n = 14/17), confirming erbb2 MO and mutant phenotypes. c, However, Notch inhibition using DAPT cannot reverse the AG1478/Erbb2 inhibition effect on trabeculae formation (n = 11/12). d, e, Consistent with these results, (d) control MO-injected Tg(hsp70l:dnM; myl7:mCherry) embryos expressing heat-shock induced dnMAML from 60-72 hpf display increased trabeculation (arrowheads, n = 9/11); (e) however, erbb2 MO-injected embryos expressing heat-shock induced dnMAML fail to display trabeculae (n = 9/12) as similarly observed in erbb2 MO-injected embryos alone (Fig. 3). f-j, erbb2 fluorescent in situ hybridization and GFP co-immunostaining performed on 72 hpf Tg(Tp1:d2GFP) hearts reveal that erbb2 is expressed in an intermittent pattern across the ventricular wall and is specifically diminished in Tp1:d2GFP+ cells (arrows) (n = 6/6). l, p, Heat-shocked (HS) Tg(myl7:Cre; hsp70l:RSN) hearts, which exhibit constitutively activated myocardial Notch signaling (NICD) from 60-120 hpf, minimally express erbb2 in the myocardium (n = 8/11) compared to (k, o) heat-shocked Tg(hsp70l:RSN) control hearts (n = 0/20) at 120 hpf. Compared to (m, q) DMSO treated control hearts (n = 0/10), (n, r) Notch-inhibited hearts by DAPT treatment from 60-72 hpf exhibit increased myocardial erbb2 expression as well as more trabeculae at 72 hpf (n = 8/10), supporting that Notch signaling inhibits erbb2 expression. h, i-j are magnifications of boxed areas in g, h. Arrowheads – trabeculae, arrows – Tp1:d2GFP+ cardiomyocytes. White and yellow asterisks – AV and OFT. Scale bar 25 μm.
Extended Data Figure 10
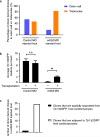
Extended Data Figure 10. Transplanted wild-type cardiomyocytes non-cell-autonomously activate Notch signaling in erbb2 morphant host cardiomyocytes
a, Based on mosaic embryo studies from Figure 3f-i, wild-type donor cardiomyocytes contribute equally to the outer ventricular wall (14/26 clones) or the trabeculae (12/26 clones) when transplanted into control MO host embryos (n = 12 embryos). However, when wild-type donor cells are transplanted into erbb2 MO host embryos (n = 10 embryos), they contribute more to the trabecular layer (19/23 clones) than to the ventricular outer wall (4/23 clones, Fisher's exact test p < 0.05). b, Based on mosaic embryo studies from Figure 3f-i, transplanting wild-type donor cells increases the number of erbb2 MO host cardiomyocytes expressing Tp1:d2GFP (n = 10 embryos) compared to non-transplanted erbb2 MO embryos (n = 16 embryos), but had no effect on the number of control MO host cells expressing Tp1:d2GFP (n = 12 embryos) compared to non-transplanted controls (n = 11 embryos). c, Quantitative data for Figure 3f-i reveals that transplanted wild-type donor cardiomyocytes are primarily adjacent to host Tp1:d2GFP+ cardiomyocytes in erbb2 MO hearts (n = 10 embryos). Mean +/− s.e.m. *p < 0.05 by Student's t-test. n.s. – not significant.
Figure 1
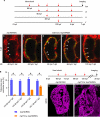
Figure 1. Notch signaling is dynamically activated in distinct myocardial clusters during cardiac morphogenesis
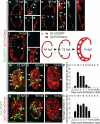
Cardiac ventricles at 72 hpf, 96 hpf and 14 dpf expressing (a-k, m-o) Tp1:d2GFP; myl7:mCherry or (q-s) Tp1:d2GFP; myl7:H2A-mCherry. (a-k) confocal slices, (m-o, q-s) 3D reconstructions. b, c-d, f-h, j-k insets are magnifications of a, b, e, i, boxed areas. c-d, g-h, j-k are single channels from b, f, i merged images. (l) Myocardial Notch signaling schematic. Quantification of (p) myocardial Tp1:d2GFP+ clusters and (t) cardiomyocytes per Tp1:d2GFP+ cluster. n – number of embryos analyzed per stage. White arrows – Tp1:d2GFP+ cardiomyocytes, white arrowheads – trabeculating cardiomyocytes, and yellow arrows – cardiomyocytes in Tp1:d2GFP+ clusters. White and yellow asterisks - AV and OFT. Mean +/− s.e.m. Scale bar 25 μm.
Figure 2
Figure 2. Myocardial Notch signaling cell-autonomously regulates cardiomyocyte segregation between ventricular wall layers
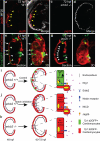
Inhibiting Notch signaling by (b, j) DAPT treatment; (d, l) global dnMAML-GFP (hsp70l:dnM); or (f, n) myocardial-specific dnMAML expression (myl7:Cre; ubi:RSdnM) leads to excessive trabeculation at 72 hpf, whereas (h, p) myocardial-specific constitutive Notch activation via NICD expression (myl7:Cre; hsp70l:RSN) diminishes trabeculation at 120 hpf. a, c, e, g, i, k, m, o panels represent respective controls for each condition. (a-p) For quantification see Extended Data Figure 5. (q) Myocardial priZm (brainbow) clonal studies. (r, s) 72 hpf myl7:CreER; priZm myocardial clones treated with DMSO or DAPT at 60 hpf. (t) Although DMSO and DAPT-treated ventricles display a similar overall number of myocardial clones (blue) (n = 10 and 11 embryos), DAPT-treated ventricles exhibit more clones in trabeculae (red) and less in the outer ventricular wall (green), compared with control. Crosses – mean and s.e.m. *p < 0.05, by Student's t-test. n.s. – not significant. (u) Notch-altering mosaic cardiomyocyte studies. (w) Constitutively-activated Notch cardiomyocytes expressing NICD-P2A-Emerald are primarily located on the ventricular outer wall (n = 13/14 clones, Fisher's exact test, p < 0.05); whereas (y) Notch-inhibited cardiomyocytes expressing dnSuH-P2A-Emerald are mainly found in trabeculae (n = 15/18 clones, Fisher's exact test, p < 0.05). (v, x) In controls lacking Tg(myl7:cre), mCherry+ cardiomyocytes are distributed equally between both layers (n = 11/21 and 14/26 clones in the outer wall). (z) Quantitative analysis of v-y. Insets are magnifications of boxed areas. Arrowheads and arrows – trabeculae and outer wall cardiomyocytes. HS – heat shock. Scale bar 25 μm.
Figure 3
Figure 3. Myocardial Erbb2 signaling non-cell-autonomously activates Notch signaling in neighboring cardiomyocytes
Compared to (a) controls (n = 0/15 embryos), Tp1:d2GFP; myl7:mCherry (b) erbb2 morpholino (MO) (n = 10/12) and (d) erbb2 −/− mutants (n = 10/10) display reduced trabeculae and myocardial Notch signaling. (c, e) DAPT treatment at 60 hpf cannot rescue these myocardial defects, but can diminish AV and OFT endocardial Notch signaling (asterisks) (n = 15/17, 17/17 embryos, respectively). (f-i) Blastomere transplantation studies. Compared to (g) control MO hosts (n = 12 embryos), (i) a greater percentage of donor Tg(myl7:Cerulean) wild-type cardiomyocytes are located in the trabeculae of erbb2 MO Tg(Tp1:d2GFP; myl7:H2A-mCherry) hosts (n = 10). In contrast to (h) non-transplanted erbb2 MO hearts (n = 16), (i) transplanted donor Tg(myl7:Cerulean) wild-type cardiomyocytes (arrowheads) can activate myocardial Notch activity (Tp1:d2GFP) in neighboring erbb2 MO Tg(Tp1:d2GFP; myl7:H2A-mCherry) host cardiomyocytes (arrows, n = 10). Scale bar 25 μm.
Figure 4
Figure 4. The Notch ligand Jag2b mediates cooperative interactions between cardiomyocytes
(a-d) jag2b is expressed in (a, b) wild-type (WT) (n = 6/6 embryos) but not (c, d) erbb2 −/− mutant myocardium (MF20+) (n = 0/5). (e-h) Compared to (e, f) WT controls (n = 0/10), (g, h) Tg(Tp1:d2GFP; myl7:mCherry) jag2b −/− mutants exhibit increased trabeculation and reduced myocardial Notch signaling at 72 hpf (n = 8/8). Yellow arrowheads – jag2b+ cardiomyocytes; white arrowheads – trabeculae; white arrows – Tp1:d2GFP+ cardiomyocytes; white and yellow asterisks – AV and OFT. Scale bar 25 μm. Myocardial Notch Signaling Model: (i) Endocardial Neuregulin/Nrg1 activates myocardial Erbb2 signaling, which cell-autonomously triggers myocardial sprouting and Jag2b expression (60-72 hpf). Jag2b activates Notch signaling in neighboring cardiomyocytes, which cell-autonomously inhibits erbb2 expression and trabeculae formation (magnified area). (j) Inhibiting Notch signaling allows all cardiomyocytes to express erbb2, respond to Neuregulin, and sprout and form trabeculae. (k) Blocking Erbb2 signaling prevents trabeculation, Jag2b expression and Notch activation in neighboring cardiomyocytes.

References

    1. Fahed AC, Gelb BD, Seidman JG, Seidman CE. Genetics of congenital heart disease: the glass half empty. Circ Res. 2013;112:707–720. - PMC - PubMed
    1. Zemrak F, et al. The relationship of left ventricular trabeculation to ventricular function and structure over a 9.5-year follow-up: the MESA study. Journal of the American College of Cardiology. 2014;64:1971–1980. - PMC - PubMed
    1. Grego-Bessa J, et al. Notch signaling is essential for ventricular chamber development. Dev Cell. 2007;12:415–429. - PMC - PubMed
    1. Gupta V, Poss KD. Clonally dominant cardiomyocytes direct heart morphogenesis. Nature. 2012;484:479–484. - PMC - PubMed
    1. Staudt DW, et al. High-resolution imaging of cardiomyocyte behavior reveals two distinct steps in ventricular trabeculation. Development. 2014;141:585–593. - PMC - PubMed

Publication types

MeSH terms