. 2016 Jun 29;18(1):69.
doi: 10.1186/s13058-016-0732-2.

Proteomic analysis of breast tumors confirms the mRNA intrinsic molecular subtypes using different classifiers: a large-scale analysis of fresh frozen tissue samples

Affiliations

Proteomic analysis of breast tumors confirms the mRNA intrinsic molecular subtypes using different classifiers: a large-scale analysis of fresh frozen tissue samples

Sofia Waldemarson et al. Breast Cancer Res. .

Abstract

Background: Breast cancer is a complex and heterogeneous disease that is usually characterized by histological parameters such as tumor size, cellular arrangements/rearrangments, necrosis, nuclear grade and the mitotic index, leading to a set of around twenty subtypes. Together with clinical markers such as hormone receptor status, this classification has considerable prognostic value but there is a large variation in patient response to therapy. Gene expression profiling has provided molecular profiles characteristic of distinct subtypes of breast cancer that reflect the divergent cellular origins and degree of progression.

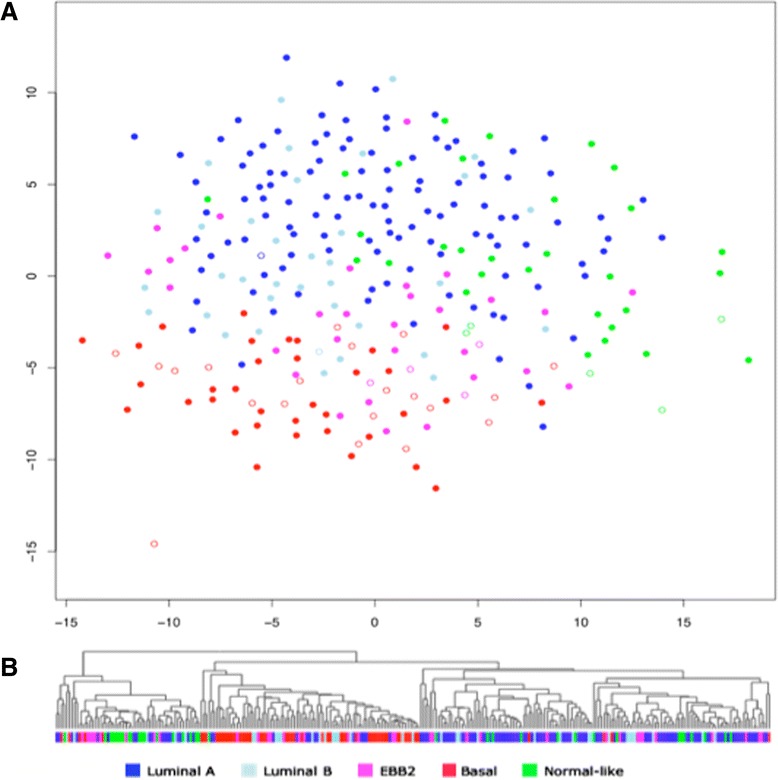
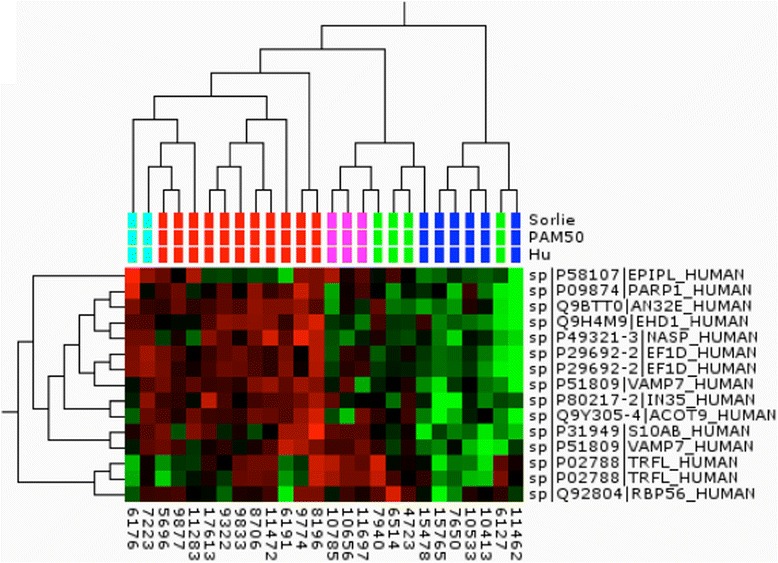
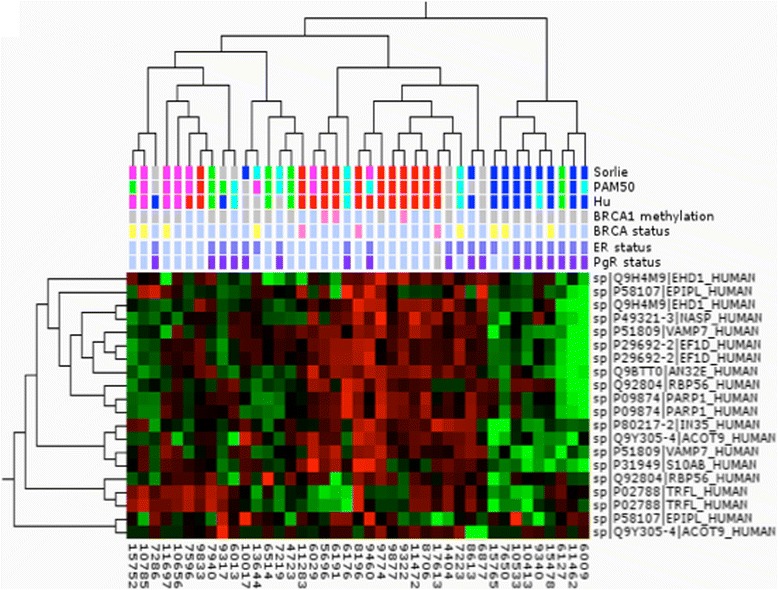
Methods: Here we present a large-scale proteomic and transcriptomic profiling study of 477 sporadic and hereditary breast cancer tumors with matching mRNA expression analysis. Unsupervised hierarchal clustering was performed and selected proteins from large-scale tandem mass spectrometry (MS/MS) analysis were transferred into a highly multiplexed targeted selected reaction monitoring assay to classify tumors using a hierarchal cluster and support vector machine with leave one out cross-validation.

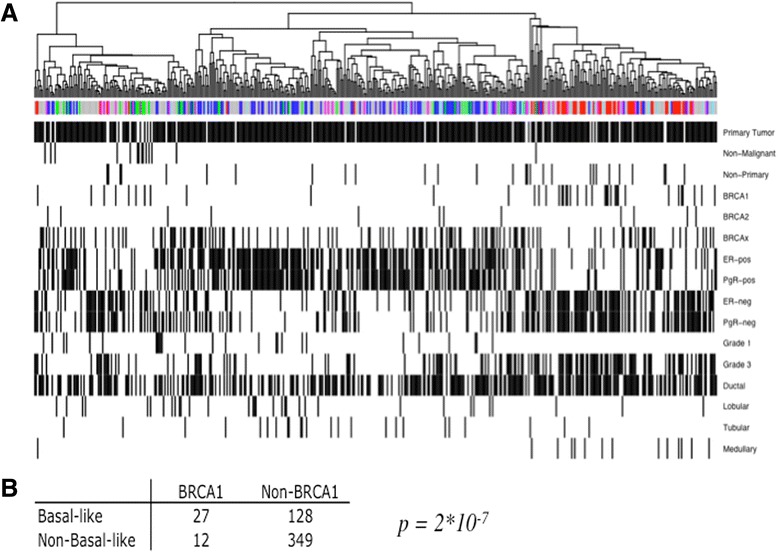
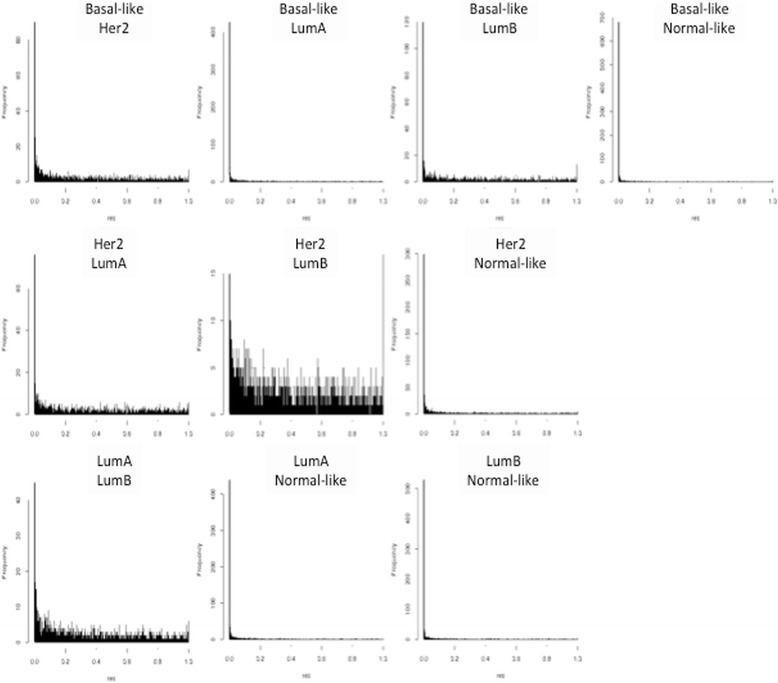
Results: The subgroups formed upon unsupervised clustering agree very well with groups found at transcriptional level; however, the classifiers (genes or their respective protein products) differ almost entirely between the two datasets. In-depth analysis shows clear differences in pathways unique to each type, which may lie behind their different clinical outcomes. Targeted mass spectrometry analysis and supervised clustering correlate very well with subgroups determined by RNA classification and show convincing agreement with clinical parameters.

Conclusions: This work demonstrates the merits of protein expression profiling for breast cancer stratification. These findings have important implications for the use of genomics and expression analysis for the prediction of protein expression, such as receptor status and drug target expression. The highly multiplexed MS assay is easily implemented in standard clinical chemistry practice, allowing rapid and cheap characterization of tumor tissue suitable for directing the choice of treatment.

Keywords: Breast cancer; Mass spectrometry; Molecular subtyping; Proteomics; Transcriptomics.


Figures

Fig. 1
Fig. 1
a Breast cancer tumors analyzed at protein expression level largely form the same type of clusters as seen at the gene expression level. This is a Sammon map of the tumors using protein expression data from 2D-DIGE with matched mRNA data, color coded according to the Sørlie gene expression classification of the same; luminal A (dark blue), luminal B (light blue), ERBB2 (purple), basal-like (red) and normal-like (green). Samples from BRCA1-mutated patients are indicated as empty rings. b Corresponding hierarchal clustering of the same samples using the same data. The basal-like and the luminal A clusters are strikingly homogenous
Fig. 2
Fig. 2
a Unsupervised hierarchal clustering of all samples analyzed on 2D-DIGE (fig 2a). Samples previously analyzed at gene expression level are colored according to the Sørlie gene expression classification: luminal A (dark blue), luminal B (light blue), ERBB2 (purple), basal-like (red) and normal-like (green). Samples with unknown gene expression are colored gray. Clinical parameters are indicated under the cluster where a black bar indicates presence of the variable. b Distribution of BRCA1-mutated tumors in the basal-like cluster compared to the non-basal like cluster Fishers exact test p value = 2*10-7
Fig. 3
Fig. 3
Wilcoxon pairwise comparison of 2D-DIGE data for all tumors grouped according to the Sørlie gene expression classification. The frequency (y-axis) of p values (x-axis, 0–1) for the pairwise comparisons of all five subtypes. All pairwise comparisons demonstrate a clear overrepresentation of p values <0.001 except for the human epidermal growth factor receptor 2 (Her2) versus luminal B (LumB) pairwise comparison
Fig. 4
Fig. 4
Cluster analysis of the “core set” of tumors using analysis of variance filtering (p value 0.01). The tumor classification according to three gene expression profiling methods is indicated below the branching and colored accordingly: red basal-like, magenta HER2, green normal-like, blue luminal A, turquoise luminal B. Proteins are indicated with the SwissProt ID and short name
Fig. 5
Fig. 5
Cluster analysis of all tumors analyzed with the selected reaction monitoring protein assay. The tumor classification according to three gene expression profiling methods is indicated below the branching and colored accordingly: the tumor classification according to three gene expression profiling methods is indicated below the branching and colored accordingly: red basal-like, magenta human epidermal growth factor receptor 2, green normal-like, blue luminal A, turquoise luminal B, gray unknown classification. Clinical parameters including BRCA1 methylation status (pink positive), BRCA mutational status (pink BRCA1-positive, yellow BRCAx-positive), estrogen receptor (ER) (dark blue positive), and progesterone receptor (PgR) (darker purple positive) status and overall survival (green alive) are indicated below the samples. Proteins are indicated with the SwissProt ID and short name. PAM50 prediction analysis of microarray

References

    1. Fisher ER, Redmond CK, Liu H, Rockette H, Fisher B. Correlation of estrogen receptor and pathologic characteristics of invasive breast cancer. Cancer. 1980;45(2):349–53. doi: 10.1002/1097-0142(19800115)45:2<349::AID-CNCR2820450226>3.0.CO;2-P. - DOI - PubMed
    1. Lin NU, Winer EP. Advances in adjuvant endocrine therapy for postmenopausal women. J Clin Oncol. 2008;26(5):798–805. doi: 10.1200/JCO.2007.15.0946. - DOI - PubMed
    1. Creighton CJ, et al. Proteomic and transcriptomic profiling reveals a link between the PI3K pathway and lower estrogen-receptor (ER) levels and activity in ER+ breast cancer. Breast Cancer Res. 2010;12(3):R40. doi: 10.1186/bcr2594. - DOI - PMC - PubMed
    1. Perou CM, et al. Molecular portraits of human breast tumours. Nature. 2000;406(6797):747–52. doi: 10.1038/35021093. - DOI - PubMed
    1. Sørlie T, et al. Gene expression patterns of breast carcinomas distinguish tumor subclasses with clinical implications. Proc Natl Acad Sci USA. 2001;98(19):10869–74. doi: 10.1073/pnas.191367098. - DOI - PMC - PubMed

Publication types