. 2016 Jun 29:17:259.
doi: 10.1186/s12859-016-1140-4.

Reference-free deconvolution of DNA methylation data and mediation by cell composition effects

Affiliations

Reference-free deconvolution of DNA methylation data and mediation by cell composition effects

E Andres Houseman et al. BMC Bioinformatics. .

Abstract

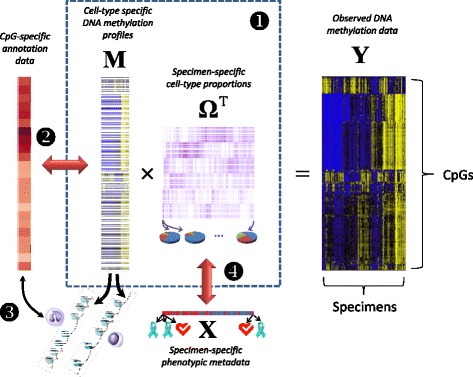
Background: Recent interest in reference-free deconvolution of DNA methylation data has led to several supervised methods, but these methods do not easily permit the interpretation of underlying cell types.

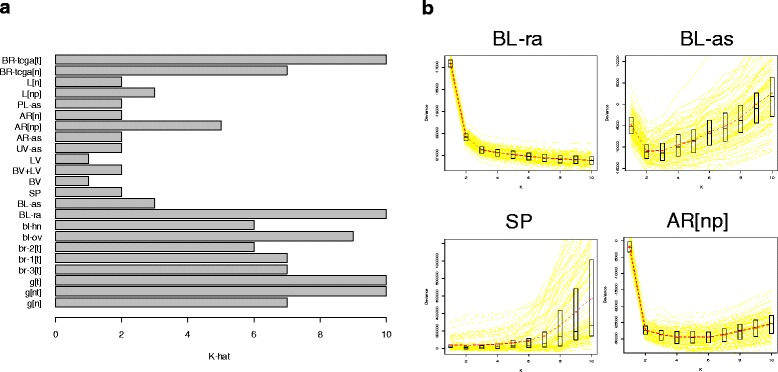
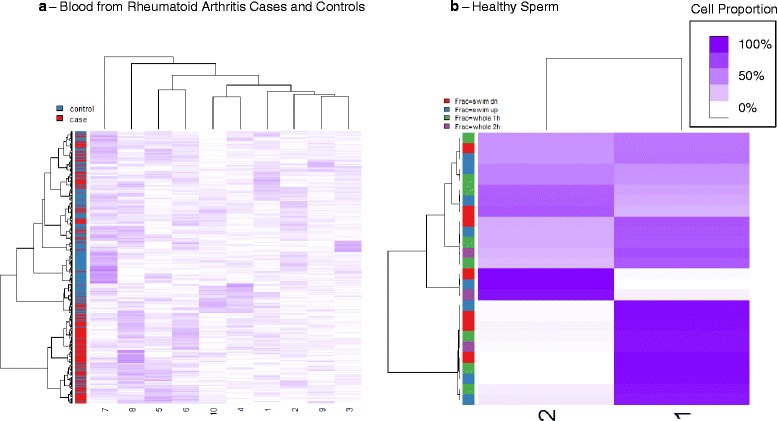
Results: We propose a simple method for reference-free deconvolution that provides both proportions of putative cell types defined by their underlying methylomes, the number of these constituent cell types, as well as a method for evaluating the extent to which the underlying methylomes reflect specific types of cells. We demonstrate these methods in an analysis of 23 Infinium data sets from 13 distinct data collection efforts; these empirical evaluations show that our algorithm can reasonably estimate the number of constituent types, return cell proportion estimates that demonstrate anticipated associations with underlying phenotypic data; and methylomes that reflect the underlying biology of constituent cell types.

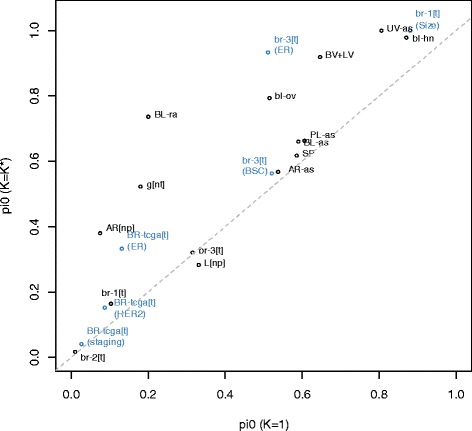
Conclusions: Our methodology permits an explicit quantitation of the mediation of phenotypic associations with DNA methylation by cell composition effects. Although more work is needed to investigate functional information related to estimated methylomes, our proposed method provides a novel and useful foundation for conducting DNA methylation studies on heterogeneous tissues lacking reference data.

Keywords: DNA methylation; Deconvolution; Epigenetics; Non-negative matrix factorization.


Figures

Fig. 1
Fig. 1
Overview of proposed Methods. If associations between DNA methylation data Y and phenotypic metadata X factor through the decomposition Y =  T, and the data in M serve to distinguish cell types by their associations with relevant annotation data, then associations between X and Y are explained in whole or in part by differences in the distribution of constituent cell types. Numbers indicate steps in analysis: (1) deconvolution; (2) determining discriminating loci; (3) gene-set analysis; (4) analysis of associations with phenotype
Fig. 2
Fig. 2
Selection of Number of Classes K. a Estimated number K^ of classes for each data set. b Bootstrapped deviance profiles for four selected data sets, along with mean deviance, median deviance, and quartiles for each value of K
Fig. 3
Fig. 3
Cell Proportion Matrices. Clustering heatmaps of cell proportion matrix Ω for two data sets; purple intensity indicates cell proportion. a Blood from rheumatoid arthritis cases and controls (BL-ra, K=K^=10); clustering heatmap obtained from untransformed coefficients and using Ward’s method of clustering (“ward.D” in R hclust function). b Sperm (SP, K=K^=2)
Fig. 4
Fig. 4
Comparison of Null Associations. Comparison of π 0 (proportion of null association CpGs) from the K = 1 model with π 0 from the K = K* model; only non-demographic variables are shown
Fig. 5
Fig. 5
Gene-Set Analysis (DMPs and PcG Targets). Gene-set odds ratios, showing the association of gene set membership with the set of CpGs whose values are highly variable across fitted methylomes (s j2 > q 0.75(s 2)). a Blood DMRs. b CpGs mapped to polycomb group protein genes
Fig. 6
Fig. 6
Gene-Set Analysis (Roadmap Epigenomics WGBS). Gene-set odds ratios for 450K data sets, showing association of sets of DMPs distinguishing various Roadmap Epigenomics WGBS specimens with the set of CpGs whose values are highly variable across fitted methylomes (s j2 > q 0.75(s 2)). Clustering heatmap obtained from log-odds-ratios and using Ward’s method of clustering (“ward.D” in R hclust function)

Similar articles

Cited by

References

    1. Houseman EA, Kim S, Kelsey KT, Wiencke JK. DNA methylation in whole blood: uses and challenges. Curr Environ Health Rep. 2015;2:145–54. doi: 10.1007/s40572-015-0050-3. - DOI - PubMed
    1. Herbstman JB, et al. Predictors and consequences of global DNA methylation in cord blood and at three years. PLoS One. 2013;8 doi: 10.1371/journal.pone.0072824. - DOI - PMC - PubMed
    1. Kile ML, et al. Effect of prenatal arsenic exposure on DNA methylation and leukocyte subpopulations in cord blood. Epigenetics. 2014;9:774–82. doi: 10.4161/epi.28153. - DOI - PMC - PubMed
    1. Koestler DC, Avissar-Whiting M, Houseman EA, Karagas MR, Marsit CJ. Differential DNA methylation in umbilical cord blood of infants exposed to low levels of arsenic in utero. Environ Health Perspect. 2013;121:971–7. doi: 10.1289/ehp.1205925. - DOI - PMC - PubMed
    1. Smith AK, et al. DNA extracted from saliva for methylation studies of psychiatric traits: evidence tissue specificity and relatedness to brain. Am J Med Genet B Neuropsychiatr Genet. 2015;168B:36–44. doi: 10.1002/ajmg.b.32278. - DOI - PMC - PubMed

Publication types