. 2016 Oct;30(10):3489-3500.
doi: 10.1096/fj.201600422R. Epub 2016 Jun 29.

ERK1/2 activation in human taste bud cells regulates fatty acid signaling and gustatory perception of fat in mice and humans

Affiliations

ERK1/2 activation in human taste bud cells regulates fatty acid signaling and gustatory perception of fat in mice and humans

Selvakumar Subramaniam et al. FASEB J. 2016 Oct.

Abstract

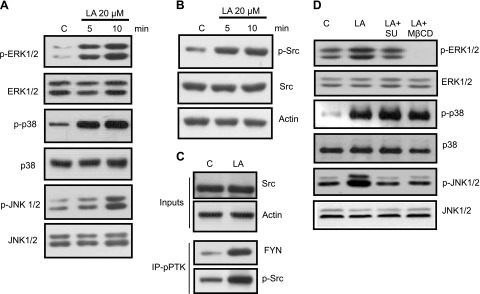
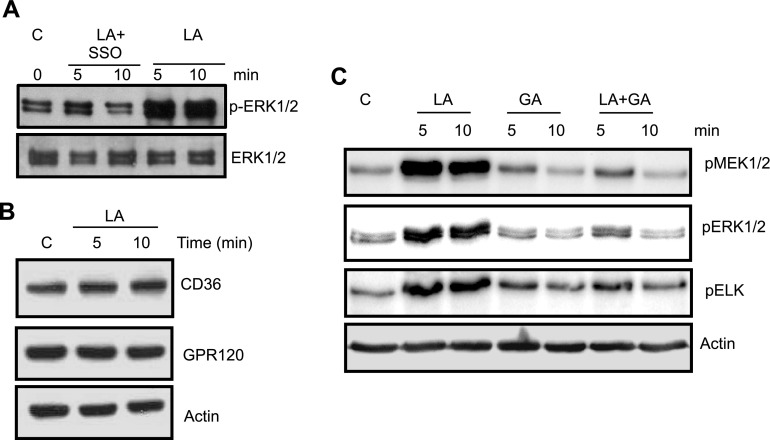
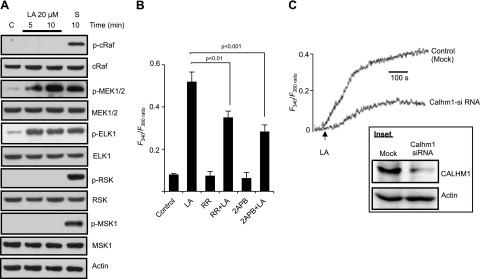
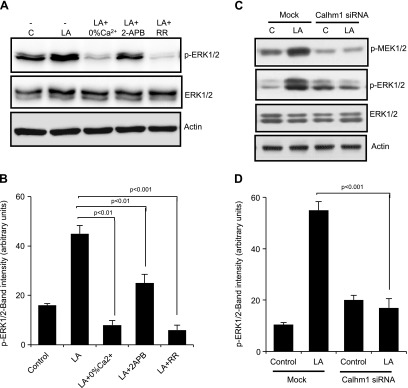
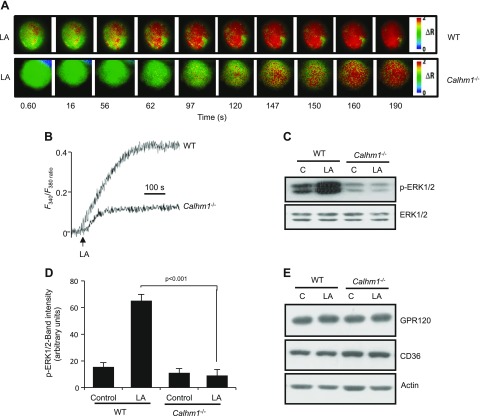
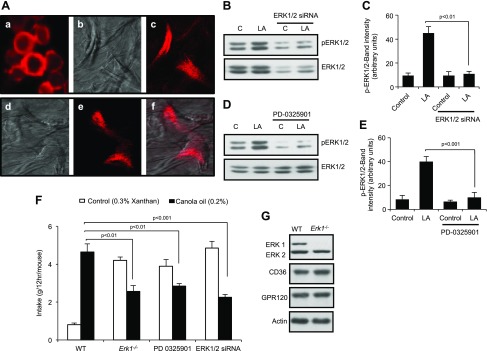
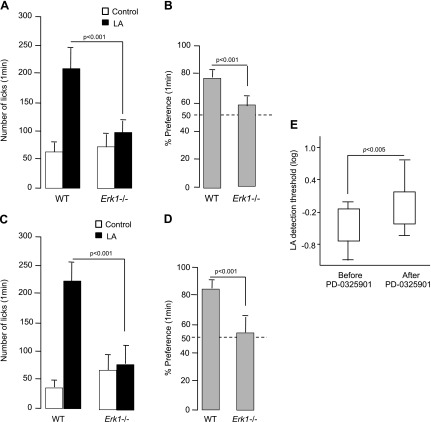
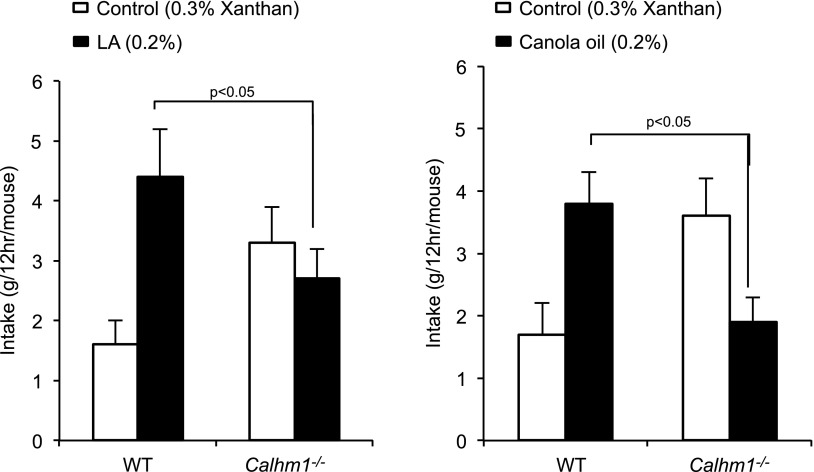
Obesity is a major public health problem. An in-depth knowledge of the molecular mechanisms of oro-sensory detection of dietary lipids may help fight it. Humans and rodents can detect fatty acids via lipido-receptors, such as CD36 and GPR120. We studied the implication of the MAPK pathways, in particular, ERK1/2, in the gustatory detection of fatty acids. Linoleic acid, a dietary fatty acid, induced via CD36 the phosphorylation of MEK1/2-ERK1/2-ETS-like transcription factor-1 cascade, which requires Fyn-Src kinase and lipid rafts in human taste bud cells (TBCs). ERK1/2 cascade was activated by Ca2+ signaling via opening of the calcium-homeostasis modulator-1 (CALHM1) channel. Furthermore, fatty acid-evoked Ca2+ signaling and ERK1/2 phosphorylation were decreased in both human TBCs after small interfering RNA knockdown of CALHM1 channel and in TBCs from Calhm1-/- mice. Targeted knockdown of ERK1/2 by small interfering RNA or PD0325901 (MEK1/2 inhibitor) in the tongue and genetic ablation of Erk1 or Calhm1 genes impaired preference for dietary fat in mice. Lingual inhibition of ERK1/2 in healthy volunteers also decreased orogustatory sensitivity for linoleic acid. Our data demonstrate that ERK1/2-MAPK cascade is regulated by the opening of CALHM1 Ca2+ channel in TBCs to modulate orogustatory detection of dietary lipids in mice and humans.-Subramaniam, S., Ozdener, M. H., Abdoul-Azize, S., Saito, K., Malik, B., Maquart, G., Hashimoto, T., Marambaud, P., Aribi, M., Tordoff, M. G., Besnard, P., Khan, N. A. ERK1/2 activation in human taste bud cells regulates fatty acid signaling and gustatory perception of fat in mice and humans.

Keywords: CALHM1; MAPK; lipids.


Figures

Figure 1.
Figure 1.
Effects of LA exposure on MAPK and Src kinase activation. Cultured hTBCs were exposed to 20 µM LA for 5 or 10 min. A) Western blot analysis of cell lysates for phosphorylated (p) or total ERK1/2, p38, and JNK1/2 proteins are shown, as mentioned in Materials and Methods. C, control. B) Western blot analysis of phosphorylated Src (Tyr416) and total Src protein levels in control (c) or LA-treated samples. C) LA-treated (5 min) hTBC lysate was subjected to immunoprecipitation with phosphotyrosine kinase (pPTK) antibody and immunoblotting for FYN and p-Src. Inputs were analyzed for total Src and actin. D) hTBCs were pretreated for 30 min with either PTK inhibitor SU6656 (SU) at 5 µM or lipid raft disruptor M-βCD at 2.5 mM and then exposed to LA for 10 min. Data are representative of 3–4 independent experiments.
Figure 2.
Figure 2.
Role of CD36 and GPR120 in LA-mediated MAPK activation in hTBCs. A) hTBCs were pretreated with SSO (20 µM, 30 min) before addition of LA for 5 or 10 min. B) CD36 and GPR120 levels in control (c; solvent treated) or LA (20 µM)-treated TBC lysates. C) Western blot analysis of phosphorylated (p) MEK1/2, ERK1/2 and ELK in control (c) or cells treated with 20 µM LA, 20 µM GA, or both 20 µM LA and 20 µM GA. Data are representative of 3–5 independent experiments.
Figure 3.
Figure 3.
Involvement of CALHM1 channels in hTBC Ca2+ signaling. A) Control (c) and LA-treated hTBC samples were analyzed for activation of upstream and downstream pathway components of the ERK1/2 cascade. Serum–starved (S; 6 h) hTBCs were exposed for 10 min to serum that contained medium. B) Cultured hTBCs (2 × 10⁵ cells/assay) were loaded with Fura-2/AM and changes in [Ca2+]i (F340/F380) were monitored in response to 20 µM LA. hTBC, preincubated (30 min) with: RR (20 µM) or 2-APB (30 µM), were exposed to 20 µM LA. Experiments were performed in Ca2+-containing medium. C) Changes in [Ca2+]i in mock- or Calhm1 siRNA-transfected hTBCs exposed to 20 µM LA. CALHM1 levels in mock- or Calhm1 siRNA-transfected hTBCs (inset). Actin served as loading control. Data are means ± sem (n = 7) conducted in triplicate. Data are representative of 3–5 independent experiments.
Figure 4.
Figure 4.
LA-mediated ERK1/2 activation is regulated by Ca2+ and CALHM1 channels. Western blot analysis of phosphorylated (p) or total proteins of the MAPK pathway. A) hTBCs were preincubated (30 min) with: RR (20 µM) or 2-APB (30 µM) in 100% Ca2+ buffer and exposed to 20 µM LA for 5 min. Cell lysates were subjected to Western blot analysis for phosphorylated or total proteins of ERK1/2. C) Effect of selective down-regulation of CALHM1 by siRNA on LA-induced activation of MEK and ERK1/2 in hTBCs. B, D) Histograms show the relative band intensity (arbitrary units) of p-ERK1/2 measured by densitometry of protein content. Data were normalized with respect to band intensity of total ERK1/2, measured under similar conditions. Data in panel B are derived from panel A, whereas those in panel D are derived from panel C (n = 5). C, control; Mock, nontargeting siRNA. Data are representative of 4–5 independent experiments.
Figure 5.
Figure 5.
Effects of CALHM1 deficiency on LA-evoked Ca2+ signaling and MAPK activation in mouse TBCs. Ca2+ imaging studies and MAPK activation assay were performed on fungiform TBCs from WT or Calhm1−/− mice. A, B) Colored time-lapse images (A) and graphical representation (B) show changes in [Ca2+]i evoked by LA 20 µM. Changes in [Ca2+]i (F340/F380) were monitored as for Fig. 4. C) LA (20 µM)-induced activation of ERK1/2 in WT and Calhm1−/− mouse fungiform TBCs. D) Histograms, derived from panel C, show the relative band intensity (arbitrary units) of p-ERK1/2 measured by densitometry of protein content. Data were normalized with respect to band intensity of total ERK1/2, measured under similar conditions (n = 5). E) CD36 and GPR120 levels in WT and Calhm1−/− mouse TBCs. C, control. Data are representative of experiments reproduced 3 times independently.
Figure 6.
Figure 6.
Effects of ERK1 deficiency or inhibition of ERK1/2 activation in WT mice on fat preference. A) Images of nontarget siRNA. Accell fluorescence was detected by confocal microscopy with an excitation filter of 445–490 nm and a long-pass emission filter of 515 nm. a) Freshly isolated CD36+ cells. b, d) Mouse TBCs, cultured for 3 d. c) Same cells as in b, but through color filters. e) Image of cells as in d, but only through color filters. f) Same image as in d and f, but superimposed. B, D) Effect of selective down-regulation of ERK1/2 by siRNA (B) or inhibition of ERK activation by PD-0325901 (D) on 20 µM LA-induced activation of ERK1/2 in mouse fungiform TBCs. C, E) Histograms, derived from panels B and D, respectively, show the relative band intensity (arbitrary units) of p-ERK1/2 measured by densitometry of protein content. Data were normalized with respect to band intensity of total ERK1/2, measured under similar conditions (n = 5). F) Preference for 0.2% canola oil in Erk1−/− or WT mice subjected to siRNA or PD-0325901 application onto the tongue. Control solution was 0.3% xanthan gum. Values are means ± sem (n = 5). G) ERK1/2, CD36, and GPR120 levels in fungiform TBCs from WT and Erk1−/− mice. C, control. Data are representative of 5 independent experiments. Original magnification, ×10.
Figure 7.
Figure 7.
Implication of MAPK inhibition on orosensorial detection of fatty acids in mice and humans. Animals (WT and ERK1−/−) were subjected successively in a randomized manner to a control solution (mineral oil) or to a solution that contained a fatty acid. A, B) LA was used at 0.2% (w/v). C, D) LA was used at 2% (w/v). Licking results are shown in panels A and C, whereas panels B and D show percentage of preference for LA. Dotted line represents absence of taste preference. Values are means ± sem (n = 10/group). E) Log plot of oral detection thresholds of LA in humans before and after lingual applications of PD-0325901. Values are median ± percentile. Values are significantly different according to 1-way ANOVA (n = 19).
Figure 8.
Figure 8.
Spontaneous fat preference in WT and Calhm1−/− mice. WT and Calhm1−/− mice received 12-h 2-bottle preference tests with a choice between control solution (0.3% xanthan gum) and LA (0.2%; left panel) or canola oil (0.2%; right panel) diluted in 0.3% xanthan gum. Values are means ± sem (n = 8/group).

References

    1. Gurevich-Panigrahi T., Panigrahi S., Wiechec E., Los M. (2009) Obesity: pathophysiology and clinical management. Curr. Med. Chem. 16, 506–521 - PubMed
    1. Mela D. J., Sacchetti D. A. (1991) Sensory preferences for fats: relationships with diet and body composition. Am. J. Clin. Nutr. 53, 908–915 - PubMed
    1. Besnard P., Passilly-Degrace P., Khan N. A. (2016) Taste of fat: a sixth taste modality? Physiol. Rev. 96, 151–176 - PubMed
    1. Gilbertson T. A., Khan N. A. (2014) Cell signaling mechanisms of oro-gustatory detection of dietary fat: advances and challenges. Prog. Lipid Res. 53, 82–92 - PubMed
    1. Chalé-Rush A., Burgess J. R., Mattes R. D. (2007) Evidence for human orosensory (taste?) sensitivity to free fatty acids. Chem. Senses 32, 423–431 - PubMed

MeSH terms

LinkOut - more resources