

Development and Validation of an Empirical Dietary Inflammatory Index
- PMID: 27358416
- PMCID: PMC4958288
- DOI: 10.3945/jn.115.228718
Development and Validation of an Empirical Dietary Inflammatory Index
Abstract
Background: Knowledge on specific biological pathways mediating disease occurrence (e.g., inflammation) may be utilized to construct hypotheses-driven dietary patterns that take advantage of current evidence on disease-related hypotheses and the statistical methods of a posteriori patterns.
Objective: We developed and validated an empirical dietary inflammatory index (EDII) based on food groups.
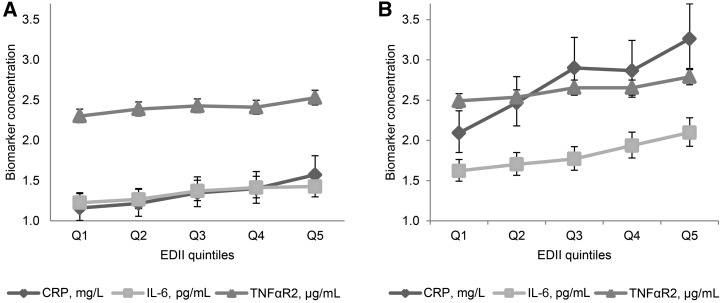
Methods: We entered 39 pre-defined food groups in reduced rank regression models followed by stepwise linear regression analyses in the Nurses' Health Study (NHS, n = 5230) to identify a dietary pattern most predictive of 3 plasma inflammatory markers: interleukin-6 (IL-6), C-reactive protein (CRP), and tumor necrosis factor α receptor 2 (TNFαR2). We evaluated the construct validity of the EDII in 2 independent samples from NHS-II (n = 1002) and Health Professionals Follow-up Study (HPFS, n = 2632) using multivariable-adjusted linear regression models to examine how well the EDII predicted concentrations of IL-6, CRP, TNFαR2, adiponectin, and an overall inflammatory marker score combining all biomarkers.
Results: The EDII is the weighted sum of 18 food groups; 9 are anti-inflammatory and 9 proinflammatory. In NHS-II and HPFS, the EDII significantly predicted concentrations of all biomarkers. For example, the relative concentrations comparing extreme EDII quintiles in NHS-II were: adiponectin, 0.88 (95% CI, 0.80, 0.96), P-trend = 0.003; and CRP, 1.52 (95% CI, 1.18, 1.97), P-trend = 0.002. Corresponding associations in HPFS were: 0.87 (95% CI, 0.82, 0.92), P-trend < 0.0001; and 1.23 (95% CI, 1.09, 1.40), P-trend = 0.002.
Conclusion: The EDII represents, to our knowledge, a novel, hypothesis-driven, empirically derived dietary pattern that assesses diet quality based on its inflammatory potential. Its strong construct validity in independent samples of women and men indicates its usefulness in assessing the inflammatory potential of whole diets. Additionally, the EDII may be calculated in a standardized and reproducible manner across different populations thus circumventing a major limitation of dietary patterns derived from the same study in which they are applied.
Keywords: dietary inflammatory potential; dietary patterns; hypothesis-driven; inflammation; inflammatory markers.
© 2016 American Society for Nutrition.
Conflict of interest statement
Author disclosures: FK Tabung, SA Smith-Warner, JE Chavarro, K Wu, CS Fuchs, FB Hu, AT Chan, WC Willet, and EL Giovannucci, no conflicts of interest.
Figures

References
-
- Hu FB. Dietary pattern analysis: a new direction in nutritional epidemiology. Curr Opin Lipidol 2002;13:3–9. - PubMed
-
- Jacques PF, Tucker KL. Are dietary patterns useful for understanding the role of diet in chronic disease? Am J Clin Nutr 2001;73:1–2. - PubMed
-
- World Cancer Research Fund and the American Institute for Cancer Research. Food, nutrition and prevention of cancer: a global perspective 2007. Washington (DC). Report No.: 978–0-9722522–2-5.
-
- Varraso R, Garcia-Aymerich J, Monier F, Le Moual N, De Batlle J, Miranda G, Pison C, Romieu I, Kauffmann F, Maccario J. Assessment of dietary patterns in nutritional epidemiology: principal component analysis compared with confirmatory factor analysis. Am J Clin Nutr 2012;96:1079–92. - PubMed
Publication types
MeSH terms
Substances
Grants and funding
LinkOut - more resources
Full Text Sources
Other Literature Sources
Research Materials
Miscellaneous
