. 2016 Jun 2;1(8):e85609.
doi: 10.1172/jci.insight.85609.

Single-cell analysis of glandular T cell receptors in Sjögren's syndrome

Affiliations

Single-cell analysis of glandular T cell receptors in Sjögren's syndrome

Michelle L Joachims et al. JCI Insight. .

Abstract

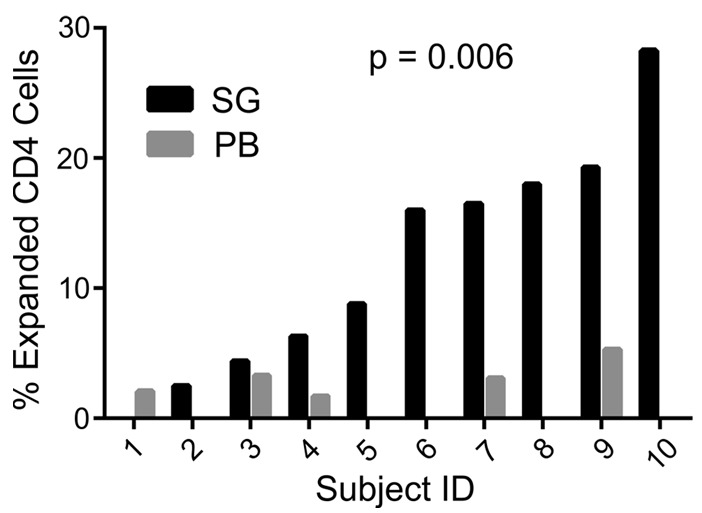
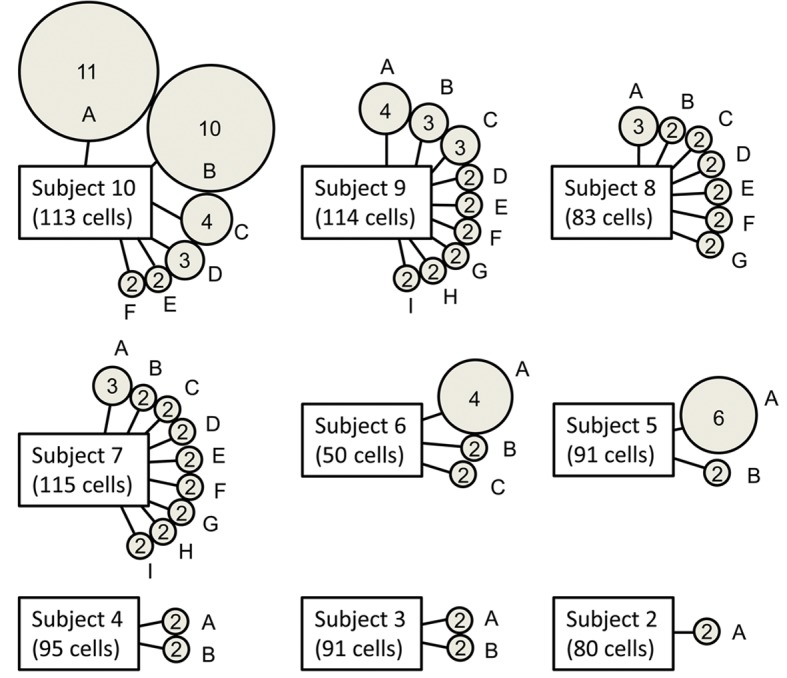
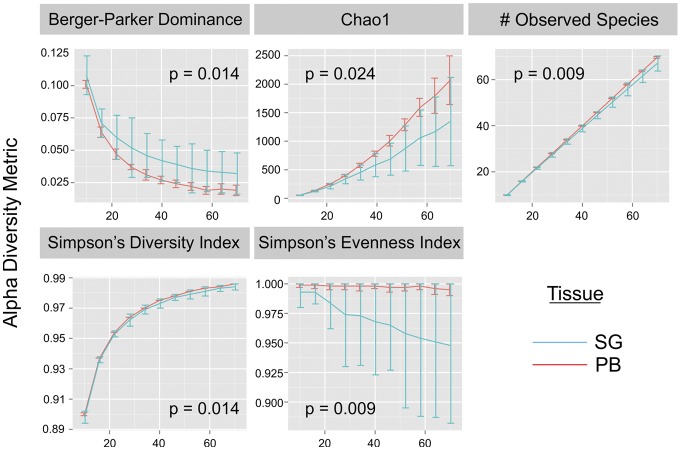
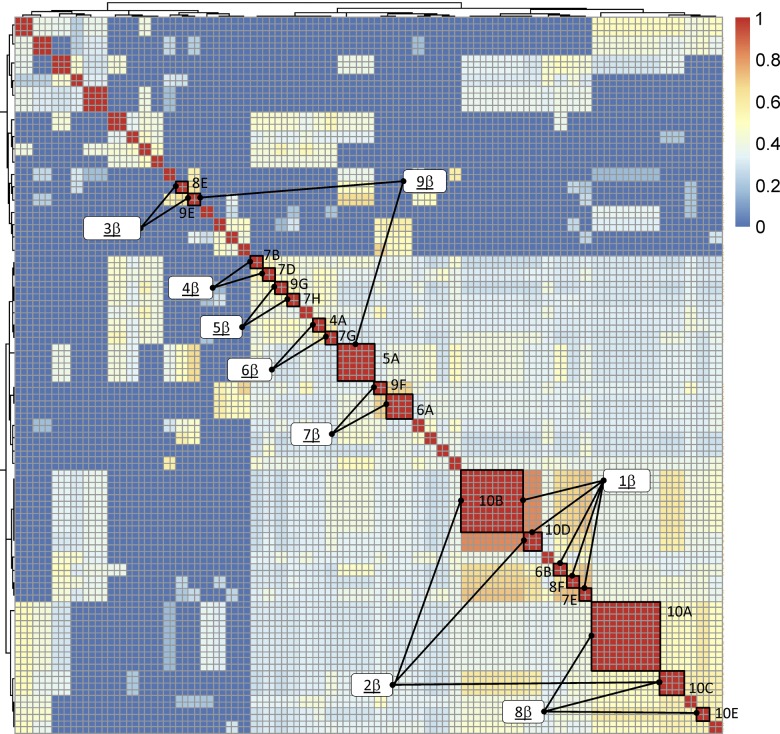
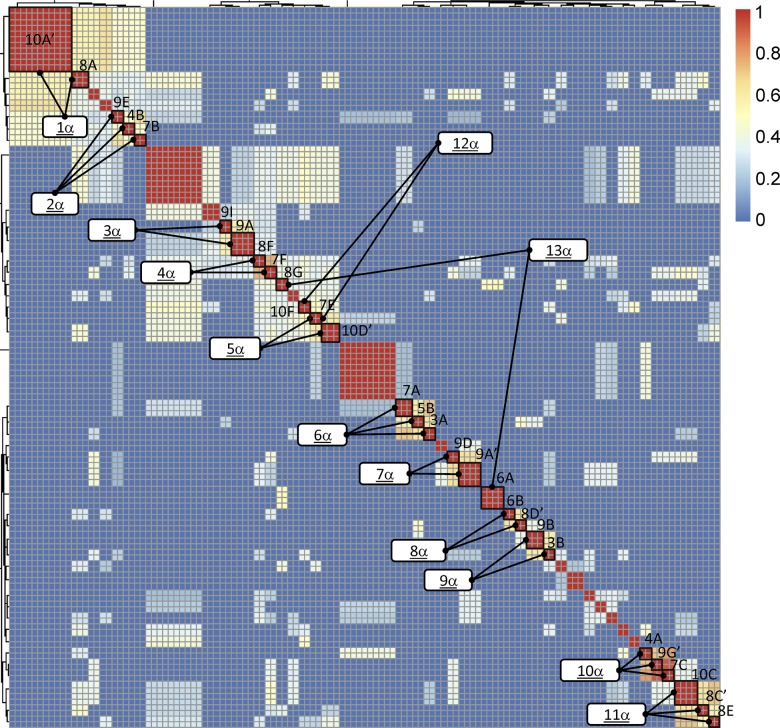
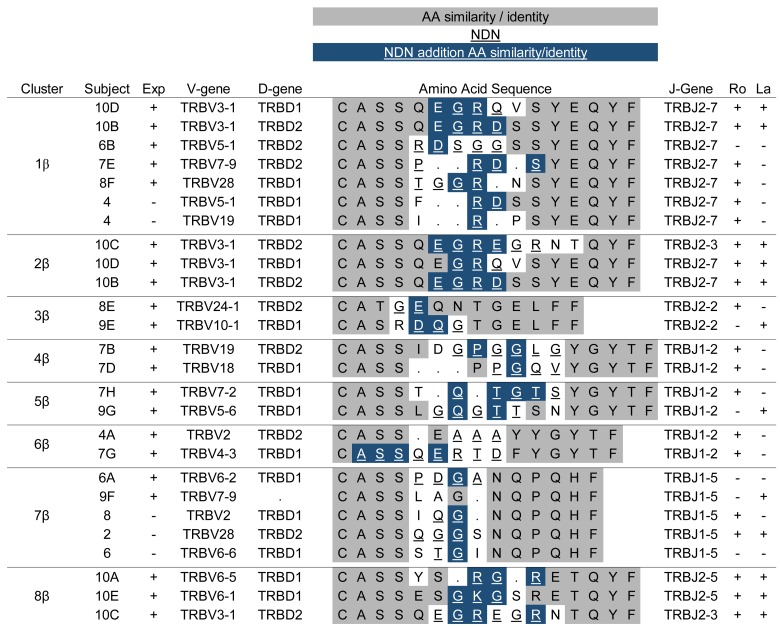
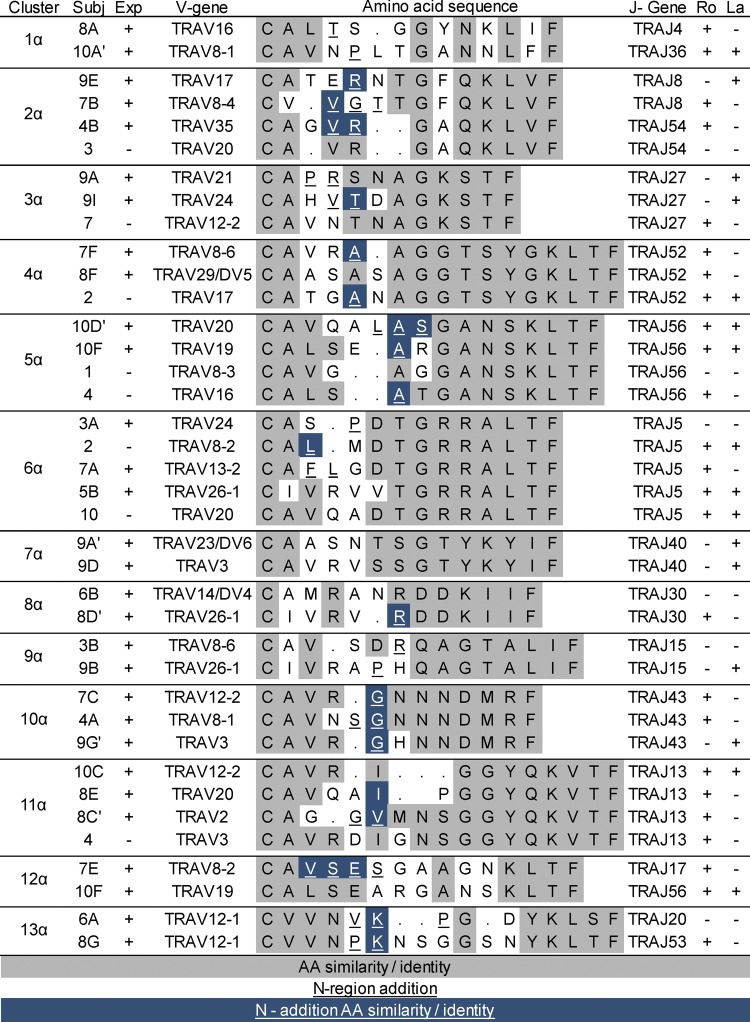
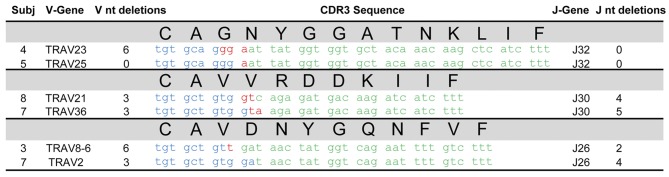
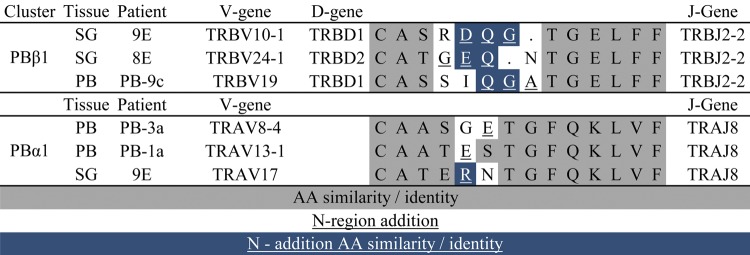
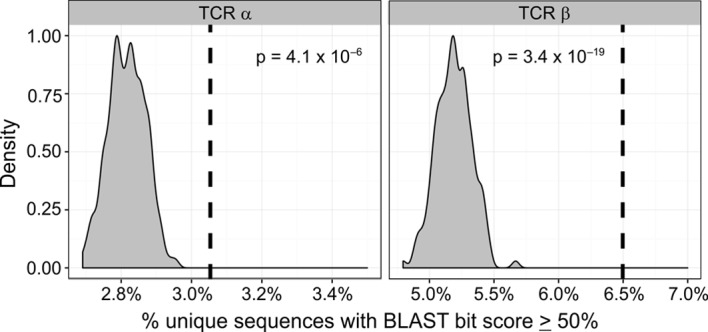
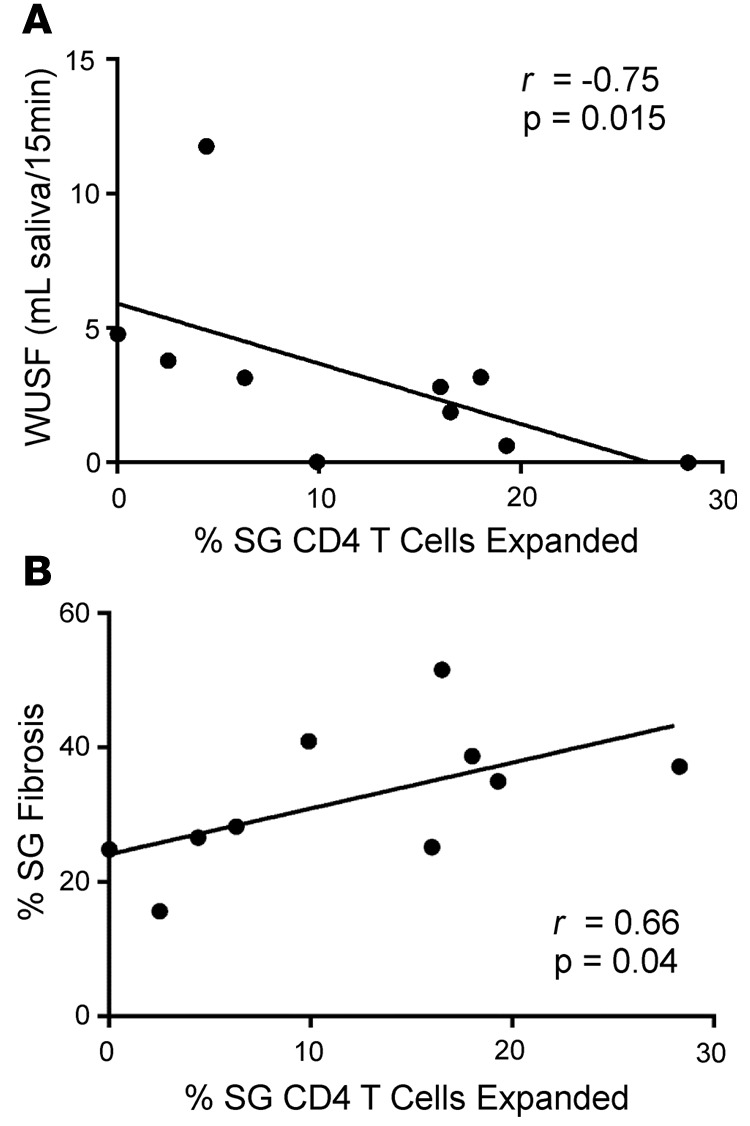
CD4+ T cells predominate in salivary gland (SG) inflammatory lesions in Sjögren's syndrome (SS). However, their antigen specificity, degree of clonal expansion, and relationship to clinical disease features remain unknown. We used multiplex reverse-transcriptase PCR to amplify paired T cell receptor α (TCRα) and β transcripts of single CD4+CD45RA- T cells from SG and peripheral blood (PB) of 10 individuals with primary SS, 9 of whom shared the HLA DR3/DQ2 risk haplotype. TCRα and β sequences were obtained from a median of 91 SG and 107 PB cells per subject. The degree of clonal expansion and frequency of cells expressing two productively rearranged α genes were increased in SG versus PB. Expanded clones from SG exhibited complementary-determining region 3 (CDR3) sequence similarity both within and among subjects, suggesting antigenic selection and shared antigen recognition. CDR3 similarities were shared among expanded clones from individuals discordant for canonical Ro and La autoantibodies, suggesting recognition of alternative SG antigen(s). The extent of SG clonal expansion correlated with reduced saliva production and increased SG fibrosis, linking expanded SG T cells with glandular dysfunction. Knowledge of paired TCRα and β sequences enables further work toward identification of target antigens and development of novel therapies.


Figures

Figure 1
Figure 1. Memory CD4+ T cell clonal expansions are more frequent in salivary glands than in peripheral blood of primary Sjögren’s syndrome subjects.
The percentages of all memory CD4+ T cells that were part of clonal expansions are shown for salivary gland (SG) and peripheral blood (PB) of each subject (P = 0.006, matched pairs Wilcoxon signed-rank test).
Figure 2
Figure 2. Numbers and sizes of expanded clones derived from salivary gland.
Each circle represents an expanded T cell clone. Numbers inside of circles indicate the number of cells expressing nucleotide-identical complementarity-determining region 3 (CDR3) sequences. Letters designate particular expanded clones and match designations in Table 3. The total number of single cells evaluated is shown below each subject label.
Figure 3
Figure 3. Biodiversity metrics plotted as a function of sequence depth.
Separate salivary gland (SG) and peripheral blood (PB) data sets, each containing the complete TCRα and TCRβ CDR3 sequences, were evaluated using alpha biodiversity statistics. Under all metrics, there was a significant difference in diversity between the PB and SG samples at increasing depth. P values are from nonparametric, 2-tailed, 2-sample t tests. Error bars are SD.
Figure 4
Figure 4. Heatmap BLAST similarity matrix of expanded salivary gland T cell receptor β complementarity-determining region 3 amino acid sequences from 10 subjects with primary Sjögren’s syndrome.
Red indicates identity. Blue indicates minimum similarity. The numbers on the color scale indicate the fraction of the maximal blast score, with 1 indicating identity and 0 indicating no similarity. Clusters selected for multiple sequence alignments are indicated by the lines connecting each to its designation, as is noted in the white boxes. Expanded clone designations are as indicated in Table 3 and Figure 2.
Figure 5
Figure 5. Heatmap BLAST similarity matrix of expanded salivary gland T cell receptor α complementarity-determining region 3 amino acid sequences from 10 subjects with primary Sjögren’s syndrome.
Red indicates maximum similarity. Blue indicates identity. The numbers on the color scale indicate the fraction of the maximal blast score, with 1 indicating identity and 0 indicating no similarity. Clusters selected for multiple sequence alignments are indicated by the lines connecting each to its designation, as is noted in the white boxes. Expanded clone designations are as indicated in Table 3 and Figure 2.
Figure 6
Figure 6. Alignment of T cell receptor β sequences from expanded salivary gland clones and closely related unique cells.
Cluster designations match those in Figure 4. Subject designations indicate expanded clones and match designations in Table 3 and Figure 3. Sequences that are part of clonal expansions (Exp) are indicated by “+,” and unique sequences are indicated as “–.” Underlined residues are derived from the NDN-region. Nonunderlined residues are derived from germline sequence. Gray shading indicates similar or identical residues derived from germline sequence. Blue shading indicates similar or identical residues derived from the NDN-region. Ro and La antibody status of each subject is listed as positive (+) or negative (–).
Figure 7
Figure 7. Alignment of T cell receptor α sequences from expanded salivary gland clones and closely related unique cells.
Cluster designations match those indicated in Figure 5. Subject (Subj) designations indicate particular expanded clones and match designations in Table 3 and Figure 3. For cells with two α chains, the second one is designated with a prime symbol. Sequences that are part of clonal expansions (Exp) are indicated by “+,” and unique sequences are indicated as “–.” Shading and underlining are as described in the legend for Figure 6. Ro and La antibody status of each subject is listed as positive (+) or negative (–).
Figure 8
Figure 8. Convergent recombination between unrelated individuals in salivary gland CD4+ T cells.
Differing gene segments and/or N-region additions lead to identical complementarity-determining region 3 (CDR3) amino acid sequences. Nucleotide sequences deriving from the indicated V and J genes are shown in blue and green, respectively. N-region additions are indicated in red.
Figure 9
Figure 9. Alignment of complementarity-determining region 3 sequences from expanded clones from peripheral blood and salivary gland.
Shading and underlining are as described in the legend for Figure 6.
Figure 10
Figure 10. T cell receptor complementarity-determining region 3 sequences from salivary gland CD4+ T cells are significantly enriched in degree of sequence relatedness compared with healthy peripheral blood CD4+ T cells.
T cell receptor (TCR) deep-sequencing data from two healthy DR3/DQ2+ control subjects were sampled 2,000 times, and pairwise BLAST similarity scores were obtained. These were used to generate hypothetical distributions of the percentage of comparisons having scores ≥50% of the maximum value (gray). The dashed lines indicate the percentage of salivary gland (SG) CD4+ memory T cell TCR sequences having BLAST scores ≥50% of the maximum value in the actual SG TCR sequence data. Significance was calculated from the cumulative distribution function of the estimated hypothetical distribution (P = 4.1 × 10⁻⁶ and P = 3.4 × 10⁻¹⁹ goodness-of-fit tests for the TCRα and TCRβ comparisons, respectively).
Figure 11
Figure 11. The frequency of detected salivary gland clonal expansions significantly correlates with measures of oral disease.
The percentages of clonally expanded salivary gland (SG) CD4 T cells (A) negatively correlate with whole unstimulated salivary flow (whole unstimulated salivary flow [WUSF]) and (B) positively correlate with the extent of SG fibrosis. Two-tailed Spearman rank correlation test.

References

    1. Jonsson R, Vogelsang P, Volchenkov R, Espinosa A, Wahren-Herlenius M, Appel S. The complexity of Sjogren’s syndrome: novel aspects on pathogenesis. Immunol Lett. 2011;141(1):1–9. doi: 10.1016/j.imlet.2011.06.007. - DOI - PubMed
    1. Mavragani CP, Moutsopoulos HM. Sjogren’s syndrome. Annu Rev Pathol. 2014;9:273–285. doi: 10.1146/annurev-pathol-012513-104728. - DOI - PubMed
    1. Vitali C, et al. Classification criteria for Sjogren’s syndrome: a revised version of the European criteria proposed by the American-European Consensus Group. Ann Rheum Dis. 2002;61(6):554–558. doi: 10.1136/ard.61.6.554. - DOI - PMC - PubMed
    1. Daniels TE. Labial salivary gland biopsy in Sjogren’s syndrome. Assessment as a diagnostic criterion in 362 suspected cases. Arthritis Rheum. 1984;27(2):147–156. doi: 10.1002/art.1780270205. - DOI - PubMed
    1. Fox RI, Carstens SA, Fong S, Robinson CA, Howell F, Vaughan JH. Use of monoclonal antibodies to analyze peripheral blood and salivary gland lymphocyte subsets in Sjogren’s syndrome. Arthritis Rheum. 1982;25(4):419–426. doi: 10.1002/art.1780250410. - DOI - PubMed