. 2016 Jul 14;535(7611):308-12.
doi: 10.1038/nature18610. Epub 2016 Jun 29.

Ki-67 acts as a biological surfactant to disperse mitotic chromosomes

Affiliations

Ki-67 acts as a biological surfactant to disperse mitotic chromosomes

Sara Cuylen et al. Nature. .

Abstract

Eukaryotic genomes are partitioned into chromosomes that form compact and spatially well-separated mechanical bodies during mitosis. This enables chromosomes to move independently of each other for segregation of precisely one copy of the genome to each of the nascent daughter cells. Despite insights into the spatial organization of mitotic chromosomes and the discovery of proteins at the chromosome surface, the molecular and biophysical bases of mitotic chromosome structural individuality have remained unclear. Here we report that the proliferation marker protein Ki-67 (encoded by the MKI67 gene), a component of the mitotic chromosome periphery, prevents chromosomes from collapsing into a single chromatin mass after nuclear envelope disassembly, thus enabling independent chromosome motility and efficient interactions with the mitotic spindle. The chromosome separation function of human Ki-67 is not confined within a specific protein domain, but correlates with size and net charge of truncation mutants that apparently lack secondary structure. This suggests that Ki-67 forms a steric and electrostatic charge barrier, similar to surface-active agents (surfactants) that disperse particles or phase-separated liquid droplets in solvents. Fluorescence correlation spectroscopy showed a high surface density of Ki-67 and dual-colour labelling of both protein termini revealed an extended molecular conformation, indicating brush-like arrangements that are characteristic of polymeric surfactants. Our study thus elucidates a biomechanical role of the mitotic chromosome periphery in mammalian cells and suggests that natural proteins can function as surfactants in intracellular compartmentalization.


Figures
Extended Data Figure 1
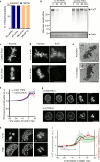
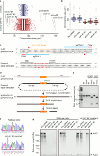
Extended Data Figure 1. Generation of a Ki-67 siRNA #2-resistant HeLa cell line by homozygous mutation of endogenous Ki-67 genomic loci.
a, Quantification of chromosome area as in Fig. 1b, but displayed for each individual siRNA, shows that the three siRNAs causing strongest chromosome clustering all target Ki-67. Each data point corresponds to the median chromosome area of all live mitotic cells in a specific siRNA condition. Median, quartiles and 1.5 * interquartile range of controls (siControls and untransfected) and the siRNA library are indicated. The top four siRNAs causing an increased chromosome area all target proteins involved in cytokinesis. Hence the chromosome area increase is likely to be a consequence of polyploidization by cytokinesis failure in preceding divisions. b, Chromosome areas of all individual live mitotic cells from the original RNAi screening data. Each data point corresponds to the chromosome area in a single cell. This reveals that the clustering phenotype is very penetrant within the cell population. c, CRISPR/Cas9 nickase strategy to mutate the siKi-67 #2 target site without changing the amino acid coding sequence. Red triangles indicate DNA strand nicking sites. PAM: Protospacer Adjacent Motif. sgRNA: single guide RNA. d, Schematic of genotyping strategy. A newly generated HindIII (or BglI) restriction site generated by CRISPR/Cas9 nickase as depicted in c was used to detect correctly mutated alleles. e, HindIII and BglI restriction fragments were detected by gel electrophoresis following the assay depicted in d, showing successful recombination of all three Ki-67 alleles present in HeLa cells. f, DNA sequencing chromatogram of the siKi-67 #2 target site of a wildtype and the CRISPR/Cas9-mutated cell line, respectively. Asterisks indicate mutated nucleotides. g, Western blot performed on whole cell lysates of wildtype or siKi-67 #2 resistant cell lines 48 h after indicated siRNA transfections demonstrates that all siRNAs used in this study (siKi-67 #1-4) efficiently depleted Ki-67 in wildtype cells and that the CRISPR/Cas9 mutated cell line was fully resistant against siKi-67 #2 but still sensitive to siKi-67 #1. The two bands labeled by anti Ki-67 antibody correspond to the two Ki-67 isoforms with predicted molecular masses of 320 and 359 kDa.
Extended Data Figure 2
Extended Data Figure 2. Ki-67 is not required for initial chromosome individualization and condensation but for maintenance of chromosome separation.
a, Quantification of phenotype penetrance in Fig. 2a. Live metaphase cells recorded by an automated imaging pipeline were classified as coherent or normal by supervised machine learning (3 independent experiments with total sample numbers of n = 111 (no siRNA), n = 88 (siControl), n = 112 (siKi-67 #1), n = 131 (siKi-67 #2)). b, Western blot analysis of HeLa wildtype cells, performed at indicated time points after siKi-67 #1 transfection, showed efficient depletion of Ki-67 at 48 – 72 h post siRNA transfection. This time window was hence used for all further experiments. For gel source data, see Supplementary Fig. 1. c, Live hTERT-RPE1 cells stained with Hoechst were imaged 48 h after siRNA transfection. Control cells (n = 21) had spatially separate chromosomes, whereas Ki-67 siRNA-transfected cells (n = 17) had metaphase plates that appeared as a contiguous mass of chromatin. d, Mouse embryonic stem cells were fixed 48 h after siRNA transfection and stained using anti-Ki-67 antibody and Hoechst. Metaphase plates that lacked Ki-67 signal had chromosomes merged into an unstructured mass of chromatin (lower panel), whereas all cells with residual levels of Ki-67, owing to incomplete RNAi-mediated protein depletion, had normal metaphase plate morphologies. Representative examples for n = 20 cells. e, Electron micrographs of HeLa cells transfected with siRNAs as indicated demonstrate that chromosomes appeared as a single contiguous mass. Representative images for n = 10/10 control and 9/11 for Ki-67 RNAi cells. Closed arrowheads mark dark chromatin areas; open arrowheads mark lighter grainy layer of chromosome periphery. f, Quantification of prophase chromosome condensation using pixel intensity standard deviation of the H2B-mCherry fluorescence as a measure for homogeneity of chromatin. Curves indicate mean and SD of 16 cells per condition. g, Representative example cells of the chromosome condensation assay in f. h, Ki-67 localization on chromosomes in live prophase HeLa cells expressing H2B-mCherry/Ki-67-EGFP (NEBD, t = 0 min) i, was quantified (excluding nucleoli) during mitotic entry. A significant change (p < 0.01 by Student’s t-test) in chromosome condensation (marked by red circle; compared to the initial 4 frames) occurs 11 min before a significant increase in Ki-67 localization (green circle). Curves indicate mean and SD of 13 cells. Bars, 5 µm in e, all others 10 µm.
Extended Data Figure 3
Extended Data Figure 3. Internal chromosome organization is not affected by Ki-67 depletion.
a, Hoechst-stained chromosomes of control or Ki-67-depleted HeLa cells were segmented by thresholding, subsequently a convex hull was fitted around segmented chromosomes (red line) and b, the segmented chromatin area and area of a convex hull fit were quantified. The calculated chromatin area of Ki-67 depleted cells was similar to control depleted cells, which demonstrates that Ki-67 depletion has no detectable effect on chromosome-internal compaction. Ki-67 depleted cells lack inter-chromosomal space as the convex hull area is almost identical with the chromatin area (n = 16 for each siRNA, bars indicate mean ± SD, **** indicates p < 0.0001 by paired Wilcoxon matched-pairs signed rank test). c, Live HeLa cell expressing H2B-mCherry/EGFP-Kleisin-γ were imaged 72 h after siKi-67 #1 or control siRNA transfection and d, mean and SD of sister chromosome axis distance were quantified (n = 508 from 3 experiments (control RNAi), n = 380 from 4 experiments (Ki-67 RNAi), n = 398 from 3 experiments (no RNAi)). e, Live HeLa cell stably expressing H2B-mCherry/CENP-A-EGFP were imaged ~60 h after siKi-67 #1 or control siRNA transfection and f, mean and SD of interkinetochore distance were quantified (n = 875 from 3 experiments (control RNAi), n = 1489 from 5 experiments(Ki-67 RNAi), n = 818 from 3 experiments (no RNAi)). g, Centromere elasticity assay. Metaphase HeLa cells stably expressing H2B-mCherry/CENP-A-EGFP were imaged with 10 s time-lapse before and after nocodazole addition. The interkinetochore distance measurement over time in 12 control cells (control siRNA = light gray and untransfected cells = dark gray) and 10 cells transfected with siKi-67 #1 (gray lines) demonstrated that kinetochores were under tension in Ki-67 depleted cells. The red line indicates the mean. h, Chromosome spreads of untransfected or Ki-67 depleted HeLa cells appeared similar. Representative examples of 35 chromosome spreads from 2 independent experiments are depicted. i, Nuclei from control or Ki-67 depleted HeLa cells were treated with titrated amounts of MNase and DNA was subjected to 1.5% agarose electrophoresis. No detectable difference was seen in two independent experiments. Bars, 10 µm in a, h, 5 µm in c, e.
Extended Data Figure 4
Extended Data Figure 4. Chromosome clustering and motility decrease are not caused by spatial confinement.
a-b, Representative example of kinetochore tracking performed in interphase (quantified in Fig. 2e). a, Live interphase HeLa cells stably expressing H2B-mCherry/CENP-A-EGFP were imaged in presence of nocodazole and b, kinetochores were tracked in time-lapse videos. c, Representative MSD analyses of kinetochore tracks (CENP-A-EGFP) of mitotic HeLa cells (from Fig. 2c, d) and of the interphase cell in panel a. d, Western blot analysis of HeLa wildtype cells, performed at indicated time points after siKi-67 #1 or #2 transfection confirmed that both siRNAs deplete Ki-67 protein with similar efficiency. e, Interphase cells expressing H2B-mCherry 48 h after indicated siRNA transfections f, were quantified with regard to nuclear size by automated segmentation of H2B-mCherry (bars indicate mean ± SD, **** indicates p < 0.0001 by Kolmogorov-Smirnov test, data from 25 random positions: n = 303 (siControl), n = 303 (siKi-67 #1), n = 246 (siKi-67 #2)). Only siKi-67 #1 caused a significant decrease in nuclear size while siKi-67 #2, which was used for kinetochore tracking in Fig. 2c-e, had no effect on nuclear size. As Ki-67 knockout cells also had a normal nuclear size (Extended Data Figure 6f, g), we conclude that the effect of siKi-67 #1 on nuclear size is likely due to off-target protein depletion. g, Quantification of mitotic cell size of control or Ki-67 depleted cells demonstrated that similar to f, only siKi-67 #1 led to a significant decrease in cell size consistent with an off-target effect (bars indicate mean ± SD, **** indicates p < 0.0001 by Mann-Whitney test, total sample numbers: n = 74 (siControl), n = 100 (siKi-67 #1), n = 95 (siKi-67 #2)). As kinetochore tracking was based on siKi-67 #2, the reduced motility of mitotic chromosomes cannot be attributed to cell size changes. h, Live HeLa cells stably expressing H2B-mRFP/LAP2β-EGFP were imaged 48 h after siRNA transfection as they entered mitosis in the presence of nocodazole (n = 15 per condition). Bars, 2 µm in a, b, 10 µm in e, h.
Extended Data Figure 5
Extended Data Figure 5. Ki-67 depletion causes a prolonged mitosis and impairs access of spindle microtubules to chromosomes.
a, Mitotic progression determined by live-cell microscopy of HeLa cells expressing H2B-Aurora B FRET biosensor, after siRNA transfection as indicated. 3 independent experiments with total sample numbers of n = 145 (siControl), n = 97(siKi-67 #2), n = 134 (siKi-67 #3),n = 164 (siKi-67 #4). b, Live HeLa cells stably expressing EB3-EGFP were imaged 2 minutes after release from a 2 h nocodazole treatment, chromosome areas were identified (yellow lines) and c, EB3-EGFP mean fluorescence was measured in chromosome areas (bars indicate mean and SEM from 50 cells per condition, ** indicates p < 0.01 by Mann-Whitney test). Bar, 10 µm.
Extended Data Figure 6
Extended Data Figure 6. Generation of a Ki-67 knockout cell line.
a, CRISPR/Cas9 was used to generate a HeLa cell line with indicated deletions on exon 5 of the Ki-67 allele. b, DNA sequencing chromatogram confirmed that no further alleles are present. c, Metaphase plates of live HeLa wildtype and Ki-67 knockout cells stained with Hoechst (n = 30 per cell line). d, Western blot performed on whole cell lysates of wildtype or Ki-67 knockout cells. The two high molecular weight bands labeled by anti Ki-67 antibody in wildtype that correspond to the two Ki-67 isoforms are undetectable for Ki-67 knockout cells. Actin was used as a loading control. e, Representative time-lapse image series of a Ki-67 knockout cell proceeding from prophase to prometaphase in the presence of nocodazole (n = 12, see Supplementary Video 3). Chromosomes are labeled with SiR-Hoechst and two regions were selected to exemplify coalescence of chromosomes upon their close approach. Arrows mark regions just before their coalescence. f, Automated segmentation of SiR-Hoechst-labeled interphase nuclei of wildtype and Ki-67 knockout cells confirmed a normal nuclear size of Ki-67 knockout cells (mean and SD of 200 wildtype and 270 Ki-67 KO cells). g, Representative example images of interphase wildtype or Ki-67 knockout cells stained with SiR-Hoechst of the quantification in f. h, The sensitivity of Ki-67 knockout cells to low dose nocodazole, caffeine or a topoisomerase II inhibitor (ICRF-193) was compared to wildtype by a colony formation assay. Representative images from two to three independent experiments are shown. Bar, 5 µm in c, 10 µm in e, g.
Extended Data Figure 7
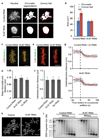
Extended Data Figure 7. Ki-67 has little secondary structure, is highly positively charged, and its absence can be partly compensated by overexpression of core histones.
a, Folding and charge prediction of full length Ki-67 based on FoldIndex and EMBOSS webtools using a sliding window of 100. Unfolded regions are depicted in green, folded regions in orange. Positive charge is marked in blue, negative charge in red. b, Quantification of overexpressed histone levels in individual cells related to the mitotic chromosome morphology phenotype, classified by visual inspection. Note that the mean fluorescence values are not comparable to Fig. 3c as different imaging settings had to be used. Cells are from 4-5 independent experiments. c, Radial localization of overexpressed H2B-mNeonGreen in live Ki-67 knockout cells (n = 20). Normalized fluorescence intensity along line profiles across a chromosome arm of live Ki-67 knockout cells transiently transfected with H2B-mNeonGreen (upper panel) or Ki-67-mNeonGreen (lower panel) indicate that overexpressed H2B binds to the surface as well as internal region within chromosomes. d, e, Stable association of H2B-mNeonGreen with mitotic chromosomes. d, Half of the mitotic chromosomes in Ki-67 knockout cells highly overexpressing H2B-mNeonGreen were photobleached and the recovery of fluorescence was followed by time-lapse recording in an image region (yellow box). Representative example of the quantification in e. e, Curves indicate mean and SD of 20 photobleached and 19 unbleached control cells. f, Quantification of mitotic chromosome area relative to total cell area for cells shown in panel b and Fig. 3c. Boxes indicate median, quartiles and 1.5 * interquartile range (n = 30 for Ki-67, n = 64 for H2B). g, Live Ki-67 knockout cell transiently transfected with a H2B-mNeonGreen and stained with SiR-Hoechst. While 25 of 64 rescued cells displayed fully separated chromosomes (Fig. 3e), a large fraction of cells (39 of 64 rescued cells) showed detectable chromosome individualization at a lower extent compared to wildtype cells. Representative single z-section of the latter is shown. h, Live Ki-67 knockout cells transiently transfected with plasmids for expression of the indicated histone fused to mNeonGreen and stained with SiR-Hoechst. Representative single z-sections of 12-18 cells from 2-3 independent experiments are depicted. Although chromosome individualization was restored, chromosomes were not separated to the same extent as in wildtype cells. Bars, 10 µm.
Extended Data Figure 8
Extended Data Figure 8. Fluorescence correlation spectroscopy of endogenous Ki-67 tagged with EGFP.
a, Western blot performed on whole cell lysates of a HeLa cell line overexpressing GFP-tagged Ki-67 from a bacterial artificial chromosome (BAC), and of two different clones in which all endogenous Ki-67 alleles were N-terminally tagged with EGFP (C1, C2). The two lower bands labeled by anti Ki-67 antibody in the BAC cell line (black arrows) correspond to the two wildtype Ki-67 isoforms. The EGFP-Ki-67 versions appear upshifted (green arrows) and the band of the small EGFP-tagged isoform overlaps with the band of the wildtype large isoform. b-h, FCS measurement from 3 independent experiments with 111 cells (C1) and 156 cells (C2). b, Imaging and analysis pipeline for FCS-calibrated imaging. Metaphase cells were identified based on Hoechst staining and imaged in 3D (only the central slice is shown). In the cytoplasm of the central slice an FCS measurement was performed. From the photon counts (right upper panel) the autocorrelation function (ACF) was computed (right lower panel). From the fit of the ACF to Eq. S1 the number of particles N in the focal volume was obtained. The concentration at the FCS point was computed by dividing N by the effective focal volume Veff and the Avogadro's constant NA. For details see Supplementary Methods. c, A calibration curve was obtained by plotting the concentration computed from FCS against the fluorescence intensity in a 5 x 5 pixel region at the FCS measurement point (Eq. S2, dashed line). d, Fluorescence microscopy image of live HeLa cell with endogenous Ki-67, labeled by EFGP, scaled to absolute Ki-67 concentration as determined by FCS. e, Example segmentation of chromosomes and the chromosome surface used for quantification in f-h. Segmentation was performed in 3D but for simplification only a single z-section is shown. A chromatin mask was obtained by segmentation of the Hoechst signal. To determine Ki-67 concentration on chromosomes the mask was dilated to include Ki-67 signal at the outer chromosome surface (Expanded chromatin mask). To calculate Ki-67 molecules on the outer chromosome surface, a rim around the chromatin mask was used (outer rim mask). See Supplementary Methods for details. f-h, Quantification of FCS measurements. Boxes indicate median, quartiles and 1.5 * interquartile range. f, Mean Ki-67 concentration in the cytoplasm and on 3D-segmented chromosomes using the expanded chromatin mask depicted in e. g, Total number of Ki-67 molecules within the whole DNA volume using the expanded chromatin mask depicted in e. h, Density of Ki-67 molecules on the chromosome surface using the outer rim mask depicted in e. Bars, 10 µm.
Extended Data Figure 9
Extended Data Figure 9. Dual-color labeling of Ki-67’s protein termini indicates an extended conformation oriented perpendicular to the mitotic chromosome surface.
a, Schematic of Ki-67 labeled at the N-terminus (red) and at the chromatin-binding C-terminus (green). At high densities, Ki-67 might acquire extended brush-like conformations, as known for polymeric surfactants. b, Multispectral fluorescent beads with 500 nm diameter were imaged as reference data to determine dual-color localization accuracy. The chromatic register shift in the green and red channel was corrected by image registration. Line profiles (white line) yielded fluorescence profiles c, for green and red channels. A sum of two Gaussian functions was fitted (solid line) for each channel and peak-to-peak distances of the corresponding single Gaussian functions (dotted lines) were measured for green (d(G)) and red (d(R)) channels. d, The accuracy of the localization method as illustrated in b, c was determined based on the absolute difference between green and red peak-to-peak distances divided by 2. Mean (black line) and standard deviation (whiskers) are indicated. e-h, Representative example cells of the quantification in Fig. 4c. e, Live HeLa wildtype cell expressing EGFP-mCherry-Ki-67. Representative example of a sister chromatid pair oriented perpendicular to the imaging plane. The line profile (white line) yielded a f, fluorescence profile across one sister chromatid. A sum of two Gaussian functions was fitted (solid line) for each channel and peak-to-peak distances of the corresponding single Gaussian functions (dotted lines) were measured for green (d(G)) and red (d(R)), respectively. g, Live HeLa wildtype cell expressing EGFP-Ki-67-mCherry. Representative example of a sister chromatid pair oriented perpendicular to the imaging plane. The line profile (white line) yielded a h, fluorescence profile across one sister chromatid. A sum of two Gaussian functions was fitted (solid line) for each channel and peak-to-peak distances of the corresponding single Gaussian functions (dotted lines) were measured for green (d(G)) and red (d(R)), respectively. i, Model illustrating that an increased grafting density of Ki-67 at the chromosome surface might gradually increase the polymer brush height due to repulsive forces between the polymers. Bars, 1 µm.
Figure 1
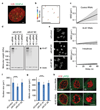
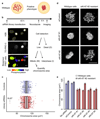
Figure 1. RNAi screen for mitotic chromosome surface adhesion regulators.
a-c, RNAi screen targeting 1295 genes. a, Expected chromosome phenotypes in mitotic cells with depolymerized spindles. b, Experimental design to detect chromosome clustering in live mitotic HeLa cells based on the viability marker TO-PRO-3 and a FRET biosensor for mitotic phosphorylation. c, Individual data points correspond to the median chromosome area of all live mitotic cells per target gene, based on 2 or 3 different siRNAs. Mean, quartiles, and 1.5 * interquartile range are indicated. d-e, Rescue of RNAi phenotype. d, HeLa cells, wildtype or strain mutated in siKi-67 #2 target site, were transfected as indicated and imaged live in presence of nocodazole (n = 9-10 images per condition). e, Quantification of chromosome clustering as in b. The median size of the chromosome area was determined in 3 experiments (bars indicate mean ± SD, n > 71 cells per condition and experiment, for exact sample numbers see Methods). Bars, 10 µm.
Figure 2
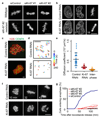
Figure 2. Spatial separation of mitotic chromosomes by Ki-67 is important for chromosome motility.
a, Live HeLa cells, wildtype or siKi-67 #2-resistant strain, transfected as indicated and stained with Hoechst. Quantified in Extended Data Fig. 2a. b, Time-lapse microscopy of HeLa cells expressing fluorescently-tagged H2B, transfected as indicated (NEBD, t = 0 min, n = 16 per condition). c-e, Kinetochore tracking. c, Live mitotic HeLa cells stably expressing H2B-mCherry/CENP-A-EGFP transfected with indicated siRNAs were imaged in presence of nocodazole and d, kinetochores were tracked in time-lapse videos. e, Diffusion coefficients derived from mean square displacement (MSD) analyses. Bars indicate mean ± SD. f, Live mitotic HeLa cells expressing fluorescently-tagged H2B imaged after nocodazole washout (t = 0 min) g, were scored for anaphase entry (cumulative frequency, 3 independent experiments with total sample numbers of n = 75 (siControl), n = 51 (siKi-67 #2), n = 82 (siKi-67 #3), n = 69 (siKi-67 #4). Bars, 2 µm in c, d, all others 10 µm.
Figure 3
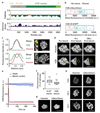
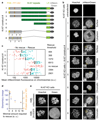
Figure 3. Ki-67's chromosome separation function is not confined within a specific subdomain.
a, Design of Ki-67 constructs. b, Ki-67 constructs were transfected in nocodazole-treated Ki-67 knockout HeLa cells (inserts are magnifications of yellow boxes) and c, analyzed for restoration of mitotic chromosome separation. Individual cells (dots) were classified by chromosome morphology (clustered: no rescue; dispersed: rescue) and plotted according to expression levels. Black bars indicate threshold required for mitotic chromosome separation. d, Correlation of Ki-67-truncation expression levels required for mitotic chromosome separation (as in c, relative to full length Ki-67) with their size and predicted electrical charge at pH 7. e, Live Ki-67 knockout HeLa cells transfected with indicated constructs (quantified in Extended Data Fig. 7b). Bars, 10 µm.
Figure 4
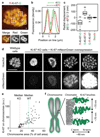
Figure 4. Densely grafted Ki-67 molecules have an extended conformation perpendicular to the chromosome surface.
a, Example of a live HeLa cell (from the analysis in c) expressing mCherry-Ki-67-EGFP. Chromosomes oriented perpendicular to the imaging plane (white boxes) were analyzed by line profiles across one sister chromatid (bottom panels; white line) and b, a sum of two Gaussian functions (solid line) was fitted to the line profile to measure peak-to-peak distance of the corresponding single Gaussians (dotted lines). c, The average distance between the labeled Ki-67 polypeptide termini along the axis perpendicular to the chromosome surface was calculated for mCherry-Ki-67-EGFP (n = 53), EGFP-Ki-67-mCherry (n = 52), EGFP-mCherry-Ki-67 (n = 44) and multispectral fluorescent beads (n = 34). Boxes indicate median, quartiles and 1.5 * interquartile range. d, Live nocodazole-treated Ki-67 knockout cells expressing different levels of Ki-67-mNeonGreen e, were quantified with reference to chromosome area and Ki-67 levels on chromosomes (each dots represents a cell, 4 independent experiments, dashed lines indicate the median of 39 wildtype and 40 Ki-67 knockout cells). f, Model of Ki-67-mediated mitotic chromosome repulsion. Bars, 1 µm in a,10 µm in d.

Comment in

References

    1. Kschonsak M, Haering CH. Shaping mitotic chromosomes: From classical concepts to molecular mechanisms. Bioessays. 2015;37:755–766. - PMC - PubMed
    1. Hirano T. Condensin-Based Chromosome Organization from Bacteria to Vertebrates. Cell. 2016;164:847–857. - PubMed
    1. Ohta S, Wood L, Bukowski-Wills JC, Rappsilber J, Earnshaw WC. Building mitotic chromosomes. Curr Opin Cell Biol. 2011;23:114–121. - PMC - PubMed
    1. Naumova N, et al. Organization of the mitotic chromosome. Science. 2013;342:948–953. - PMC - PubMed
    1. Van Hooser AA, Yuh P, Heald R. The perichromosomal layer. Chromosoma. 2005;114:377–388. - PubMed

Publication types