. 2016 Sep:49:41-46.
doi: 10.1016/j.gaitpost.2016.06.018. Epub 2016 Jun 15.

Lower leg compensatory strategies during performance of a step up and over task in patient six-months after total knee arthroplasty

Affiliations

Lower leg compensatory strategies during performance of a step up and over task in patient six-months after total knee arthroplasty

Federico Pozzi et al. Gait Posture. 2016 Sep.

Abstract

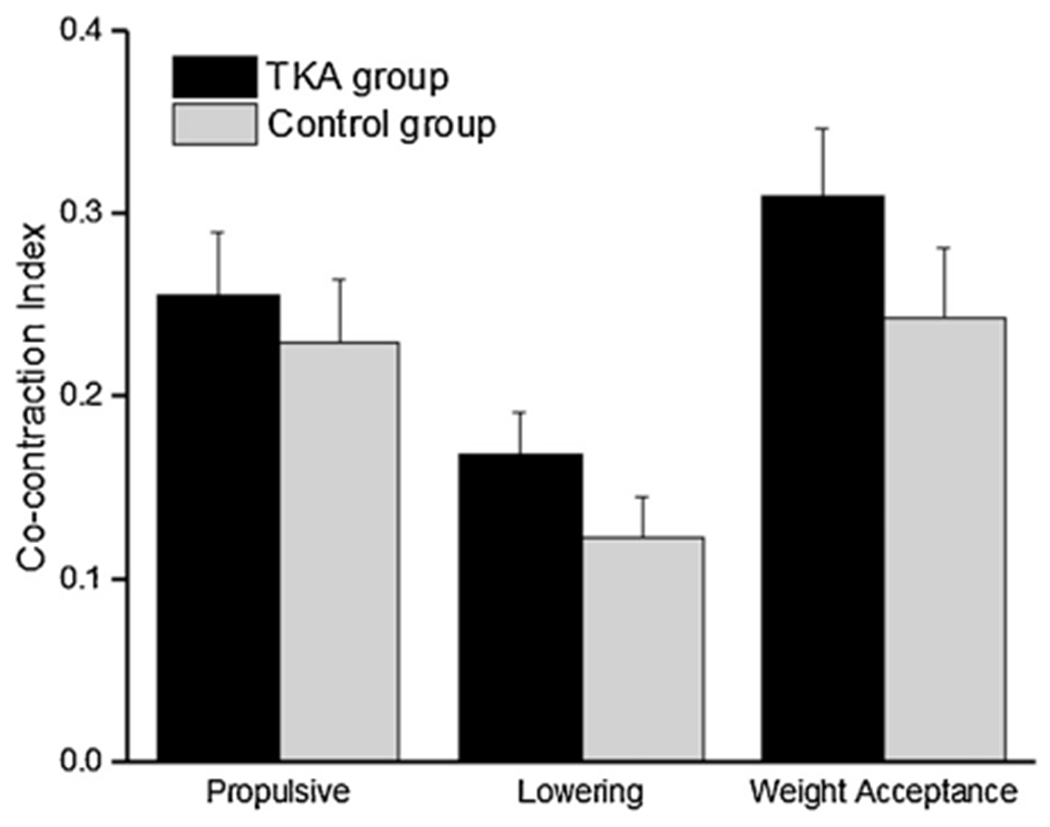
The purpose of this study was to assess the ankle, knee, and hip joint contributions to the total support moment (TSM) and the activation patterns of muscles in the lower leg in patients after total knee arthroplasty (TKA) and healthy older adults during the step up and over task. Moreover, the relationship between quadriceps strength and knee contribution to TSM was measured. Twenty patients six-months after TKA and twenty healthy controls were recruited for this study. Motion and surface electromyographic (EMG) analyses were performed during a step up and over task. Biomechanics and EMG variables were compared between groups using ANCOVA models with movement speed as covariate. Patients after TKA had reduced contribution to the TSM from the knee joint, and greater contribution from the hip and ankle joints, possibly to compensate for the reduced contribution at the knee. No consistent differences of EMG activation or co-contraction were found between groups. Patients with stronger quadriceps had significantly higher knee contribution to TSM during the lowering phase of the task. The results of this study suggest that patients after TKA may use compensatory strategies at the hip and ankle joints to safely perform the step up and over task. Patients may rely on the force generating ability of the quadriceps during the lowering phase as they are not able to compensate with other joints of the lower extremity during this phase of the task.

Keywords: Electromyography; Quadriceps strength; Total support moment; Trunk.


Figures

Fig. 1.
Fig. 1.
Representative participant performing the step up and over task. Participant is completing the propulsive (A), lowering (B), and weight acceptance (C) phases of the task. Participants wore shoes during the data collection.
Fig. 2.
Fig. 2.
Total support moment (TSM) for the stepping (A) and landing (B) legs of the TKA (grey line) and control (grey line) groups. Data are reported as unadjusted value, normalized to 100% of stance. The three vertical solid lines represent the peaks TSM. The dashed vertical line represents the highest vertical position of the markers on the pelvis shell. The three intervals considered for the electromyographic analysis include: two interval on the stepping limb, from 0 to peak TSM 1 and from Highest position to peak TSM 2 (A); and one interval on the landing limb, from 0 to peak 3 (B). *, indicates significant difference between groups.
Fig. 3.
Fig. 3.
Speed adjusted average ankle, knee, hip joints contribution to total support moment (TSM) during the three phases of the step up and over task. During the lowering phase, the internal flexor moment measured at the hip joint does not contribute to the TSM and therefore has negative sign. Error bars represent standard error. *, indicates significant difference between groups.
Fig. 4.
Fig. 4.
Speed adjusted average co-contraction index for the vastus lateralis and lateral hamstring of the TKA (black bars) and control (grey bars) groups. The indices were calculated in each time interval leading to each peak of TSM. Error bars represent the standard error.
Fig. 5.
Fig. 5.
Trunk flexion angle of the TKA (black bars) and control (grey bars) groups at each peak TSM during the step up and over task. Error bars represent one standard deviation. Data are reported as unadjusted value and include a total of 33 participants (16 TKA group, 17 control group).

Similar articles

Cited by

References

    1. McClelland JA, Webster KE, Feller JA, Gait analysis of patients following total knee replacement: a systematic review, Knee 14 (2007) 253–263. - PubMed
    1. McClelland JA, Feller JA, Menz HB, Webster KE, Patterns in the knee flexion-extension moment profile during stair ascent and descent in patients with total knee arthroplasty, J. Biomech 47 (2014) 1816–1821, doi:10.1016/j.jbiomech.2014.03.026. - DOI - PubMed
    1. Mandeville D, Osternig LR, Chou L-S, The effect of total knee replacement on dynamic support of the body during walking and stair ascent, Clin. Biomech 22 (2007) 787–794, doi:10.1016/j.clinbiomech.2007.04.002. - DOI - PubMed
    1. Pozzi F, Snyder-Mackler L, Zeni J, Relationship between biomechanical asymmetries during a step up and over task and stair climbing after total knee arthroplasty, Clin. Biomech 30 (2015) 78–85, doi:10.1016/j.clinbiomech.2014.11.001. - DOI - PMC - PubMed
    1. Alnahdi AH, Zeni J.a., Snyder-Mackler L, Gait after unilateral total knee arthroplasty: frontal plane analysis, J. Orthop. Res 29 (2011) 647–652. - PMC - PubMed