. 2016 Jun 30;11(6):e0158424.
doi: 10.1371/journal.pone.0158424. eCollection 2016.

Regulation of the Na+/K+-ATPase Ena1 Expression by Calcineurin/Crz1 under High pH Stress: A Quantitative Study

Affiliations

Regulation of the Na+/K+-ATPase Ena1 Expression by Calcineurin/Crz1 under High pH Stress: A Quantitative Study

Silvia Petrezsélyová et al. PLoS One. .

Abstract

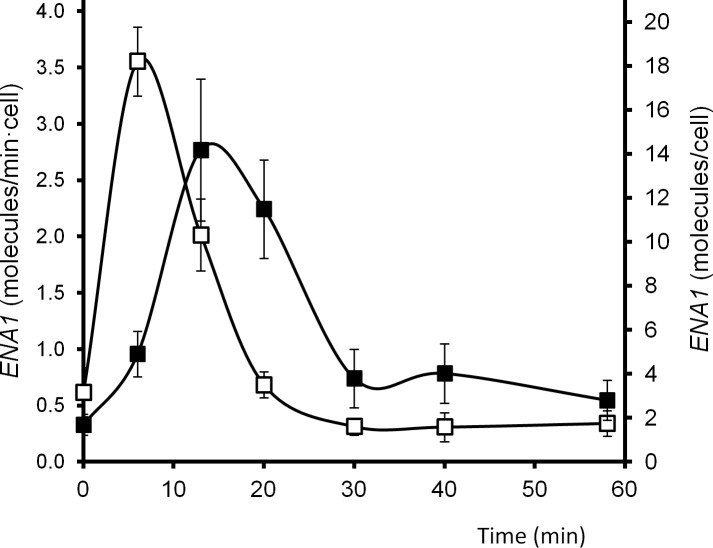
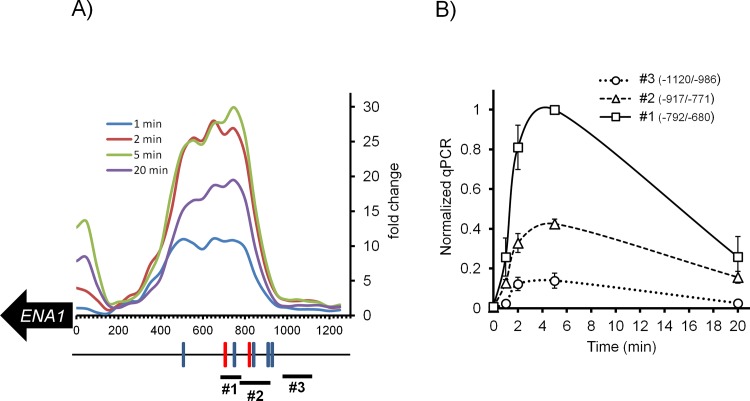
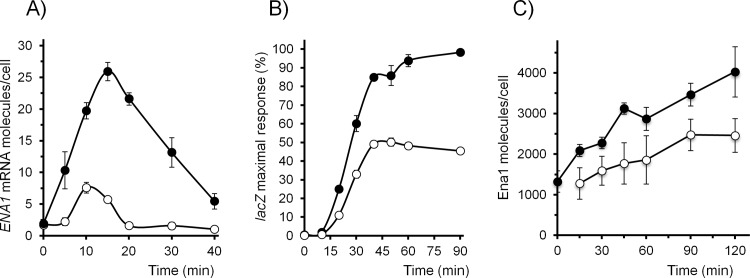
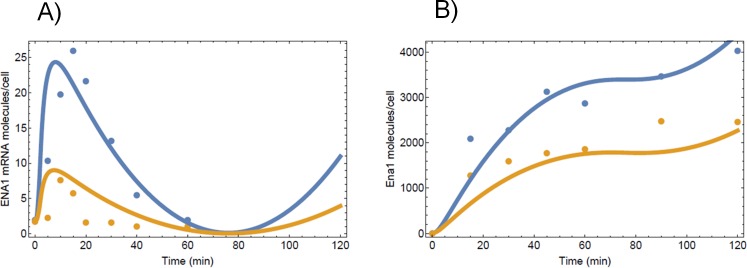
Regulated expression of the Ena1 Na+-ATPase is a crucial event for adaptation to high salt and/or alkaline pH stress in the budding yeast Saccharomyces cerevisiae. ENA1 expression is under the control of diverse signaling pathways, including that mediated by the calcium-regulatable protein phosphatase calcineurin and its downstream transcription factor Crz1. We present here a quantitative study of the expression of Ena1 in response to alkalinization of the environment and we analyze the contribution of Crz1 to this response. Experimental data and mathematical models substantiate the existence of two stress-responsive Crz1-binding sites in the ENA1 promoter and estimate that the contribution of Crz1 to the early response of the ENA1 promoter is about 60%. The models suggest the existence of a second input with similar kinetics, which would be likely mediated by high pH-induced activation of the Snf1 kinase.


Conflict of interest statement

Competing Interests: The authors have declared that no competing interests exist.

Figures

Fig 1
Fig 1. Transcription rate (TR) and mRNA accumulation (RA) of ENA1 upon high pH stimulation.
The transcription rate (open squares) and mRNA amount (closed squares) for the ENA1 gene under alkaline stress was obtained from GRO experiments [27]. In order to convert the radioactive intensities into real units, the mRNA concentrations and mRNA half-lives for the most expressed genes published in (Wang et al., 2002) were compared with radioactive intensities of RA and TR for the same genes at time 0 (steady-state conditions) to obtain a conversion factor. The conversion factor was applied to the complete set of GRO data under alkaline stress. ENA1 data were extracted from this set and represented as the average ± SEM of three experiments.
Fig 2
Fig 2. Time-course of the subcellular distribution of Crz1 upon high pH stress.
A) Cultures of strain SP039 (CRZ1:GFP-kanMX6 SIK1:mRFP-kanMX6) were shifted from pH 5.5 to pH 8.0 and the localization of Crz1 monitored by fluorescence confocal microscopy as described in Materials and Methods. Open circles denote the percentage of cells with nuclear Crz1 localization; closed circles, cytosolic localization. The discontinuous line show cells in which Crz1 entered the nucleus, then left the nucleus and later returned to it (they are, therefore, a subset of the total nuclear Crz1 values). Sik1 signal was used as marker of constitutive nuclear (nucleolar) localization. Data is presented as percentages calculated for 90 to 160 cells examined for each time-point. B) Example of time-lapse images of SP039 cells before and after induction of alkaline stress over a 20 min time-course (as in panel A).
Fig 3
Fig 3. Relative levels of Crz1 after switching cells to pH 8.0.
The number of Crz1 molecules/cell was calculated as described in Material and Methods and the value just prior alkalinization of the medium was set as the reference (100%). Data correspond to the mean ± SEM from 8 independent experiments.
Fig 4
Fig 4. Genome-wide recruitment of Crz1 to gene promoters in response to high pH stress.
ChIP-seq technology was used to identify intergenic regions immunoprecitating with Crz1 and accumulating at least two-fold reads than the genome average. A) The 150 genes showing peaks of reads above the indicated threshold were ranked according the number of reads at the peak. The relative occupancy with respect the highest value (HOR7) is shown for the top ten genes in the ranking. B) The percentage of genes showing the peak of accumulation of reads at a given time after alkalinization of the medium is shown.
Fig 5
Fig 5. Time-course profile of Crz1 recruitment at the ENA1 promoter following alkaline stress.
A) Cumulative counts of reads using a 50-nt window spanning the ENA1 promoter region are represented as fold-change over reads counted at time 0. The positions of CDRE deduced from computational analysis using the PWMTools website (http://ccg.vital-it.ch/pwmtools/pwmscan.php) of the Swiss Bioinformatics Institute are indicated as colored boxes on the black line. Red boxes denote the CDRE previously characterized in [23]. B) Evaluation of relative Crz1 binding to CDREs at positions -813/-821 and -719/-727 (red boxes in panel A). Chromatin immunoprecipitation using HA-tagged Crz1 was carried out and the immunoprecipitate used to amplify the -680/792; -771/-917; and -986/-1120 promoter regions (denoted as thick short lines 1, 2 and 3, respectively, in panel A). Data is presented as the mean ± SEM from 3–4 individual experiments assayed in duplicate and expressed as relative to the maximum value.
Fig 6
Fig 6. Impact of the absence of Crz1 on mRNA levels and Ena1 protein accumulation after high pH stress.
A) Time-course of the accumulation of Ena1 mRNA after shifting cells to pH 8.0. Total RNA from wild type (closed circles) and crz1 (open circles) cells was extracted and mRNA levels were determined by qRT-PCR and quantified as indicated in Materials and Methods. B) The strains described above were transformed with plasmid pKC201, carrying the lacZ reporter fused to the ENA1 promoter. Cells were exposed to pH 8.0 for the indicated times, collected, and β-galactosidase activity measured. C) Strain MLM001 (CRZ1) and MLM002 (crz1), carrying in both cases C-terminally GFP-tagged version of ENA1 were shifted to pH 8.0 for the indicated times and the amount of total Ena1 quantified by immunoblot using anti-GFP antibodies and internal standards of recombinant GFP protein. Data is presented as the mean ± SEM from 3 (panel A) or 4 (panels B and C) independent experiments.
Fig 7
Fig 7. Modeling of Ena1 mRNA and protein abundances upon high-pH stimulation.
Time-course of the Ena1 mRNA (panel A) and protein accumulation (panel B) after shifting cells to pH 8.0. Experimental data are shown as dots and the mathematical estimations, as lines (blue for wild type and yellow for mutant strains).

Similar articles

Cited by

References

    1. Arino J, Ramos J, Sychrova H. Alkali metal cation transport and homeostasis in yeasts. Microbiol Mol Biol Rev 2010;74(1):95–120 10.1128/MMBR.00042-09 - DOI - PMC - PubMed
    1. Banuelos MA, Sychrova H, Bleykasten-Grosshans C, Souciet JL, Potier S. The Nha1 antiporter of Saccharomyces cerevisiae mediates sodium and potassium efflux. Microbiology 1998;144 (Pt 10)2749–58 - PubMed
    1. Ramos J, Arino J, Sychrova H. Alkali-metal-cation influx and efflux systems in nonconventional yeast species. FEMS Microbiol Lett 2011;317(1):1–8 10.1111/j.1574-6968.2011.02214.x - DOI - PubMed
    1. Ruiz A, Arino J. Function and regulation of the Saccharomyces cerevisiae ENA sodium ATPase system. Eukaryot Cell 2007;6(12):2175–83 - PMC - PubMed
    1. Serra-Cardona A, Petrezselyova S, Canadell D, Ramos J, Arino J. Coregulated Expression of the Na+/Phosphate Pho89 Transporter and Ena1 Na+-ATPase Allows Their Functional Coupling under High-pH Stress. Mol Cell Biol 2014;34(24):4420–4435 10.1128/MCB.01089-14 - DOI - PMC - PubMed

MeSH terms