. 2016 Jun 30;7(6):e2287.
doi: 10.1038/cddis.2016.184.

Tubular epithelial cells in renal clear cell carcinoma express high RIPK1/3 and show increased susceptibility to TNF receptor 1-induced necroptosis

Affiliations

Tubular epithelial cells in renal clear cell carcinoma express high RIPK1/3 and show increased susceptibility to TNF receptor 1-induced necroptosis

R S Al-Lamki et al. Cell Death Dis. .

Abstract

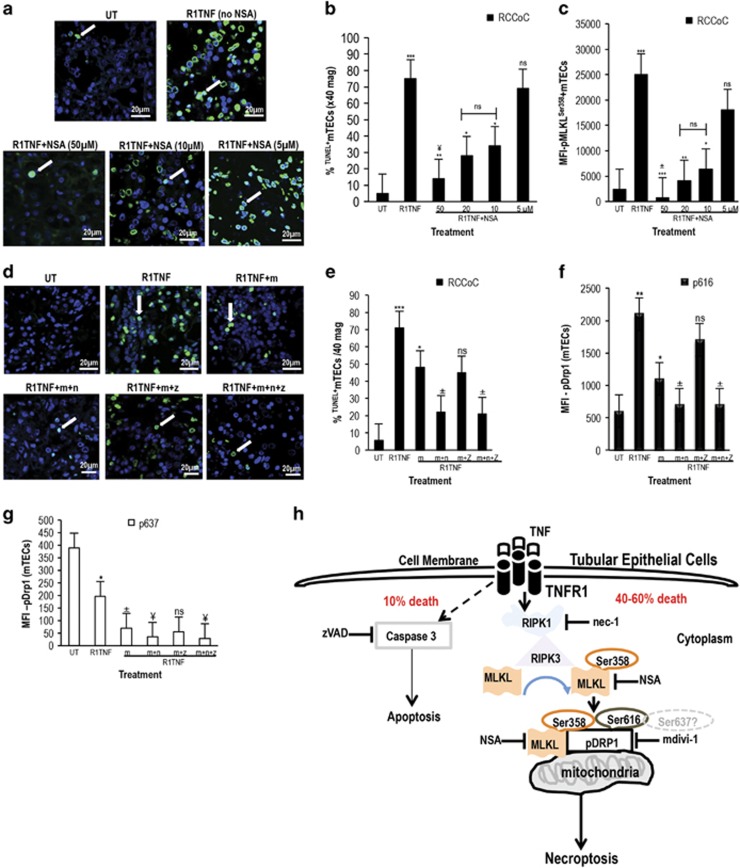
We previously reported that renal clear cell carcinoma cells (RCC) express both tumor necrosis factor receptor (TNFR)-1 and -2, but that, in organ culture, a TNF mutein that only engages TNFR1, but not TNFR2, causes extensive cell death. Some RCC died by apoptosis based on detection of cleaved caspase 3 in a minority TUNEL-positive cells but the mechanism of death in the remaining cells was unexplained. Here, we underpin the mechanism of TNFR1-induced cell death in the majority of TUNEL-positive RCC cells, and show that they die by necroptosis. Malignant cells in high-grade tumors displayed threefold to four fold higher expression of both receptor-interacting protein kinase (RIPK)1 and RIPK3 compared with non-tumor kidney tubular epithelium and low-grade tumors, but expression of both enzymes was induced in lower grade tumors in organ culture in response to TNFR1 stimulation. Furthermore, TNFR1 activation induced significant MLKL(Ser358) and Drp1(Ser616) phosphorylation, physical interactions in RCC between RIPK1-RIPK3 and RIPK3-phospho-MLKL(Ser358), and coincidence of phospho-MLKL(ser358) and phospho-Drp1(Ser616) at mitochondria in TUNEL-positive RCC. A caspase inhibitor only partially reduced the extent of cell death following TNFR1 engagement in RCC cells, whereas three inhibitors, each targeting a different step in the necroptotic pathway, were much more protective. Combined inhibition of caspases and necroptosis provided additive protection, implying that different subsets of cells respond differently to TNF-α, the majority dying by necroptosis. We conclude that most high-grade RCC cells express increased amounts of RIPK1 and RIPK3 and are poised to undergo necroptosis in response to TNFR1 signaling.


Figures

Figure 1
Figure 1
(A) Histology of untreated cultures (UT) show (a) low-grade RCC with small round tumor cells and a clear cytoplasm surrounded by a distinct cell membrane and round uniform nuclei with inconspicuous or absent nucleoli. (b) R1TNF- and (c) wtTNF-treated cultures show elevated level of death in mTECs compared with (d) R2TNF-treated cultures. (B) Morphological features of necrosis are evident in R1TNF-treated cultures such as large/small cytoplasmic vacuoles (x), condensation of the chromatin into small, irregular, circumscribed patches (white arrow), increasing translucent cytoplasm, swollen organelles (orange arrow) and disruption of the plasma membrane (black arrows). (C) Expression of RIPK1 and RIPK3 in tissue biopsies comprising RCC and NK; NK show a rare signal for RIPK1 and RIPK3 in MNCs within glomeruli (arrows) and with interstitium (small arrows). In contrast, RCC grade 3 shows marked signal in mTECs (arrows), MNCs (small arrows) and in some VECs (arrowheads). (D and E) Representative immunoblot of samples from nine patients with similar results and bar graph of relative RIPK1 and RIPK3 protein levels in grades 3/4 RCC (G3/G4) and non-tumor kidney (NK). Bars=mean+S.E.M.; *P<0.05 versus NK; paired Student's t-test. Glom-glomeruli; MNCs-mononuclear cells; TECs-tubular epithelial cells
Figure 2
Figure 2
Representative confocal images and light micrographs of the effect of R1TNF on protein and mRNA expression for RIPK1 and RIPK3 in organ cultures of RCC grade 1 and adjacent non-tumor kidney (NK). (a and b) Untreated (UT) cultures from RCC show a rare signal for RIPK1 and RIPK3 protein and mRNA. In contrast, R1TNF-treated cultures show a marked signal of both proteins mainly confined to mTECs (arrows), with RIPK3 also present in nuclei (white shaded arrow). Similarly, UT cultures of NK show a rare signal for both proteins; increased expression of both protein and mRNA is detected in R1TNF-treated cultures mainly confined to normal TECs (white arrows), peritubular capillaries (white arrowheads) and in infiltrating mononuclear cells (black arrowhead) but not in glomeruli (Glom). (c) Representative mean fluorescence intensity (MFI) for RIPK1 and RIPK3 expression in RCC and NK organ cultures. **P<0.01 versus UT, *P<0.05 versus UT, ±P<0.05 versus R1TNF; Bars=mean±S.E.M.; n=3 independent experiments from six separate organ culture experiments with similar results. Nuclei stained with Hoechst 33342. Confocal images: × 40 and × 63 original magnifications; photomicrographs: × 400 magnification
Figure 3
Figure 3
Effect of R1TNF on pMLKLSer358, pDrp1Ser616 and pDrp1Ser637 expression in organ cultures of RCC grade 1 and adjacent non-tumor kidney (NK). (a) R1TNF induced a marked expression of pMLKLS358 and pDrp1Ser616 but a reduced signal for pDrp1Ser637 compared with untreated controls (UT), with signal mainly confined to mTECs (arrows). (b) Quantification of the phosphorylated proteins in normal and mTECs presented as mean fluorescent intensity (MFI) shows a statistical significant difference between cultures. ***P<0.001 versus UT, *P<0.05 versus UT; ±P<0.05 versus R1TNF (NKoC); P<0.001 versus R1TNF (NKoC); ns, not significant. (c) pMLKLSer358 is seen within cytoplasm (arrowhead) and in some nuclei (arrow) (upper panel), while pDrp1Ser616 show cytoplasmic granular pattern (arrows) (lower panel). (d) Immunogold electron microscopy revealed pMLKLSer358 (15 nm particles) on the cell surface (black arrows), within cytoplasm (white arrow) and in mitochondria (m), while pDrp1Ser616 (5 nm particles, black arrow) was mainly confined to mitochondria (m) (open arrows). Bars=mean±S.E.M.; n=3 independent experiments from six separate organ culture experiments with similar results
Figure 4
Figure 4
PLA of organ culture of RCC grade 1. (a) In comparison with untreated controls (UT), R1TNF induced a strong interaction of RIPK1-RIPK3 and RIPK3-pMLKLSer358 appearing as strong red fluorescence spots mainly within the cytoplasm of mTECs. Each individual interacting protein pair observed as a red spot by confocal microscopy is expressed as the number of signals/cell (PLA spots/cell). (b and c) Quantification of PLA spots in TECs in the two study groups; RCC (RCCoC) and normal kidney (NKoC) show a statistically significant difference, more pronounced in RCCoC. **P<0.01 versus UT, *P<0.05 versus UT, ±P<0.05 versus R1TNF (NKoC). (d and e) Representative confocal images of pMLKLSer358 or pDrp1Ser637 and TUNEL in organ cultures of RCC grade 1. Compared with UT cultures, R1TNF induced an increase in the level of TUNEL+mTECs (green) associated with pMLKLSer358 and pDrp1Ser616 (red) expression (arrows). (f and g) Quantification of TUNEL+mTECs/pMLKLSer358+ and TUNEL+mTECs/pDrp1Ser616+ shows statistical significant differences between cultures. ***P<0.0001 versus UT, **P<0.001 versus UT, *P<0.01 versus UT, ±P<0.05 versus R1TNF (NKoC). (h) Combined immunofluorescence of R1TNF-treated cultures shows co-localization of pMLKLSer358 and pDrp1Ser616 in mTECs (arrow). (i) Immunogold electron microscopy demonstrate close proximity of gold particles for pMLKLSer358 (5 nm) and pDrp1Ser616 (15 nm) in mitochondria (m) (inset zoomed × 2.5). Bars=mean±S.E.M.; images are representative of n=3 independent experiments from six separate organ culture experiments with similar results
Figure 5
Figure 5
(A) Representative hematoxylin and eosin-stained sections demonstrate morphological features of necrosis in organ cultures of grade 1 ccRCC treated with or without necrostatin-1 or/and zVAD.fmk followed by R1TNF. R1TNF induced increased cell death compared with untreated (UT) cultures (a and b). Treatment with zVAD.fmk (z) (c) resulted in partial inhibition of cell death, further rescued by necrostatin-1 (n) (d), even more so by a combination of z and n (e). (B) Quantification of parallel sections stained with TUNEL show the precentage of dead tubular epithelial cells (TECs) in 10 random high power fields at × 40 magnification. ***P<0.0001 versus UT; **P<0.001 versus R1TNF+n (NKoC), ±P<0.01 versus R1TNF (NKoC), ¥P<0.05 versus R1TNF (RCCoC); ns, not significant. (C and D) R1TNF induced increased level of TUNEL+mTECs (green), also expressing pMLKLSer358 or pDrp1Ser616 (arrows) (red). Treatment with zVAD.fmk (z) partially reduced the number of TUNEL+mTECs (arrows) but did not have any effect on pMLKLSer358 or pDrp1Ser616 expression. In contrast, treatment with necrostatin-1 (n) resulted in a significant reduction in the number of TUNEL+mTECs, associated with a diminished level of pMLKLSer358 or pDrp1Ser616 comparable with cultures treated with a combination of zVAD.fmk and necrostatin-1 (z+n) (arrows). (E) Quantification of the percentage of TUNEL+mTECs in combination with pMLKLSer358 or pDrp1Ser616 in 10 random high power fields at × 40 magnification; ***P<0.001 versus UT; +P<0.05 versus R1TNF; ns, not significant. Bars=mean±S.E.M. Images are representative of n=3 independent experiments from six separate organ culture experiments with similar results
Figure 6
Figure 6
(a) Effect of necrosulfonamide (NSA) and mdivi-1 (m) in grade 1 RCC organ cultures treated with R1TNF. R1TNF alone without NSA (no NSA) induced increased levels of TUNEL+mTECs, which were significantly reduced with 50 μM NSA, and to a lesser extent, with 10 μM or 20 μM NSA (arrows). Cultures pretreated with 5 μM NSA showed comparable levels of TUNEL+mTECs as untreated cultures (UT). (b) The percentage of TUNEL+mTECs and (c) pMLKLSer358 expression presented as mean fluorescent intensity (MFI) in similar cultures. ***P<0.0001 versus UT,**P<0.001 versus R1TNF; *P<0.05 versus R1TNF; ¥P<0.05 versus R1TNF (+20 or 10μM); ±P<0.001 versus R1TNF (+20 or 10 μM); ns, not significant. (d) In comparison with UT, which show a rare TUNEL+mTECs, R1TNF alone (without m) induced increased levels of TUNEL+mTECs, significantly reduced by m (10 μM) with no effect by zVAD.fmk (m+z) but a marked reduction by nec-1 (m+n) comparable with cultures pretreated with a combination of zVAD.fmk and nec-1 (m+n+z). (e) The percentage of TUNEL+mTECs and (f and g) the mean fluorescence intensity (MFI) for pDrp1Ser616 and pDrp1Ser637 in similar cultures. ***P<0.0001 versus UT (e), **P<0.01 versus UT (f), *P<0.05 versus R1TNF, ± P<0.05 versus R1TNF+m. (g) *P<0.05 versus UT, ±P<0.5 versus R1TNF, ¥P<0.05 versus R1TNF+m; ns, not significant. Bars=mean±S.E.M.; n=3 independent experiments from six separate organ culture experiments with similar results. (h) Schematic diagram of the consequences of R1TNF-mediated necroptosis in mTEC in RCC; ligation of TNFR1 results in the recruitment of RIPK1, facilitating its interaction with RIPK3, which in turn recruits and phosphorylates MLKL at Ser358 and Drp1 at Ser616 thus causing their co-localization with the mitochondria. A separate process causes a reduction in pDrp1 at ser637. Nec-1 inhibits RIPK1, and NSA inhibits MLKL and mdivi-1 inhibits Drp1 inhibiting cell death

Similar articles

Cited by

References

    1. Flanigan RC, Salmon SE, Blumenstein BA, Bearman SI, Roy V, McGrath PC et al. Nephrectomy followed by interferon alfa-2b compared with interferon alfa-2b alone for metastatic renal-cell cancer. N Engl J Med 2001; 345: 1655–1659. - PubMed
    1. Vandenabeele P, Declercq W, Van Herreweghe F, Vanden Berghe T. The role of the kinases RIP1 and RIP3 in TNF-induced necrosis. Sci Signal 2010; 3: re4. - PubMed
    1. Hu X, Han W, Li L. Targeting the weak point of cancer by induction of necroptosis. Autophagy 2007; 3: 490–492. - PubMed
    1. Linkermann A, Green DR. Necroptosis. N Engl J Med 2014; 370: 455–465. - PMC - PubMed
    1. Al-Lamki RS, Bradley JR, Pober JS. Human organ culture as a tool for analyzing the response to tumor necrosis factor. Curr Trends Immunol 2011; 12: 49–66.

Publication types

MeSH terms

Substances