. 2016 Jun 30;7(6):e2289.
doi: 10.1038/cddis.2016.188.

MDM2 facilitates adipocyte differentiation through CRTC-mediated activation of STAT3

Affiliations

MDM2 facilitates adipocyte differentiation through CRTC-mediated activation of STAT3

P Hallenborg et al. Cell Death Dis. .

Abstract

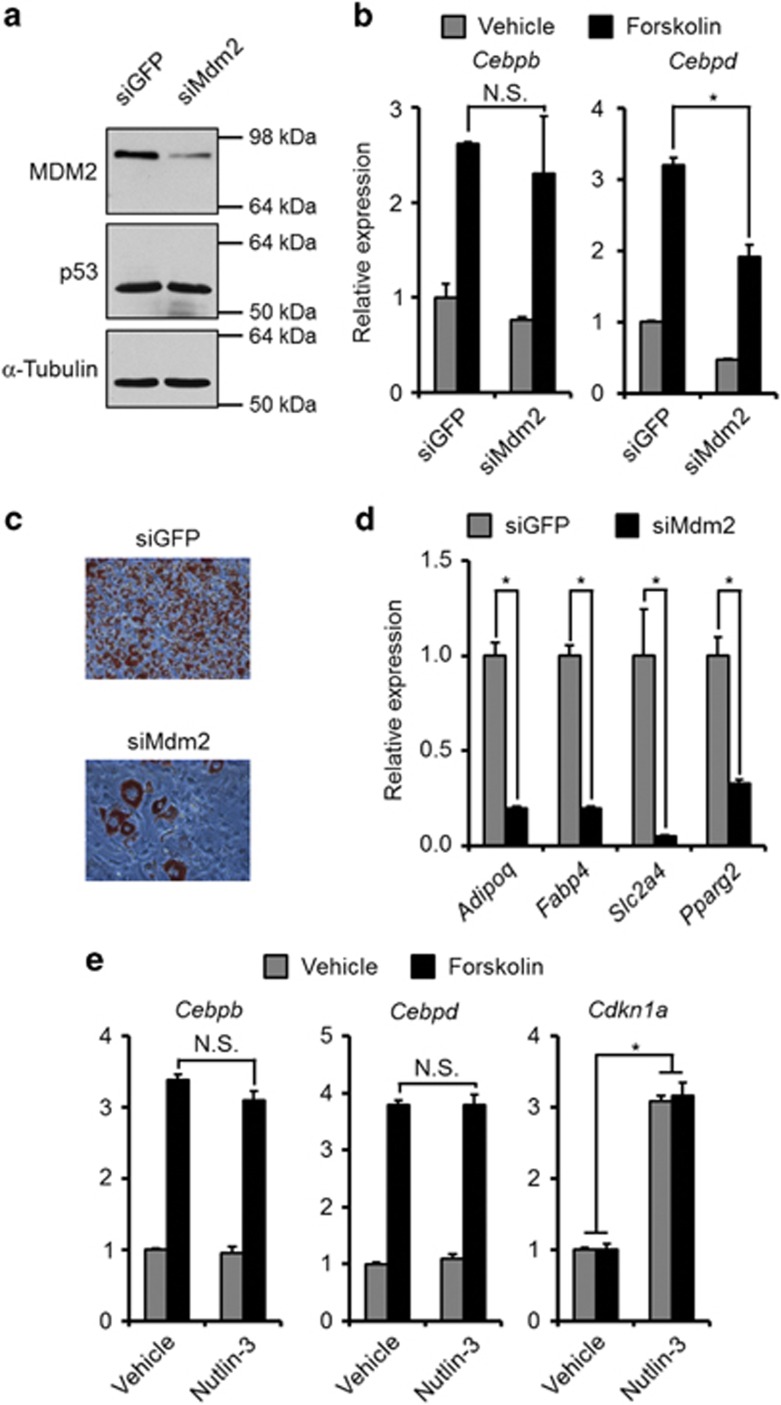
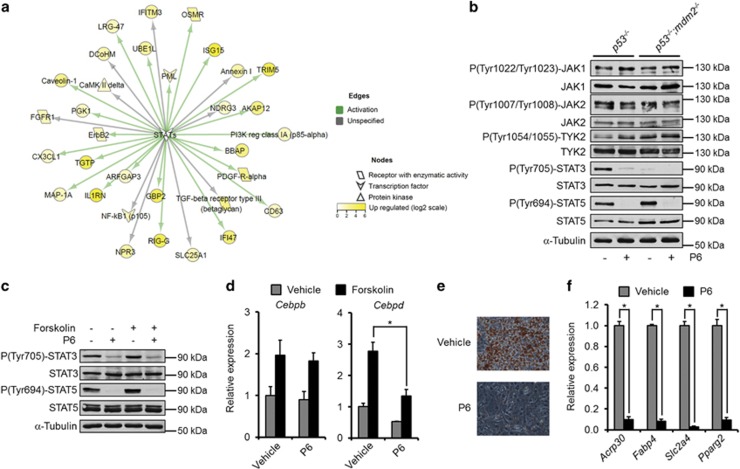
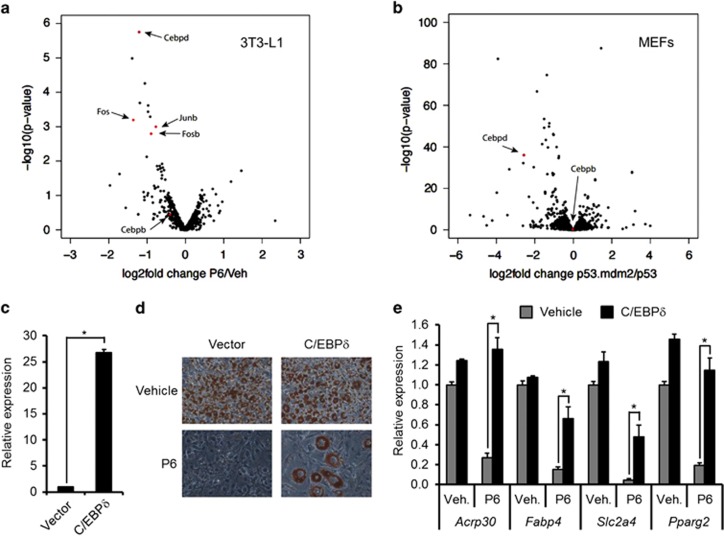
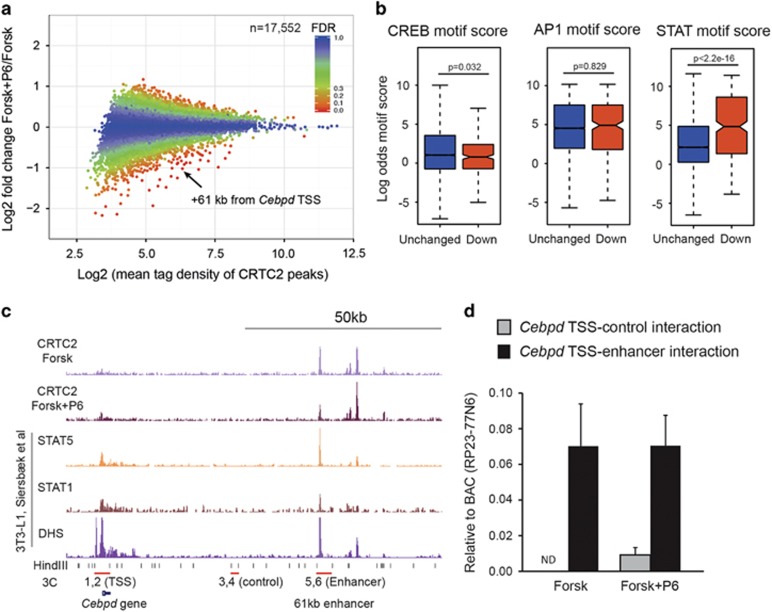
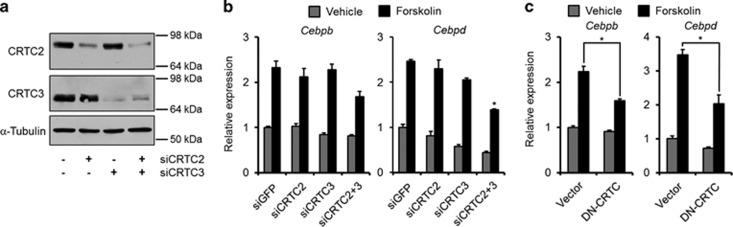
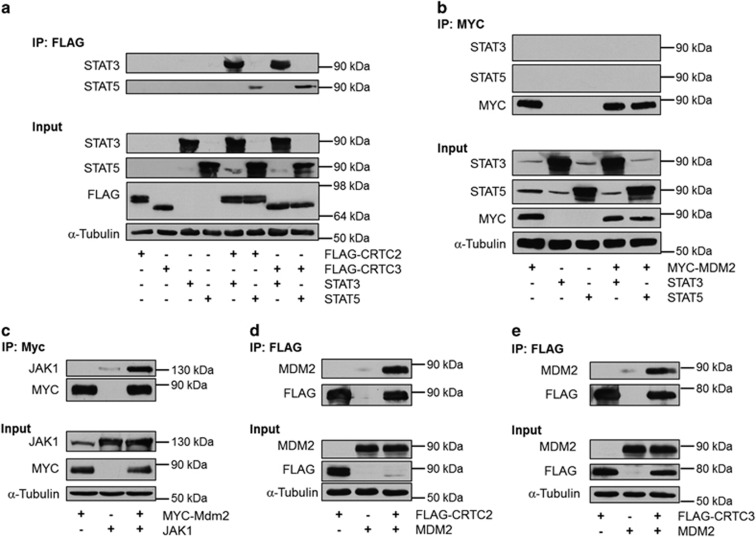
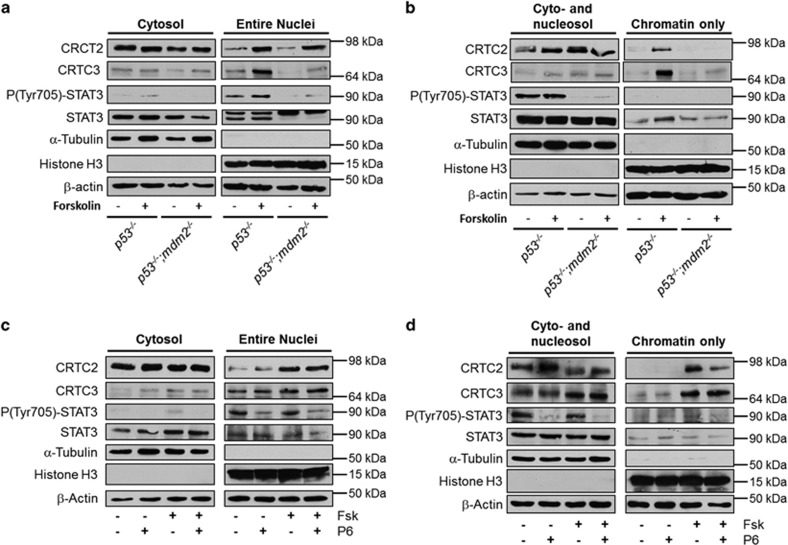
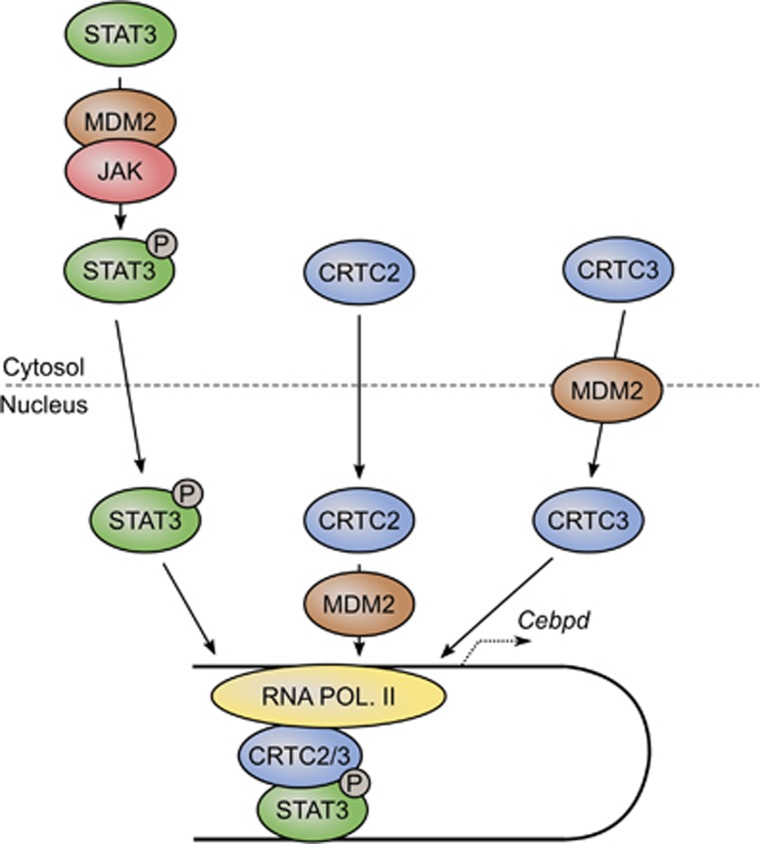
The ubiquitin ligase MDM2 is best known for balancing the activity of the tumor suppressor p53. We have previously shown that MDM2 is vital for adipocyte conversion through controlling Cebpd expression in a p53-independent manner. Here, we show that the proadipogenic effect of MDM2 relies on activation of the STAT family of transcription factors. Their activation was required for the cAMP-mediated induction of target genes. Interestingly, rather than influencing all cAMP-stimulated genes, inhibition of the kinases directly responsible for STAT activation, namely JAKs, or ablation of MDM2, each resulted in abolished induction of a subset of cAMP-stimulated genes, with Cebpd being among the most affected. Moreover, STATs were able to interact with the transcriptional cofactors CRTC2 and CRTC3, hitherto only reported to associate with the cAMP-responsive transcription factor CREB. Last but not least, the binding of CRTC2 to a transcriptional enhancer that interacts with the Cebpd promoter was dramatically decreased upon JAK inhibition. Our data reveal the existence of an unusual functional interplay between STATs and CREB at the onset of adipogenesis through shared CRTC cofactors.


Figures

Figure 1
Figure 1
MDM2 knockdown but not Nutlin-3 treatment lowered cAMP-mediated induction of Cebpd. (ad) MDM2 or control (GFP) was knocked down in confluent 3T3-L1 preadipocytes using siRNA transfection. (a) Protein levels of MDM2, p53 and α-tubulin 48 h post transfection. (b) Transfected cells were stimulated with forskolin or vehicle for 1 h. mRNA levels of Cebpb and Cebpd were measured by real-time qPCR. (c and d) Transfected cells were induced to undergo adipocyte differentiation. Degree of adipogenesis was scored by Oil-Red-O staining of triglycerides (c) or mRNA levels of adipocyte marker genes by real-time qPCR (d). (e) 3T3-L1 preadipocytes were treated with either Nutlin-3 or vehicle before stimulation with forskolin. mRNA levels of Cebpb, Cebpd and Cdkn1a were measured by real-time qPCR. *Significance tested using Student's t-test, P<0.05
Figure 2
Figure 2
MDM2 is needed for STAT activation. (a) Visualization of MS-based SILAC ratios for known STAT targets. Yellow-colored nodes are upregulated in p53−/− MEFs. (b) p53−/− and p53−/−;mdm2−/− MEFs were treated with the JAK inhibitor, P6. Protein and phosphorylation levels of JAKs and the adipogenic STATs were measured using western blotting. (c and d) 3T3-L1 preadipocytes were treated with P6 and/or forskolin. (c) Western blot analyses of protein and phosphorylation levels of the proadipogenic STATs. (d) mRNA levels of Cebpb and Cebpd as assessed by real-time qPCR. (e and f) P6 or vehicle was included during adipogenesis of 3T3-L1 cells. Levels of differentiation were scored by Oil-Red-O staining of triglycerides (e) or mRNA levels of adipocyte marker genes by real-time qPCR (f). *Significance tested using Student's t-test, P<0.05
Figure 3
Figure 3
JAK inhibition mainly affects cAMP-mediated induction of Cebpd. (a) Volcano plots of the effect of P6 on forskolin-induced genes in 3T3-L1 cells. (b) Volcano plots of the effect of Mdm2 deficiency on forskolin-induced genes in MEFs. (c–e) 3T3-L1 preadipocytes were retrovirally transduced with C/EBPδ or empty vector. (c) mRNA levels of Cebpd at day 0 as measured by real-time qPCR. (d and e) P6 or vehicle were included during adipogenesis of transduced 3T3-L1 cells. Levels of differentiation were scored by Oil-Red-O staining of triglycerides (d) or mRNA levels of adipocyte marker genes by real-time qPCR (e). *Significance tested using Student's t-test, P<0.05
Figure 4
Figure 4
Binding of CRTC2 to Cebpd-associated enhancer is hindered by JAK inhibition. (ac) ChIP-Seq of CRTC2 from 3T3-L1 cells treated with either vehicle or P6 was stimulated with forskolin. A total of 17 552 CTRC2 peaks were identified in forskolin-treated cells. (a) MA plot showing CRTC binding affected by P6. Differentially bound CRTC2 was identified using EdgeR and the false discovery rate (FDR) of individual CTRC2-binding sites is indicated in the plot. (b) Boxplots of CREB, AP-1 and STAT motif strength within CRTC2-binding sites either unaffected or reduced by P6. Unchanged binding is defined as differential binding with FDR>0.8 and reduced binding is defined as differential binding with FDR<0.2 and log2 fold change <0. (c) ChIP-seq profiles of Cebpd locus. STAT1, STAT3 and DHS data are from Siersbæk et al. (REF). Primer sets used for 3C analysis are indicated together with HindIII sites. Primers 1 and 2 anneal at the HindIII sites surrounding the Cebpd TSS. Primers 3 and 4 anneal at a DNase inaccessible control region 40 kb downstream of the TSS and primers 5 and 6 anneal at the 61 kb enhancer occupied by CRTC2 and STATs. (d) 3C analysis of interaction between 61 kb enhancer and control region with Cebpd TSS. Ligation efficiency was normalized to ligation efficiency of HindIII-digested BAC RP23-77N6 containing the Cebpd locus
Figure 5
Figure 5
CRTC2 and CRTC3 share function and STAT binding. (a and b) CRTC2 and/or CRTC3 were knocked down in 3T3-L1 cells. (a) Confirmation of knockdowns by western blotting. (b) mRNA levels of Cebpb and Cebpd in forskolin-stimulated 3T3-L1 cells. *Significance tested by one-way ANOVA followed by Tukey's post hoc tests, P<0.05. (c) 3T3-L1 cells were retrovirally transduced with DN-CRTC or empty vector. Forskolin-mediated increase in Cebpb and Cebpd was analyzed by real-time qPCR. *Significance tested using Student's t-test, P<0.05
Figure 6
Figure 6
CRTCs can bind STAT3, STAT5 and MDM2. (a) 293T cells were transfected with FLAG-tagged CRTCs and/or STATs. FLAG-immunoprecipitates (IPs) were analyzed for STAT3 and STAT5 by western blotting. (b) 293T cells were transfected with MYC-tagged MDM2 and/or STATs. MYC-IPs were analyzed for STAT3 and STAT5 by western blotting. (c) 293T cells were transfected with MYC-tagged MDM2 and/or JAK1. MYC-IPs were analyzed for JAK1 by western blotting. (d) 293T cells were transfected with FLAG-tagged CRTC2 and/or MDM2. FLAG-IPs were analyzed for MDM2 by western blotting. (e) 293T cells were transfected with FLAG-tagged CRTC3 and/or MDM2. FLAG-IPs were analyzed for MDM2 by western blotting
Figure 7
Figure 7
MDM2 regulates localization and chromatin binding of CRTCs. (a and b) p53−/− and p53−/−;mdm2−/− MEFs were stimulated with vehicle or forskolin for 15 min. Cells were then fractioned into cytosolic and nuclei (a) or cyto/nucleosol and chromatin (b). (c and d) 3T3-L1 cells treated with vehicle or P6 were stimulated with vehicle or forskolin for 15 min. Cells were then fractioned into cytosolic and nuclei (c) or cyto/nucleosol and chromatin (d)
Figure 8
Figure 8
Regulation of STAT–CRTC interplay by MDM2. See text for details

Similar articles

Cited by

References

    1. Hallenborg P, Petersen RK, Kouskoumvekaki I, Newman JW, Madsen L, Kristiansen K. The elusive endogenous adipogenic PPARgamma agonists: lining up the suspects. Prog Lipid Res 2015; 61: 149–162. - PubMed
    1. Siersbaek R, Mandrup S. Transcriptional networks controlling adipocyte differentiation. Cold Spring Harb Symp Quant Biol 2011; 76: 247–255. - PubMed
    1. Richard AJ, Stephens JM. The role of JAK-STAT signaling in adipose tissue function. Biochim Biophys Acta 2014; 1842: 431–439. - PMC - PubMed
    1. Kawai M, Namba N, Mushiake S, Etani Y, Nishimura R, Makishima M et al. Growth hormone stimulates adipogenesis of 3T3-L1 cells through activation of the Stat5A/5B-PPARgamma pathway. J Mol Endocrinol 2007; 38: 19–34. - PubMed
    1. Meirhaeghe A, Fajas L, Gouilleux F, Cottel D, Helbecque N, Auwerx J et al. A functional polymorphism in a STAT5B site of the human PPAR gamma 3 gene promoter affects height and lipid metabolism in a French population. Arterioscler Thromb Vasc Biol 2003; 23: 289–294. - PubMed

Publication types

MeSH terms