. 2016 Jun 30;7(6):e2291.
doi: 10.1038/cddis.2016.194.

miRNA-205 targets VEGFA and FGF2 and regulates resistance to chemotherapeutics in breast cancer

Affiliations

miRNA-205 targets VEGFA and FGF2 and regulates resistance to chemotherapeutics in breast cancer

Y Hu et al. Cell Death Dis. .

Abstract

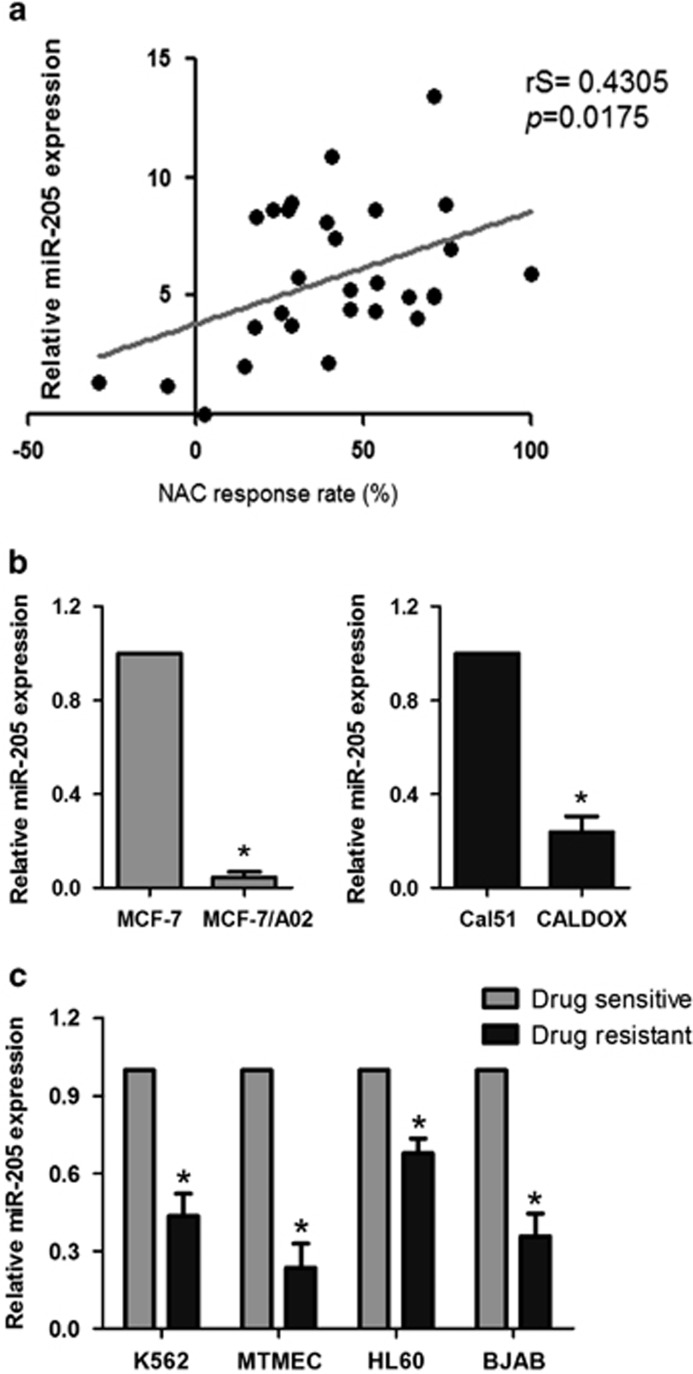
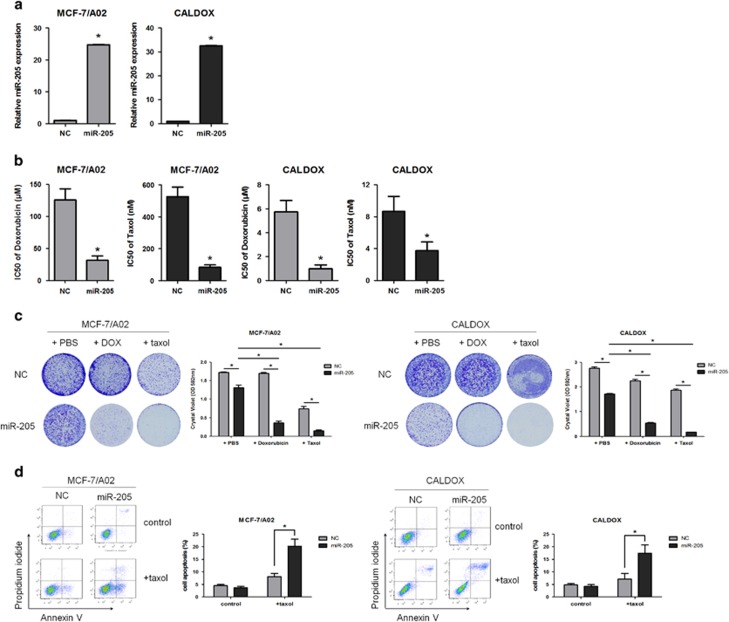
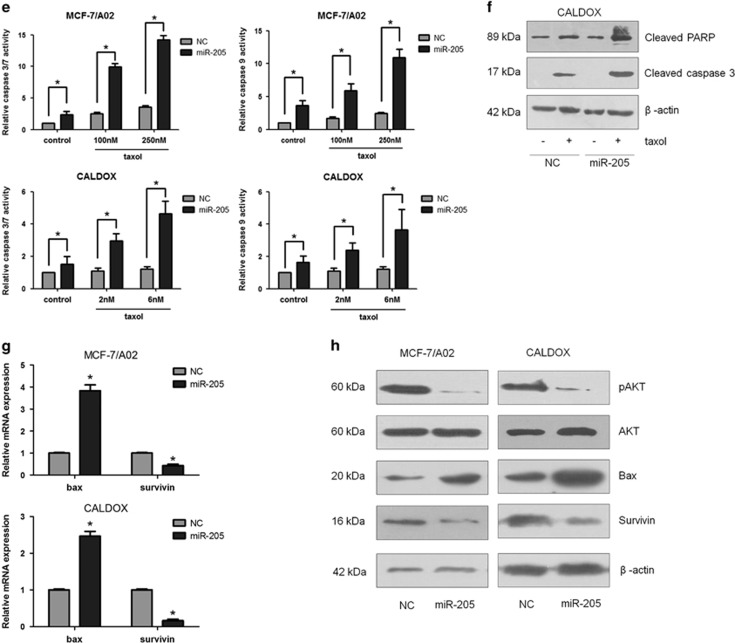
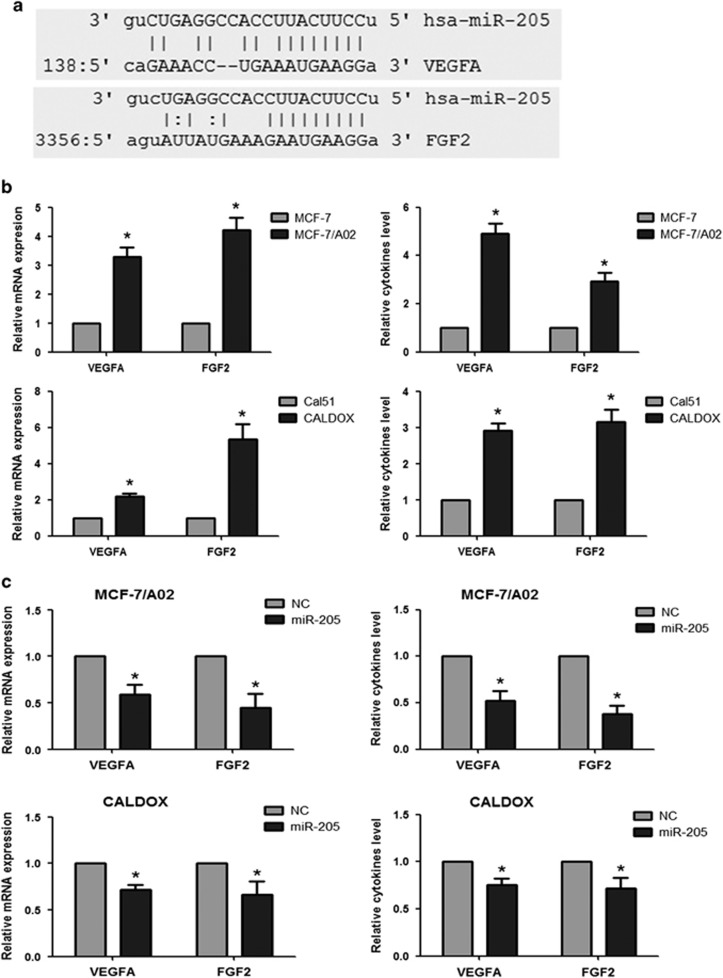
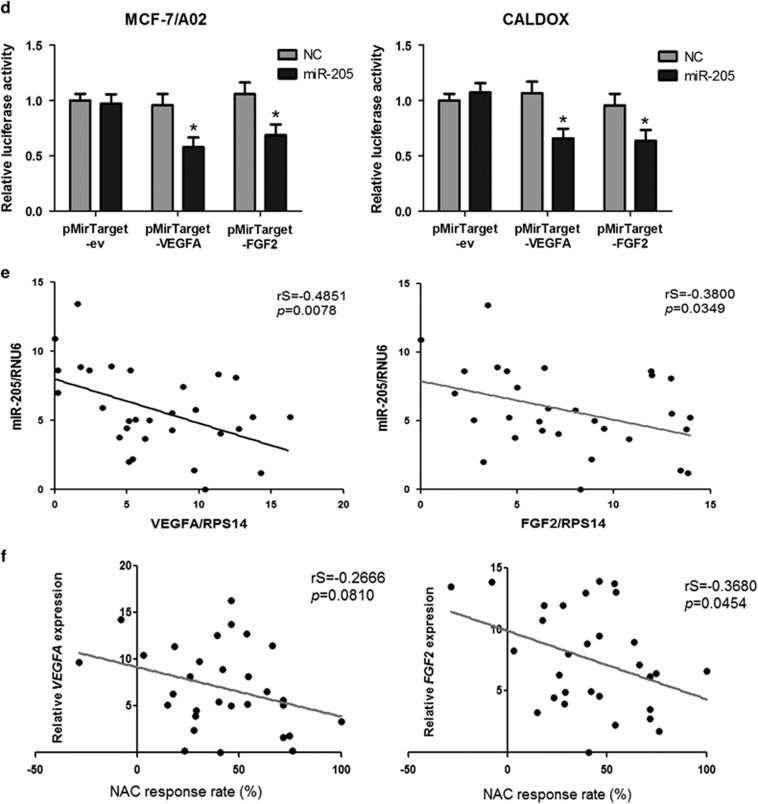
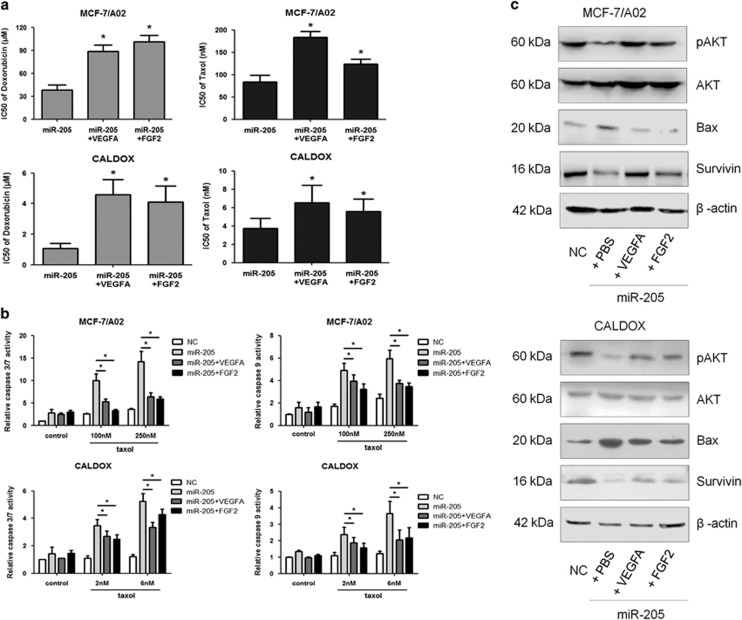
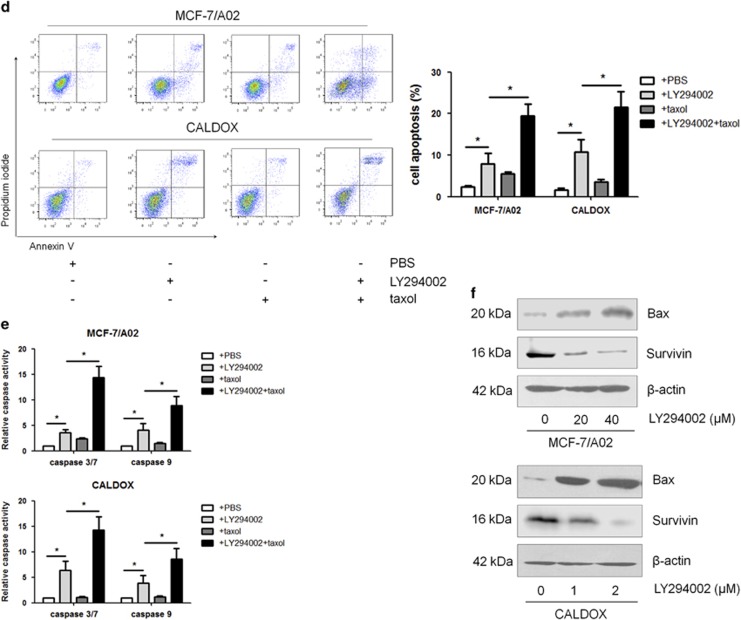
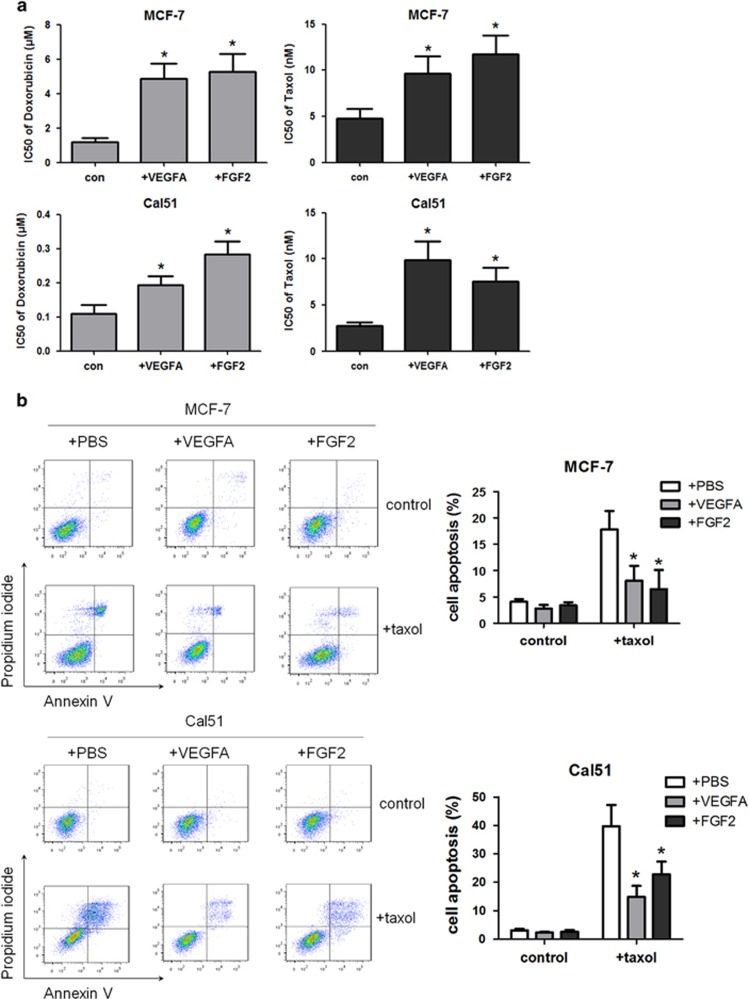
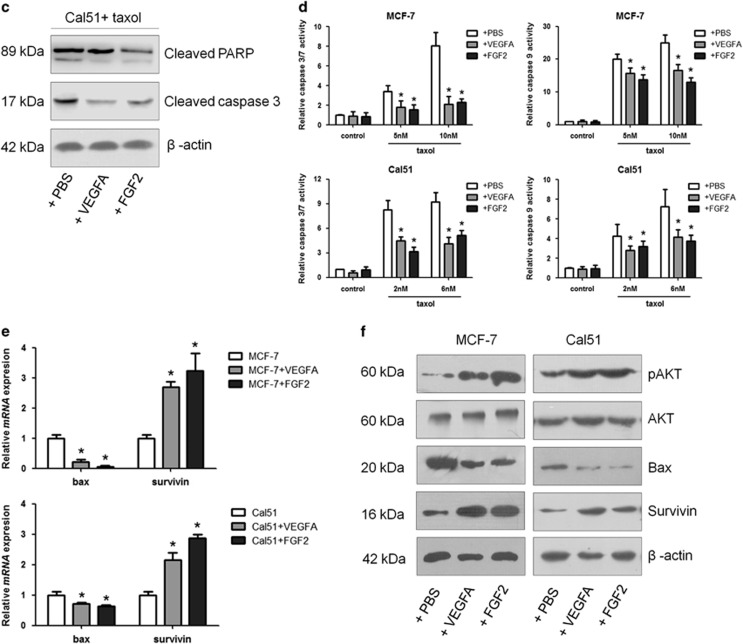
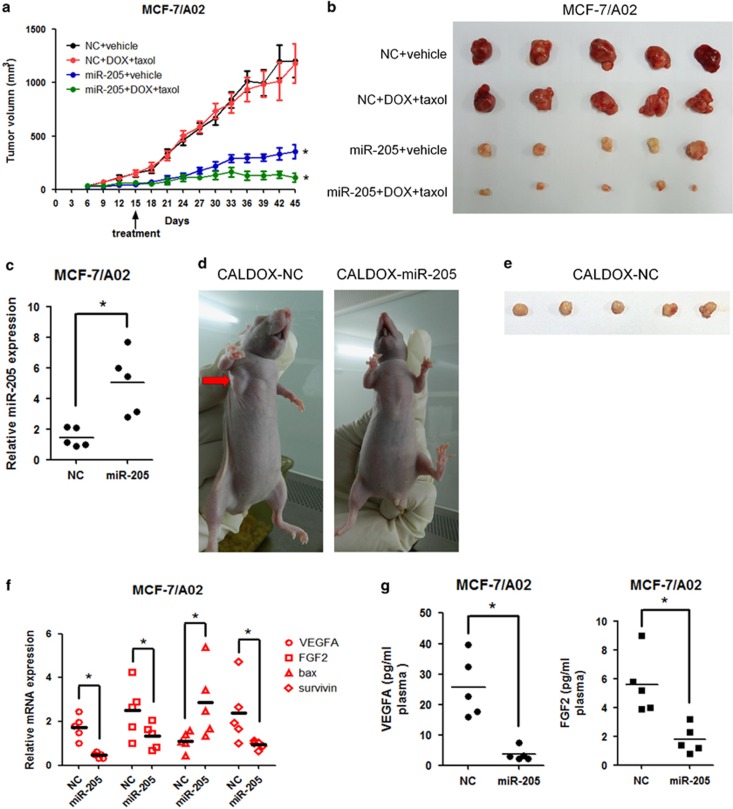
MicroRNAs (miRNAs) have critical roles in regulating cancer cell survival, proliferation and sensitivity to chemotherapy. The potential application of using miRNAs to predict chemotherapeutic response to cancer treatment is highly promising. However, the underlying mechanisms of chemotherapy response control by miRNAs remain to be fully identified and their prognostic value has not been fully evaluated. Here we show a strong correlation between miR-205 expression and chemosensitivtiy to TAC (docetaxol, doxorubicin plus cyclophosphamide), a widely-used neoadjuvant chemotherapy (NAC) regimen, for breast cancer patients. High level of miR-205 predicted better response to TAC regimen NAC in breast cancer patients. We found miR-205 downregulated in both MCF-7/A02 and CALDOX cells, two drug-resistant derivatives of MCF-7 and Cal51 cells, and its ectopic expression led to an increase in apoptosis resensitization of both drug-resistant cell lines to doxorubicin and taxol. We further show that miR-205 directly binds VEGFA and FGF2 mRNA 3'-UTRs and confirm that miR-205 levels are negatively correlated with VEGFA and FGF2 mRNA expression in breast cancer patients. Adding VEGFA and FGF2 exogenously to chemosensitive breast cancer cells and chemoresistant cells with miR-205 overexpression led to drug resistance. Consistently, low VEGFA and FGF2 expression correlated with better response to NAC in breast cancer patients. In addition, inhibition of tumor growth and resensitization to doxorubicin were also observed in mouse tumor xenografts from cells overexpressing miR-205. Taken together, our data suggest that miR-205 enhances chemosensitivity of breast cancer cells to TAC chemotherapy by suppressing both VEGFA and FGF2, leading to evasion of apoptosis. MiR-205 may serve as a predictive biomarker and a potential therapeutic target in breast cancer treatment.


Figures

Figure 1
Figure 1
High expression of miR-205 correlates with better chemotherapeutic response. (a) Expression levels of miR-205 in breast cancer patients (n=30) who received TAC regimen NAC were determined by qPCR. Spearman rank test was used for the correlation between miR-205 and NAC response rate determined as (1−greatest tumor diameter after NAC/greatest tumor diameter before NAC) × 100%. The trend of the correlation is indicated with a line calculated by linear regression. (b) miR-205 expression in pairs of drug-sensitive and -resistant MCF-7 (left panel) and Cal51 (right panel) cells determined by qPCR. (c) miR-205 expression in pairs of drug-sensitive and -resistant K562, MTMEC, HL60 and BJAB cells. miR expression determined by qPCR was normalized to that of RNU6 RNA. Data represent the average±S.D. of three independent experiments (*P<0.05)
Figure 2
Figure 2
miR-205 overexpression restores drug sensitivity and promotes apoptosis in breast cancer cells. Drug-resistant MCF-7/A02 and CALDOX cells were stably transfected with a lentivirus carrying an expression vector for miR-205, generating MCF-7/A02-miR-205 and CALDOX-miR-205 cells, respectively. Control cells, MCF-7/A02-NC and CALDOX-NC were transfected with the empty vector (pGLV2-U6-Puro). (a) Expression of miR-205 in transfected cells determined by qPCR and normalized to RNU6 expression. (b) IC50 values of doxorubicin and taxol (3-day treatments) in transfected cells. (c) Effect of miR-205 on drug resistance. Cells were treated with doxorubicin (15 μM for MCF-7/A02 and 1 μM for CALDOX) and taxol (0.25 μM for MCF-7/A02 and 2.5 nM for CALDOX) for 7 days, and the cells were stained with crystal violet. Dye was solubilized and the optical density at 592 nm was measured. (d) Transfected drug-resistant cells were treated with taxol (0.25 μM for MCF-7/A02 and 2.5 nM for CALDOX) for 48 h. Annexin V/propidium iodide staining was detected by flow cytometry. Representative plots of three independent experiments are shown, left panels. Quantitative data show the average percentage of annexin V-positive cells (both in early apoptosis, lower right quadrant, and late apoptosis, upper right quadrant) of three independent experiments, right panels. (e) Caspase-3/7 and caspase-9 activities in miR-205-transfected MCF-7/A02 (upper histograms) and CALDOX cells (lower histograms) after 48-h taxol treatment. (f) Expression levels of cleaved PARP and cleaved caspase-3 in drug-resistant CALDOX cells were determined by western blotting after 2.5 nM taxol treatment for 48 h. (g) Expression levels of Bax and survivin in mir-205-transfected drug-resistant cells determined by qPCR and normalized to RPS14 expression. (h) Expression levels of pAKT, AKT, Bax and survivin in miR-205-transfected drug-resistant cells determined by western blotting. Numerical data represent mean±S.D. based on three independent experiments (*P<0.05). Pictorial data show representatives of three independent experiments
Figure 2
Figure 2
miR-205 overexpression restores drug sensitivity and promotes apoptosis in breast cancer cells. Drug-resistant MCF-7/A02 and CALDOX cells were stably transfected with a lentivirus carrying an expression vector for miR-205, generating MCF-7/A02-miR-205 and CALDOX-miR-205 cells, respectively. Control cells, MCF-7/A02-NC and CALDOX-NC were transfected with the empty vector (pGLV2-U6-Puro). (a) Expression of miR-205 in transfected cells determined by qPCR and normalized to RNU6 expression. (b) IC50 values of doxorubicin and taxol (3-day treatments) in transfected cells. (c) Effect of miR-205 on drug resistance. Cells were treated with doxorubicin (15 μM for MCF-7/A02 and 1 μM for CALDOX) and taxol (0.25 μM for MCF-7/A02 and 2.5 nM for CALDOX) for 7 days, and the cells were stained with crystal violet. Dye was solubilized and the optical density at 592 nm was measured. (d) Transfected drug-resistant cells were treated with taxol (0.25 μM for MCF-7/A02 and 2.5 nM for CALDOX) for 48 h. Annexin V/propidium iodide staining was detected by flow cytometry. Representative plots of three independent experiments are shown, left panels. Quantitative data show the average percentage of annexin V-positive cells (both in early apoptosis, lower right quadrant, and late apoptosis, upper right quadrant) of three independent experiments, right panels. (e) Caspase-3/7 and caspase-9 activities in miR-205-transfected MCF-7/A02 (upper histograms) and CALDOX cells (lower histograms) after 48-h taxol treatment. (f) Expression levels of cleaved PARP and cleaved caspase-3 in drug-resistant CALDOX cells were determined by western blotting after 2.5 nM taxol treatment for 48 h. (g) Expression levels of Bax and survivin in mir-205-transfected drug-resistant cells determined by qPCR and normalized to RPS14 expression. (h) Expression levels of pAKT, AKT, Bax and survivin in miR-205-transfected drug-resistant cells determined by western blotting. Numerical data represent mean±S.D. based on three independent experiments (*P<0.05). Pictorial data show representatives of three independent experiments
Figure 3
Figure 3
Identification of VEGFA and FGF2 mRNAs as direct targets of miR-205 in breast cancer cells. (a) Annealing of miR-205 to VEGFA and FGF2 mRNA 3′-UTRs according to the microRNA.org database. (b) VEGFA and FGF2 expression at mRNA (qPCR; left panels) and cytokine levels (ELISA; right panels) in drug-sensitive and -resistant breast cancer cells. (c) Expression levels of VEGFA and FGF2 in drug-resistant cells after stable expression of miR-205 or empty vector control (NC) at mRNA (qPCR; left panels) and protein levels (ELISA; right panels). (d) miR-205 targets VEGFA and FGF2 mRNAs. Normalized firefly luciferase activity from the reporter with the VEGFA 3′-UTR (pMirTarget-VEGFA), FGF2 3′-UTR (pMirTarget-FGF2) or the empty vector (pMirTarget-ev) after transient transfection into cells overexpressing miR-205 or control (NC) cells. In all cases, cells were co-transfected with a Renilla luciferase expression vector to normalize for transfection efficiency. Numerical data represent mean±S.D. based on three independent experiments (*P<0.05). (e) Inverse correlation between miR-205 and VEGFA (left panel)/FGF2 (right panel) in breast cancer (n=30) as determined by Spearman rank test. The trend of the correlation is indicated with a line calculated by linear regression. (f) Expression levels of VEGFA (left panel) and FGF2 (right panel) in breast cancer patients (n=30) who received TAC regime NAC were quantitated by qPCR. Spearman rank test was used for depicting the correlation between mRNA and NAC response rate determined as (1−greatest tumor diameter after NAC/greatest tumor diameter before NAC) × 100%. The trend of the correlation is indicated with a line calculated by linear regression
Figure 3
Figure 3
Identification of VEGFA and FGF2 mRNAs as direct targets of miR-205 in breast cancer cells. (a) Annealing of miR-205 to VEGFA and FGF2 mRNA 3′-UTRs according to the microRNA.org database. (b) VEGFA and FGF2 expression at mRNA (qPCR; left panels) and cytokine levels (ELISA; right panels) in drug-sensitive and -resistant breast cancer cells. (c) Expression levels of VEGFA and FGF2 in drug-resistant cells after stable expression of miR-205 or empty vector control (NC) at mRNA (qPCR; left panels) and protein levels (ELISA; right panels). (d) miR-205 targets VEGFA and FGF2 mRNAs. Normalized firefly luciferase activity from the reporter with the VEGFA 3′-UTR (pMirTarget-VEGFA), FGF2 3′-UTR (pMirTarget-FGF2) or the empty vector (pMirTarget-ev) after transient transfection into cells overexpressing miR-205 or control (NC) cells. In all cases, cells were co-transfected with a Renilla luciferase expression vector to normalize for transfection efficiency. Numerical data represent mean±S.D. based on three independent experiments (*P<0.05). (e) Inverse correlation between miR-205 and VEGFA (left panel)/FGF2 (right panel) in breast cancer (n=30) as determined by Spearman rank test. The trend of the correlation is indicated with a line calculated by linear regression. (f) Expression levels of VEGFA (left panel) and FGF2 (right panel) in breast cancer patients (n=30) who received TAC regime NAC were quantitated by qPCR. Spearman rank test was used for depicting the correlation between mRNA and NAC response rate determined as (1−greatest tumor diameter after NAC/greatest tumor diameter before NAC) × 100%. The trend of the correlation is indicated with a line calculated by linear regression
Figure 4
Figure 4
Exogenous VEGFA/FGF2 attenuates the effect of drug-sensitivity restoration of miR-205 through activating PI3K/AKT signaling in breast cancer cells. (ac) MCF-7/A02 and CALDOX cells were stimulated with 30 ng/ml VEGFA or 20 ng/ml FGF2 for 72 h and treated by doxorubicin or taxol. (a) IC50 values of doxorubicin and taxol in MCF-7/A02-miR-205 cells (upper panels) and CALDOX-miR-205 cells (lower panels) in the presence or absence of VEGFA/FGF2. (b) Caspase-3/7 and caspase-9 activities in MCF-7/A02 (upper histograms) and CALDOX cells (lower histograms) after 48-h taxol treatment. (c) Expression levels of pAKT, AKT, Bax and Survivin in MCF-7/A02 and CALDOX with/without miR-205 overexpression in the presence or absence of VEGFA/FGF2 determined by western blotting. (d and e) Cells were treated with PI3K inhibitor LY294002 (10 μM for MCF-7/A02 and 2 μM for CALDOX) for 24 h and then treated by taxol (0.25 μM for MCF-7/A02 and 2.5 nM for CALDOX) for another 48 h. (d) Annexin V/propidium iodide staining detected by flow cytometry after 48-h taxol treatment. Representative plots of three independent experiments are shown. Quantitative data show the average percentage of annexin V-positive cells (both in early apoptosis, lower right quadrants and late apoptosis, upper right quadrants) of three independent experiments (right panel). (e) Caspase-3/7 and caspase-9 activities in MCF-7/A02 (upper histograms) and CALDOX cells (lower histograms) after 48-h taxol treatment (f) Expression levels of Bax and Survivin were determined by western blotting in MCF-7/A02 and CALDOX after LY294002 treatment for 48 h. Numerical data represent mean±S.D. based on three independent experiments (*P<0.05), and the immunoblots are representative of three replicates
Figure 4
Figure 4
Exogenous VEGFA/FGF2 attenuates the effect of drug-sensitivity restoration of miR-205 through activating PI3K/AKT signaling in breast cancer cells. (ac) MCF-7/A02 and CALDOX cells were stimulated with 30 ng/ml VEGFA or 20 ng/ml FGF2 for 72 h and treated by doxorubicin or taxol. (a) IC50 values of doxorubicin and taxol in MCF-7/A02-miR-205 cells (upper panels) and CALDOX-miR-205 cells (lower panels) in the presence or absence of VEGFA/FGF2. (b) Caspase-3/7 and caspase-9 activities in MCF-7/A02 (upper histograms) and CALDOX cells (lower histograms) after 48-h taxol treatment. (c) Expression levels of pAKT, AKT, Bax and Survivin in MCF-7/A02 and CALDOX with/without miR-205 overexpression in the presence or absence of VEGFA/FGF2 determined by western blotting. (d and e) Cells were treated with PI3K inhibitor LY294002 (10 μM for MCF-7/A02 and 2 μM for CALDOX) for 24 h and then treated by taxol (0.25 μM for MCF-7/A02 and 2.5 nM for CALDOX) for another 48 h. (d) Annexin V/propidium iodide staining detected by flow cytometry after 48-h taxol treatment. Representative plots of three independent experiments are shown. Quantitative data show the average percentage of annexin V-positive cells (both in early apoptosis, lower right quadrants and late apoptosis, upper right quadrants) of three independent experiments (right panel). (e) Caspase-3/7 and caspase-9 activities in MCF-7/A02 (upper histograms) and CALDOX cells (lower histograms) after 48-h taxol treatment (f) Expression levels of Bax and Survivin were determined by western blotting in MCF-7/A02 and CALDOX after LY294002 treatment for 48 h. Numerical data represent mean±S.D. based on three independent experiments (*P<0.05), and the immunoblots are representative of three replicates
Figure 5
Figure 5
VEGFA and FGF2 protect breast cancer cells from chemotherapy-induced cell death through PI3K/AKT activation and apoptosis inhibition. MCF-7 and Cal51 cells were stimulated with 30 ng/ml VEGFA or 20 ng/ml FGF2 for 72 h and then treated by doxorubicin or taxol for 48 h. (a) IC50 values of doxorubicin and taxol in MCF-7 cells (upper panels) and Cal51 cells (lower panels) in the presence or absence of VEGFA/FGF2. (b) Annexin V/propidium iodide staining of cells determined by flow cytometry after 48-h taxol treatment (10 nM for MCF-7 and 2 nM for Cal51). Representative plots of three independent experiments are shown. Quantitative data show the average percentage of annexin V-positive cells (both in early apoptosis, lower right quadrants and late apoptosis, upper right quadrants) of three independent experiments (right panel). (c) Detection of cleaved PARP and cleaved caspase-3 by western blotting in Cal51 cell in the presence or absence of VEGFA/FGF2 after 2 nM taxol treatment for 48 h. (d) Caspase-3/7 and caspase-9 activities in MCF-7 and Cal51 cells after 48-h taxol treatment. (e) Expression levels of Bax and survivin in MCF-7 and Cal51 cells determined by qPCR in the presence or absence of VEGFA/FGF2. (f) Expression levels of pAKT, AKT, Bax and Survivin determined by western blotting in the presence or absence of VEGFA/FGF2. Numerical data represent mean±S.D. based on three independent experiments (*P<0.05), and the immunoblots are representative of three replicates
Figure 5
Figure 5
VEGFA and FGF2 protect breast cancer cells from chemotherapy-induced cell death through PI3K/AKT activation and apoptosis inhibition. MCF-7 and Cal51 cells were stimulated with 30 ng/ml VEGFA or 20 ng/ml FGF2 for 72 h and then treated by doxorubicin or taxol for 48 h. (a) IC50 values of doxorubicin and taxol in MCF-7 cells (upper panels) and Cal51 cells (lower panels) in the presence or absence of VEGFA/FGF2. (b) Annexin V/propidium iodide staining of cells determined by flow cytometry after 48-h taxol treatment (10 nM for MCF-7 and 2 nM for Cal51). Representative plots of three independent experiments are shown. Quantitative data show the average percentage of annexin V-positive cells (both in early apoptosis, lower right quadrants and late apoptosis, upper right quadrants) of three independent experiments (right panel). (c) Detection of cleaved PARP and cleaved caspase-3 by western blotting in Cal51 cell in the presence or absence of VEGFA/FGF2 after 2 nM taxol treatment for 48 h. (d) Caspase-3/7 and caspase-9 activities in MCF-7 and Cal51 cells after 48-h taxol treatment. (e) Expression levels of Bax and survivin in MCF-7 and Cal51 cells determined by qPCR in the presence or absence of VEGFA/FGF2. (f) Expression levels of pAKT, AKT, Bax and Survivin determined by western blotting in the presence or absence of VEGFA/FGF2. Numerical data represent mean±S.D. based on three independent experiments (*P<0.05), and the immunoblots are representative of three replicates
Figure 6
Figure 6
MiR-205 impairs the growth of breast cancer xenografts and increases chemosensitivity in vivo. Drug-resistant breast cancer cells stably expressing miR-205 or vector control (NC) were subcutaneously injected into the fat pad of nude mice (five per group). Fourteen days after implantation, mice were randomly split into two groups and treated with either vehicle or doxorubicin (1 mg/kg) plus taxol (2.5 mg/kg) every 3 days until they were killed 45 days after implantation, when xenografts were removed. (a) Size of MCF-7/A02 xenograft tumors after treatment with saline or drugs. Data are mean of tumor volume±S.D. of five tumors per group. (b) Image of tumors from control or miR-205-overexpressing MCF-7/A02 xenografts harvested at end point. (c) RNA was isolated from tumors and miR-205 was determined by qPCR. The individual tumor expression data (dots) and the mean values (line) are indicated. (d) Images of representative mice from control and miR-205-overexpressing CALDOX xenograft models. Arrow indicates the tumor developed only in the control group. (e) Image of tumors from control CALDOX xenografts harvested at day 28 after implantation. (f) RNA was isolated from tumors, and bax, survivin, VEGFA and FGF2 mRNA expression levels were determined by qPCR. The individual tumor expression data (dots) and the mean values (line) are indicated. (g) Expression levels of VEGFA and FGF2 determined by ELISA in plasma harvested at end point. The individual tumor expression data (dots) and the mean values (line) are indicated. *P<0.05

Similar articles

Cited by

References

    1. Chen W, Zheng R, Baade PD, Zhang S, Zeng H, Bray F et al. Cancer statistics in China, 2015. CA Cancer J Clin 2016; 66: 115–132. - PubMed
    1. Dieras V, Fumoleau P, Romieu G, Tubiana-Hulin M, Namer M, Mauriac L et al. Randomized parallel study of doxorubicin plus paclitaxel and doxorubicin plus cyclophosphamide as neoadjuvant treatment of patients with breast cancer. J Clin Oncol 2004; 22: 4958–4965. - PubMed
    1. Nowak AK, Wilcken NR, Stockler MR, Hamilton A, Ghersi D. Systematic review of taxane-containing versus non-taxane-containing regimens for adjuvant and neoadjuvant treatment of early breast cancer. Lancet Oncol 2004; 5: 372–380. - PubMed
    1. Balko JM, Giltnane JM, Wang K, Schwarz LJ, Young CD, Cook RS et al. Molecular profiling of the residual disease of triple-negative breast cancers after neoadjuvant chemotherapy identifies actionable therapeutic targets. Cancer Discov 2014; 4: 232–245. - PMC - PubMed
    1. Bonnefoi H, Litiere S, Piccart M, MacGrogan G, Fumoleau P, Brain E et al. Pathological complete response after neoadjuvant chemotherapy is an independent predictive factor irrespective of simplified breast cancer intrinsic subtypes: a landmark and two-step approach analyses from the EORTC 10994/BIG 1-00 phase III trial. Ann Oncol 2014; 25: 1128–1136. - PMC - PubMed

Publication types

MeSH terms