. 2016 Jun 30;11(6):e0158166.
doi: 10.1371/journal.pone.0158166. eCollection 2016.

Control of Insulin Secretion by Production of Reactive Oxygen Species: Study Performed in Pancreatic Islets from Fed and 48-Hour Fasted Wistar Rats

Affiliations

Control of Insulin Secretion by Production of Reactive Oxygen Species: Study Performed in Pancreatic Islets from Fed and 48-Hour Fasted Wistar Rats

Ana Cláudia Munhoz et al. PLoS One. .

Abstract

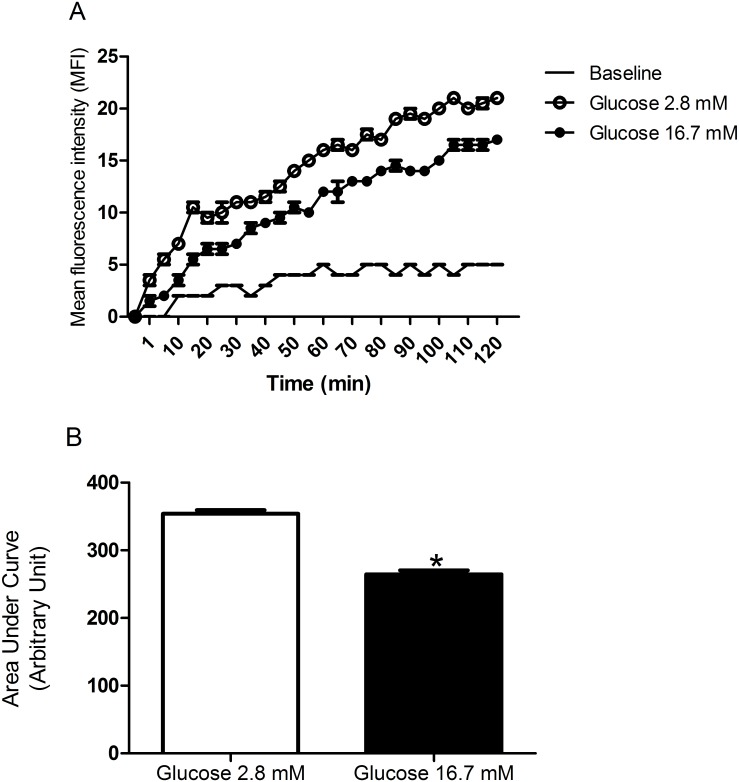
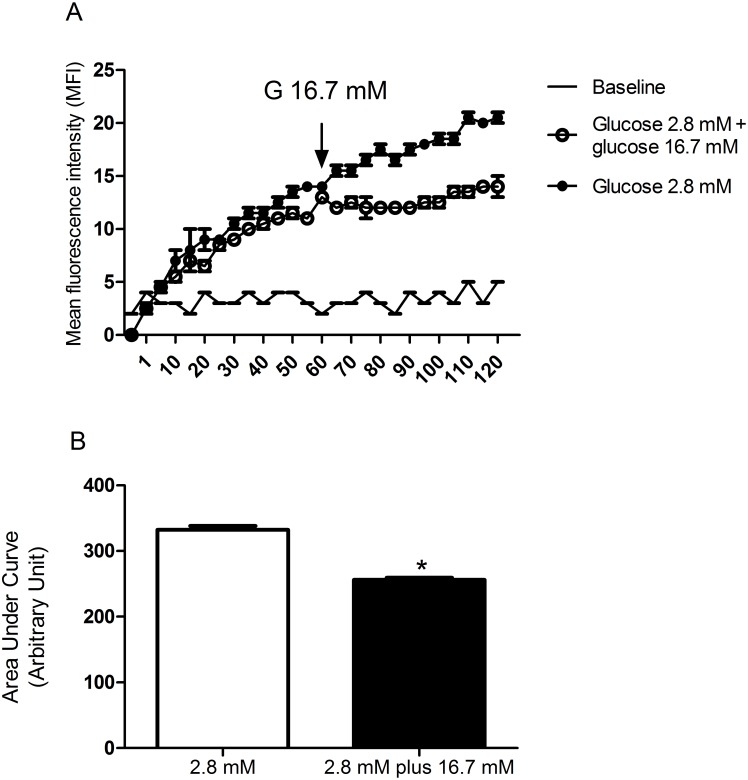
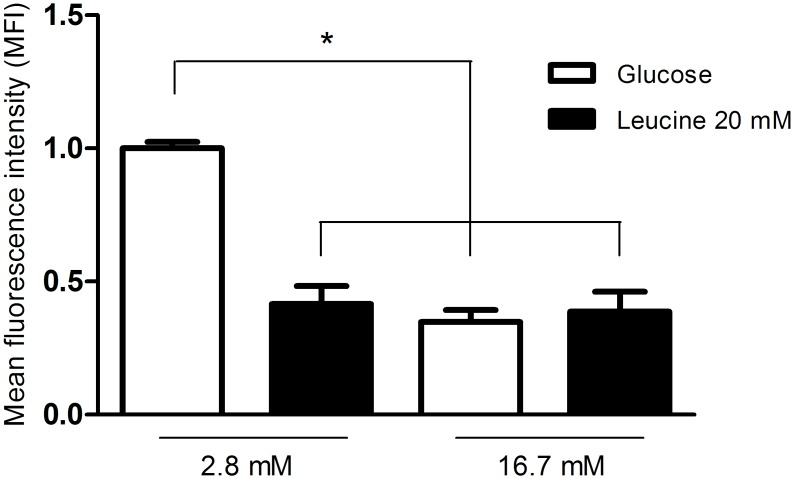
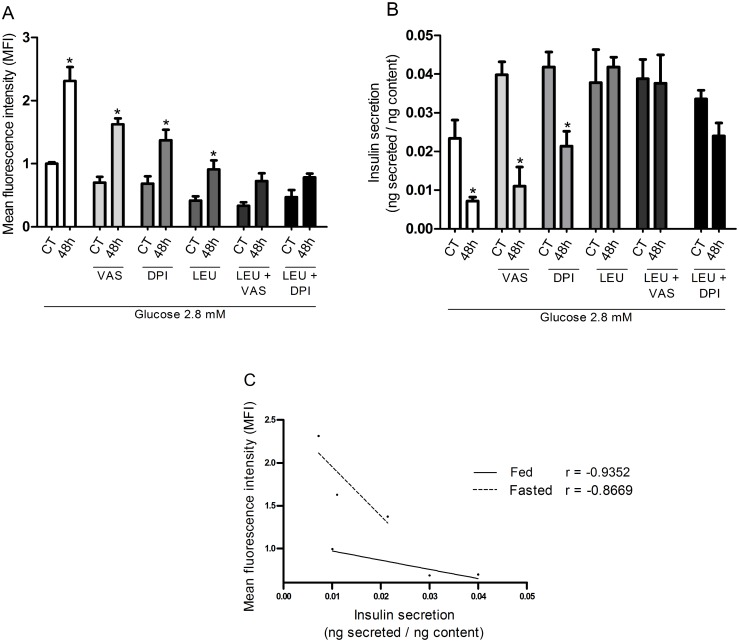
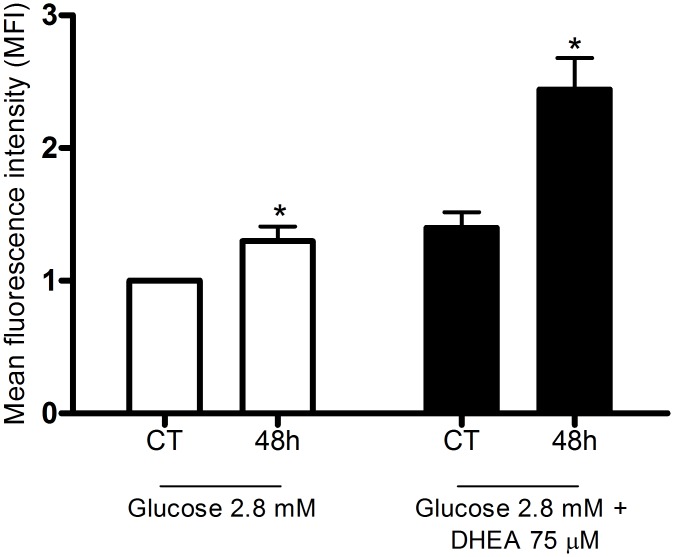
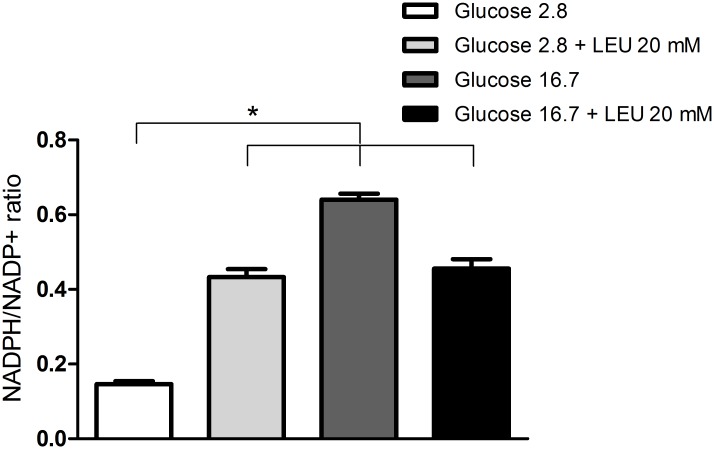
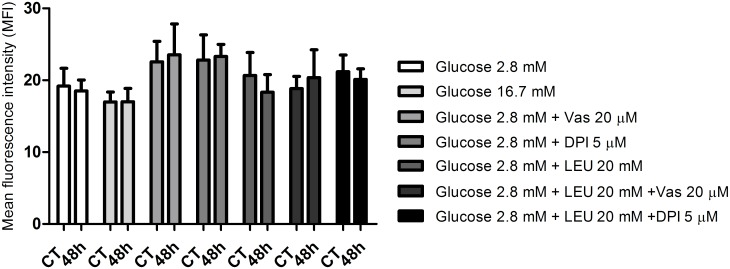
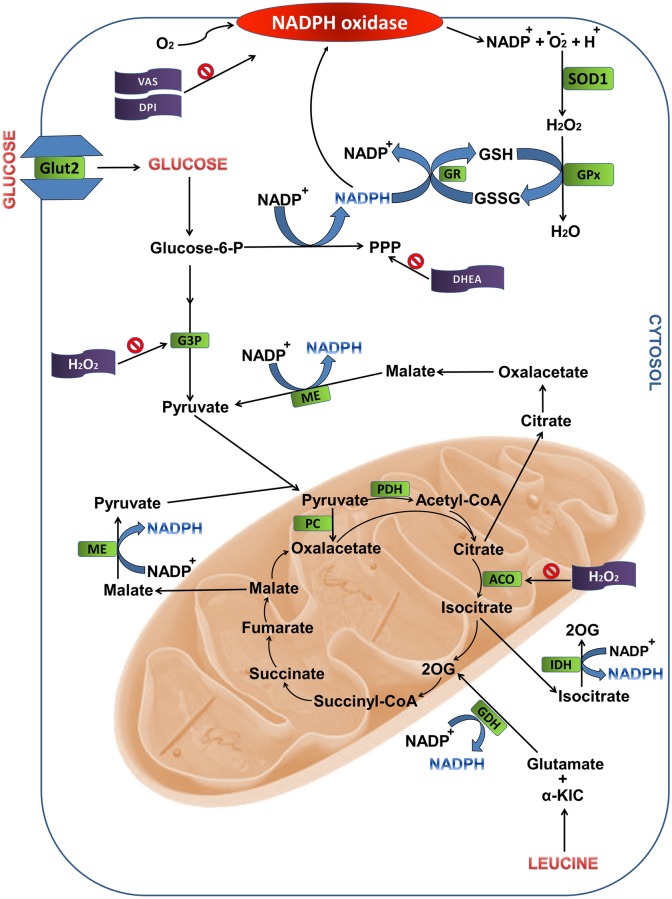
Mitochondria and NADPH oxidase are important sources of reactive oxygen species in particular the superoxide radical (ROS) in pancreatic islets. These molecules derived from molecular oxygen are involved in pancreatic β-cells signaling and control of insulin secretion. We examined the involvement of ROS produced through NADPH oxidase in the leucine- and/or glucose-induced insulin secretion by pancreatic islets from fed or 48-hour fasted rats. Glucose-stimulated insulin secretion (GSIS) in isolated islets was evaluated at low (2.8 mM) or high (16.7 mM) glucose concentrations in the presence or absence of leucine (20 mM) and/or NADPH oxidase inhibitors (VAS2870-20 μM or diphenylene iodonium-DPI-5 μM). ROS production was determined in islets treated with dihydroethidium (DHE) or MitoSOX Red reagent for 20 min and dispersed for fluorescence measurement by flow cytometry. NADPH content variation was examined in INS-1E cells (an insulin secreting cell line) after incubation in the presence of glucose (2.8 or 16.7 mM) and leucine (20 mM). At 2.8 mM glucose, VAS2870 and DPI reduced net ROS production (by 30%) and increased GSIS (by 70%) in a negative correlation manner (r = -0.93). At 16.7 mM glucose or 20 mM leucine, both NADPH oxidase inhibitors did not alter insulin secretion neither net ROS production. Pentose phosphate pathway inhibition by treatment with DHEA (75 μM) at low glucose led to an increase in net ROS production in pancreatic islets from fed rats (by 40%) and induced a marked increase (by 144%) in islets from 48-hour fasted rats. The NADPH/NADP+ ratio was increased when INS-1E cells were exposed to high glucose (by 4.3-fold) or leucine (by 3-fold). In conclusion, increased ROS production through NADPH oxidase prevents the occurrence of hypoglycemia in fasting conditions, however, in the presence of high glucose or high leucine levels, the increased production of NADPH and the consequent enhancement of the activity of the antioxidant defenses mitigate the excess of ROS production and allow the secretory process of insulin to take place.


Conflict of interest statement

Competing Interests: The authors have declared that no competing interests exist.

Figures

Fig 1
Fig 1. Kinetic measurement of net cytosolic ROS production.
(A) Mean fluorescence intensity (MFI—arbitrary units) by pancreatic islets isolated from fed rats, treated with dihydroethidium (DHE), and measured every 5 minutes during 120-minute incubation in the presence of 2.8 or 16.7 mM glucose—experimental protocol 1. (B) The corresponding areas under the curves were then calculated. The results are presented as mean ± SEM of four cell preparations for each group. * p <0.05 as compared to 2.8 mM glucose and indicated by the Student’s t-test.
Fig 2
Fig 2. Kinetic measurement of net cytosolic ROS production.
(A) Mean fluorescence intensity (MFI—arbitrary units) by pancreatic islets isolated from fed rats, treated with dihydroethidium (DHE), and incubated with 2.8 mM glucose for 120 minutes or for 60 minutes with 2.8 mM glucose that was replaced by 16.7 mM glucose and then maintained for another 60-minute period incubation—experimental protocol 2. (B) The corresponding areas under the curves were then calculated. The results are presented as mean ± SEM of five cell preparations for each group. *p <0.05 as compared to 2.8 mM glucose and indicated by the Student’s t-test.
Fig 3
Fig 3. Net ROS production by pancreatic islets from fed rats in the presence of 20 mM leucine and 2.8 or 16.7 mM glucose.
Mean fluorescence intensity (MFI—arbitrary units) by pancreatic islets from fed rats, treated with dihydroethidium (DHE), and incubated for 60 minutes in the presence of 2.8 or 16.7 mM glucose with or without addition of leucine (LEU—20 mM)–experimental protocol 3. The results are presented as mean ± SEM of four cell preparations for each group. *p <0.05 as compared to 2.8 mM glucose only and indicated by one-way ANOVA and Dunnett's post test.
Fig 4
Fig 4. ROS production and insulin secretion by pancreatic islets from fed and fasted rats in the presence of 20 mM leucine and 2.8 or 16.7 mM glucose.
(A) Mean fluorescence intensity (MFI—arbitrary units) and (B) insulin secretion by pancreatic islets from fed (CT) or 48-hour fasted (48h) rats, treated with dihydroethidium (DHE), and incubated for 60 minutes in the presence of 2.8 mM glucose with or without addition of VAS2870 (20 μM) or DPI (5 μM), associated or not with leucine (LEU—20 mM)–experimental protocol 4. The results are presented as mean ± SEM of four different cell preparations for each group * p <0.05 compared to fed control (CT) under the same conditions as indicated by the Student t-test. (C) Inverse correlation between MFI and insulin secretion in the presence of 2.8 mM glucose with or without addition of VAS2870 (20 μM) or DPI (5 μM) in pancreatic islets isolated from fed or 48-hour fasted rats as indicated by the correlation test using the GraphPad Prism 5.
Fig 5
Fig 5. Changes in ROS production induced by pentose phosphate pathway inhibition.
Mean fluorescence intensity (MFI—arbitrary units) by pancreatic islets from fed (CT) or 48-hour fasted (48h) rats, treated with dihydroethidium (DHE), and incubated for 60 minutes in the presence of 2.8 mM glucose with or without addition of dehydroepiandrosterone (DHEA—75 μM)–experimental protocol 5. The results are presented as mean ± SEM of five different cell preparations for each group. * p <0.05 compared to fed control (CT) under the same conditions as indicated by the Student t-test.
Fig 6
Fig 6. Changes of NADPH/NADP+ ratio in INS-1E cells cultivated in the presence of 20 mM leucine and 2.8 or 16.7 mM glucose.
NADPH/NADP+ ratio in INS-1E cells incubated for 60 minutes in the presence of 2.8 or 16.7 mM glucose with or without addition of leucine (LEU—20 mM)–experimental protocol 6. The results are presented as mean ± SEM of three different cell preparations for each group. *p <0.05 compared to 2.8 mM glucose as indicated by the Student t-test.
Fig 7
Fig 7. Mitochondrial ROS measurement.
Mean fluorescence intensity (MFI—arbitrary units) by pancreatic islets from fed (CT) or 48-hour fasted (48h) rats. The islets were treated with MitoSOX Red reagent and incubated for 60 minutes in the presence of 2.8 or 16.7 mM glucose with or without addition of VAS2870 (20 μM) or DPI (5 μM) associated or not with leucine (LEU—20 mM)—experimental protocol 4. The results are presented as mean ± SEM of four cell preparations for each group as indicated by one-way ANOVA and Dunnett's post test.
Fig 8
Fig 8. Metabolic pathways associated to NADPH production from glucose and leucine oxidation in pancreatic islets.
The sites indicated are: the pentose phosphate pathway and reactions involving intermediates of the Krebs cycle. ACO, aconitase; CYT, cytosol; DHEA, dehydroepiandrosterone; G3P, glyceraldehyde-3-phosphate dehydrogenase; GDH, glutamate dehydrogenase; GPx, glutathione peroxidase; GR, glutathione reductase; GSH, reduced glutathione; GSSG, oxidized glutathione; IDH, isocitrate dehydrogenase; ME, malic enzyme; MIT, mitochondria; PDH, pyruvate dehydrogenase; PPP, pentose phosphate pathway; SOD1, superoxide dismutase 1; 2OG, 2-oxoglutarate; α-KIC, α-ketoisocaproic acid.

Similar articles

Cited by

References

    1. Oliveira HR, Verlengia R, Carvalho CR, Britto LR, Curi R, Carpinelli AR. Pancreatic beta-cells express phagocyte-like NAD(P)H oxidase. Diabetes. 2003;52(6):1457–63. . - PubMed
    1. Babior BM, Lambeth JD, Nauseef W. The neutrophil NADPH oxidase. Arch Biochem Biophys. 2002;397(2):342–4. 10.1006/abbi.2001.2642 . - DOI - PubMed
    1. Bedard K, Krause KH. The NOX family of ROS-generating NADPH oxidases: physiology and pathophysiology. Physiol Rev. 2007;87(1):245–313. 10.1152/physrev.00044.2005 . - DOI - PubMed
    1. Valle MM, Graciano MF, Lopes de Oliveira ER, Camporez JP, Akamine EH, Carvalho CR, et al. Alterations of NADPH oxidase activity in rat pancreatic islets induced by a high-fat diet. Pancreas. 2011;40(3):390–5. 10.1097/MPA.0b013e31820569d0 . - DOI - PubMed
    1. Rebelato E, Mares-Guia TR, Graciano MF, Labriola L, Britto LR, Garay-Malpartida HM, et al. Expression of NADPH oxidase in human pancreatic islets. Life Sci. 2012;91(7–8):244–9. 10.1016/j.lfs.2012.07.004 . - DOI - PubMed