. 2016 Jul 5;7(27):41767-41780.
doi: 10.18632/oncotarget.9702.

The posterior HOXD locus: Its contribution to phenotype and malignancy of Ewing sarcoma

Affiliations

The posterior HOXD locus: Its contribution to phenotype and malignancy of Ewing sarcoma

Kristina von Heyking et al. Oncotarget. .

Abstract

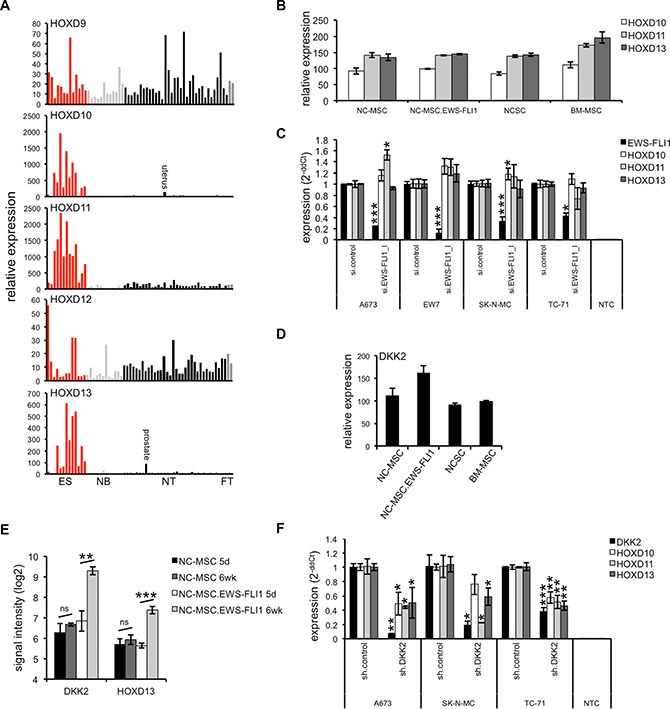
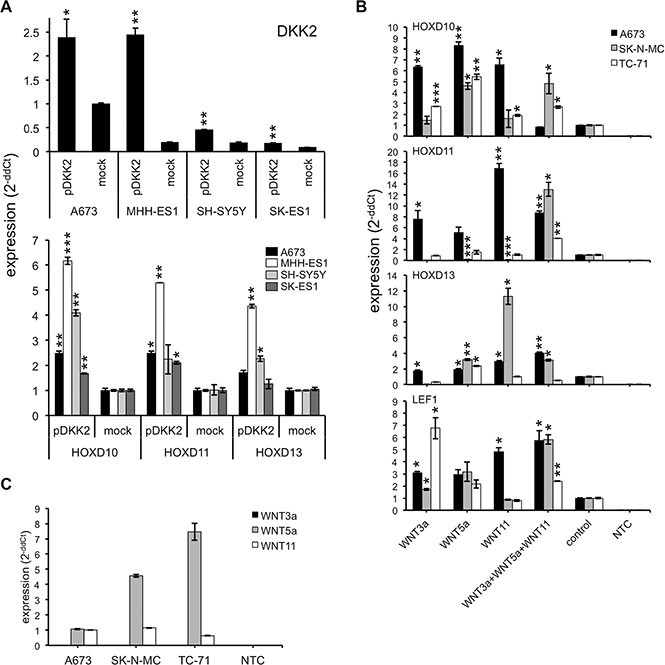
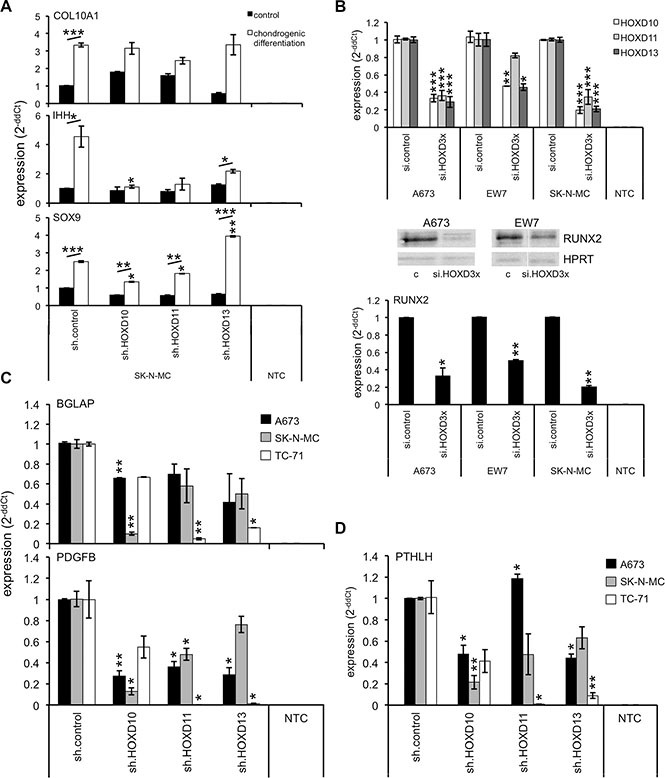
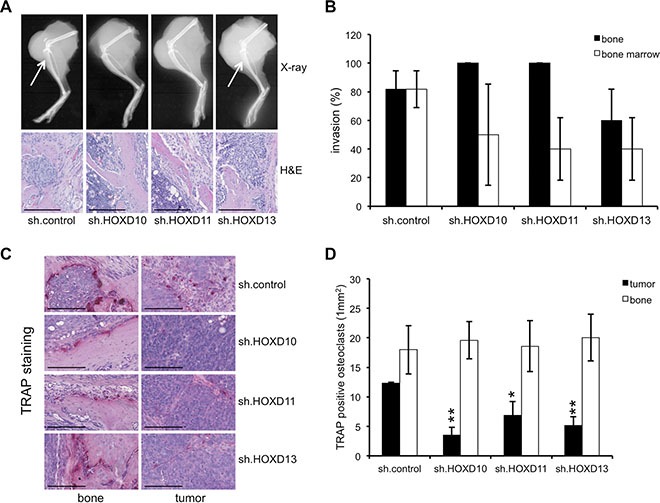
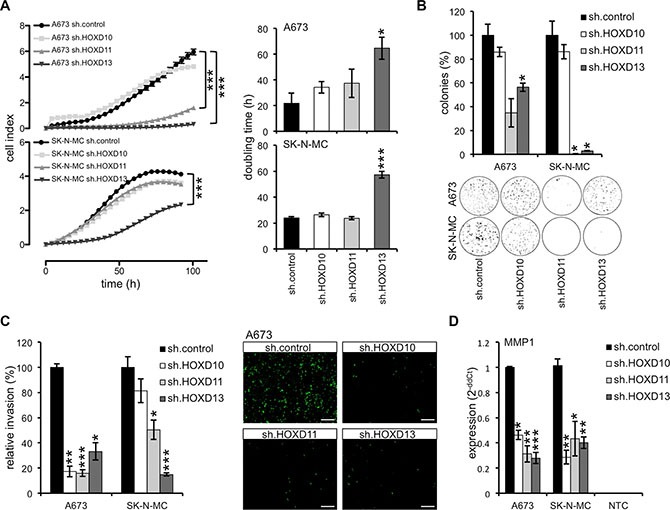
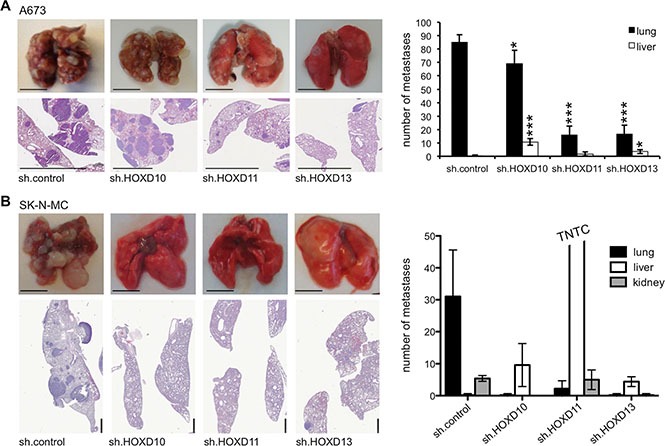
Microarray analysis revealed genes of the posterior HOXD locus normally involved in bone formation to be over-expressed in primary Ewing sarcoma (ES). The expression of posterior HOXD genes was not influenced via ES pathognomonic EWS/ETS translocations. However, knock down of the dickkopf WNT signaling pathway inhibitor 2 (DKK2) resulted in a significant suppression of HOXD10, HOXD11 and HOXD13 while over-expression of DKK2 and stimulation with factors of the WNT signaling pathway such as WNT3a, WNT5a or WNT11 increased their expression. RNA interference demonstrated that individual HOXD genes promoted chondrogenic differentiation potential, and enhanced expression of the bone-associated gene RUNX2. Furthermore, HOXD genes increased the level of the osteoblast- and osteoclast-specific genes, osteocalcin (BGLAP) and platelet-derived growth factor beta polypeptide (PDGFB), and may further regulate endochondral bone development via induction of parathyroid hormone-like hormone (PTHLH). Additionally, HOXD11 and HOXD13 promoted contact independent growth of ES, while in vitro invasiveness of ES lines was enhanced by all 3 HOXD genes investigated and seemed mediated via matrix metallopeptidase 1 (MMP1). Consequently, knock down of HOXD11 or HOXD13 significantly suppressed lung metastasis in a xeno-transplant model in immune deficient mice, providing overall evidence that posterior HOXD genes promote clonogenicity and metastatic potential of ES.

Keywords: Ewing sarcoma; HOXD; WNT signaling; endochondral development; metastasis.


Conflict of interest statement

The authors declare no conflict of interest or financial interests.

Figures

Figure 1
Figure 1. HOXD gene expression and regulation in ES
(A) Expression profile of HOXD9 – HOXD13 in ES (red) in comparison to neuroblastoma (NB; light gray), normal (NT; black) and fetal tissue (FT; dark gray). ES and NB RNA were hybridized onto HG U133A arrays (Affymetrix; GSE1825, GSE15757; [50]) and compared to a published microarray study of normal tissue (GSE2361). Each bar represents the expression signal of an individual array. (B) HOXD genes seem not induced after over-expression of EWS-FLI1 in mesenchymal and neural crest stem cells. NC-MSC: control vector transduced neural crest-derived MSC after 5 days in self-renewal media, NC-MSC.EWS-FLI1: EWS-FLI1 transduced NC-MSC after 5 days in self-renewal media, NCSC: undifferentiated, freshly isolated neural crest stem cells, BM-MSC: undifferentiated adult bone marrow derived MSC. (C) Expression of HOXD genes is not affected after suppression of EWS-FLI1 in four different ES lines using RNA interference as measured by qRT-PCR. Data are mean ± SEM; t-test. (D) Expression of DKK2 in undifferentiated stem cell populations (NC-MSC, NC-MSC.EWS-FLI1, NCSC and BM-MSC; from GEO dataset GEO21511, CEL files were RMA normalized by use of expression console software, Affymetrix). (E) Expression of DKK2 and HOXD13 in NC-MSC cells following exposure to differentiation conditions. NC-MSC transduced with GFP-only (NC-MSC) or EWS-FLI1-GFP (NC-MSC.EWS-FLI1) lentiviral vectors were passaged for 5 days in self-renewal media (5 d) and then transferred to differentiation media for 6 weeks (6 wk). Gene expression profiling studies of triplicate samples reveals that exposure to differentiation conditions resulted in up-regulation of DKK2 and HOXD13 in EWS-FLI1+ cells. (F) Suppression of DKK2 by specific shRNA [5] in different ES lines results in a significantly down-regulation of HOXD10, HOXD11 and HOXD13 as measured by qRT-PCR. Data are mean ± SEM; t-test.
Figure 2
Figure 2. DKK2 increases HOXD gene expression through WNT signaling pathway
(A) Increased HOXD10, HOXD11 or HOXD13 expression (bottom) after transfection with cDNA encoding human DKK2 (top) in ES lines A673, MHH-ES1, SK-ES1 or NB line SH-SY5Y, respectively. Results of qRT-PCRs are shown. Data are mean ± SEM; t-test. (B) Analysis of HOXD gene expression in A673, SK-N-MC and TC-71 cells after incubation with recombinant human WNT3a, WNT5a or WNT11 and the combination of all three ligands. RNA was isolated after 1, 3, 6 and 12 h and the time point with the highest increase was shown. Data are mean ± SEM; t-test. (C) Expression of endogenous WNT3a, WNT5a and WNT11 mRNA in three ES cell lines (A673, SK-N-MC and TC-71) analyzed by qRT-PCR. Data are mean ± SEM; t-test.
Figure 3
Figure 3. Posterior HOXD genes promote chondrogenic differentiation and expression of bone associated genes
(A) Chondrogenic differentiation potential of ES lines with specific shRNA constructs was shown by the expression of specific chondrogenic marker genes COL10A1, IHH and SOX9 using qRT-PCR. Data are mean ± SEM; t-test. (B) Analysis of RUNX2 expression in A673, EW7 and SK-N-MC cells after transient combined HOXD knock down with specific siRNAs against HOXD10, HOXD11 and HOXD13 using qRT-PCR. Data are mean ± SEM; t-test. Middle panel western-blot of RUNX2 expression after triple HOXD knock down compared to respective controls (si.control: c). (C) mRNA analysis of BGLAP and PDGFB expression in 3 different ES lines after inhibition of HOXD10, HOXD11 or HOXD13 expression with specific shRNA. Data are mean ± SEM; t-test. (D) Expression analysis of PTHLH in ES after knock down of individual HOXD genes by qRT-PCR. Data are mean ± SEM; t-test.
Figure 4
Figure 4. HOXD genes enhance the amount of TRAP+ osteoclasts in the tumor
Analysis of bone invasiveness and osteolysis of constitutive A673 HOXD10, HOXD11 and HOXD13 shRNA infectants and negative controls in an orthotopic bone xeno-transplantation model (5–11 mice/group). Affected bones were assessed by X-ray radiography and histology. (A) Representative pictures of X-ray radiography and H&E staining showing no clear differences in bone invasiveness between A673 cells with constitutive HOXD10, HOXD11 or HOXD13 knock down and respective controls (X-ray, H&E, scale bar 0.25 mm). (B) Percentage of mice exhibiting infiltration of cortical bone or bone marrow infiltration after intra-tibial injection. (C) TRAP staining of osteoclasts for better visualization and to quantify osteolysis in bone and tumor tissues (scale bar 0.15 mm). (D) Average number of TRAP+ osteoclasts attached to the bone or in the tumor (1 mm2) was determined in at least three tumor samples/group (In each sample not less than 20 segments were analyzed).
Figure 5
Figure 5. HOXD10, HOXD11 and HOXD13 promote growth and invasiveness of ES
(A) Left, analysis of proliferation of constitutively infected ES lines with xCELLigence (hexaplicates/group). Cellular impedance was measured every 4 hours (relative cell index). Right, doubling time of constitutive A673 and SK-N-MC HOXD10, HOXD11 and HOXD13 shRNA infectants and respective controls (sh.control). Data are mean ± SEM of two independent experiments/cell line (hexaplicates/group). (B) Anchorage-independent colony formation in methylcellulose of ES lines with stable HOXD10, HOXD11 and HOXD13 knock down. Upper panel, data are mean ± SEM of two independent experiments (duplicates/group). Lower panel, macrographs show two representative experiments with A673 and SK-N-MC. (C) Analysis of invasiveness of ES lines through Matrigel after transfection with specific HOXD10, HOXD11 or HOXD13 shRNA constructs. Left, data are mean ± SEM of three independent experiments. Right, invasive A673 cells are shown after 48 hours incubation (scale bar 500 μm). (D) Expression of MMP1 mRNA after HOXD knock down (sh.HOXD10, sh.HOXD11 and sh.HOXD13) using qRT-PCR. Data are mean ± SEM; t-test.
Figure 6
Figure 6. HOXD11 and HOXD13 promote lung metastasis in ES
(A) In vivo analysis of the metastatic potential of A673 cells constitutively transfected with sh.control, sh.HOXD10, sh.HOXD11 and sh.HOXD13 in Rag2−/−γC−/− mice (5 mice/group). Affected organs were photographed and analyzed by histology. Left, representative pictures of whole organs and H&E staining sections are shown (scale bar 5 mm). Right, average number of apparent metastases in lung and liver tissues is plotted. (B) Similar experiments were carried out with SK-N-MC cells constitutively transfected with sh.control, sh.HOXD10, sh.HOXD11 and sh.HOXD13 in immune deficient Rag2−/−γC−/− mice (5 mice/group). Here knock down of HOXD10 also inhibited lung metastasis (scale bar 5 or 1mm).

Similar articles

Cited by

References

    1. Mackintosh C, Madoz-Gurpide J, Ordonez JL, Osuna D, Herrero-Martin D. The molecular pathogenesis of Ewing's sarcoma. Cancer biology & therapy. 2010;9:655–667. - PubMed
    1. Ewing J. Classics in oncology. Diffuse endothelioma of bone. James Ewing. Proceedings of the New York Pathological Society, 1921. CA Cancer J Clin. 1972;22:95–98. - PubMed
    1. Schmidt D, Harms D, Burdach S. Malignant peripheral neuroectodermal tumours of childhood and adolescence. Virchows Arch A Pathol Anat Histopathol. 1985;406:351–365. - PubMed
    1. Cavazzana AO, Miser JS, Jefferson J, Triche TJ. Experimental evidence for a neural origin of Ewing's sarcoma of bone. The American journal of pathology. 1987;127:507–518. - PMC - PubMed
    1. Hauer K, Calzada-Wack J, Steiger K, Grunewald TG, Baumhoer D, Plehm S, Buch T, Prazeres da Costa O, Esposito I, Burdach S, Richter GH. DKK2 mediates osteolysis, invasiveness, and metastatic spread in Ewing sarcoma. Cancer Res. 2013;73:967–977. - PubMed

MeSH terms

Substances