. 2016 Jul 26;7(30):47201-47220.
doi: 10.18632/oncotarget.9719.

Antimitotic activity of DY131 and the estrogen-related receptor beta 2 (ERRβ2) splice variant in breast cancer

Affiliations

Antimitotic activity of DY131 and the estrogen-related receptor beta 2 (ERRβ2) splice variant in breast cancer

Mary M Heckler et al. Oncotarget. .

Abstract

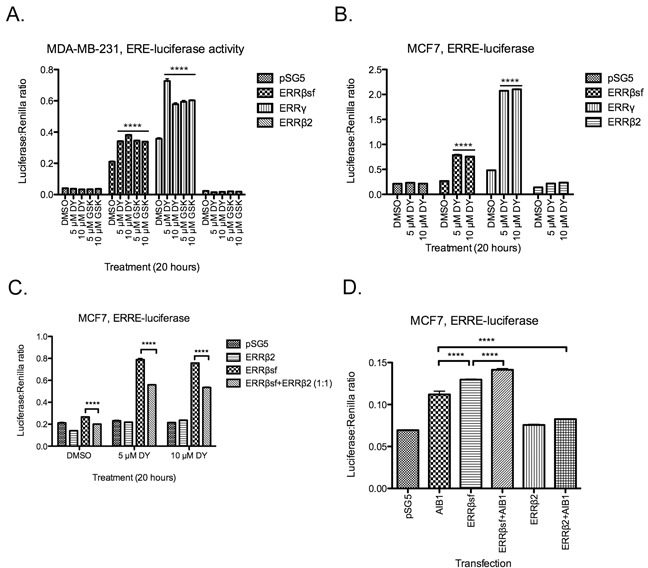
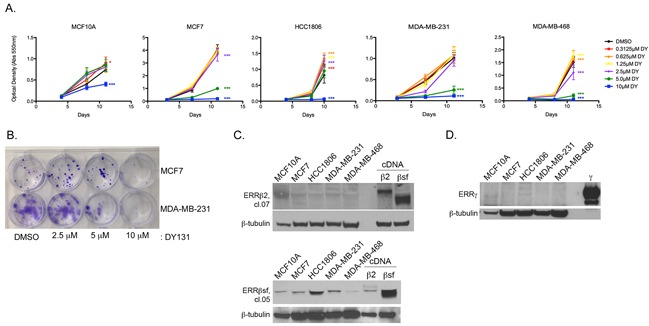
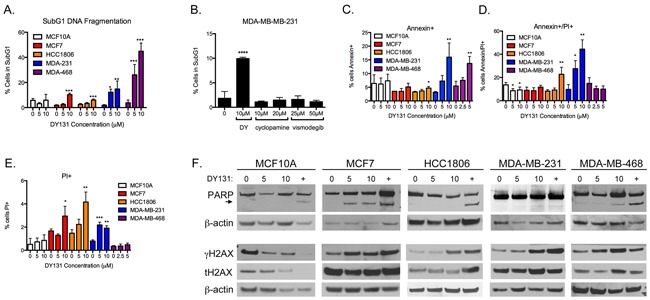
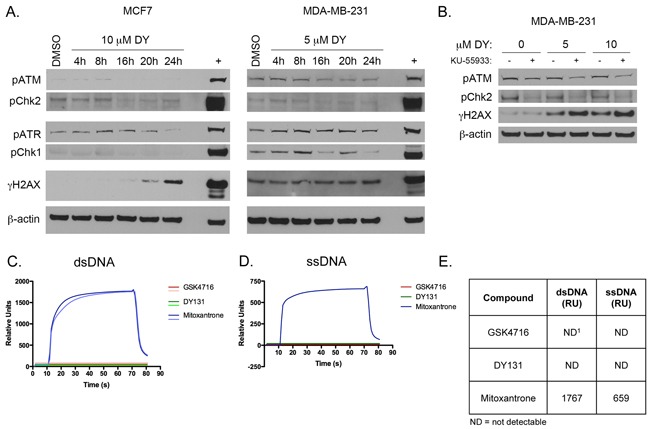
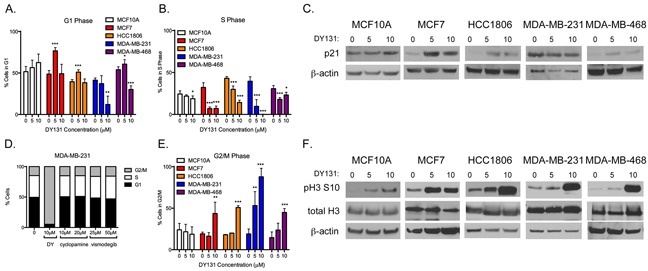
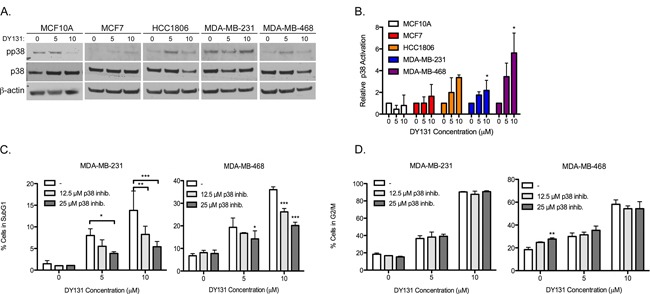
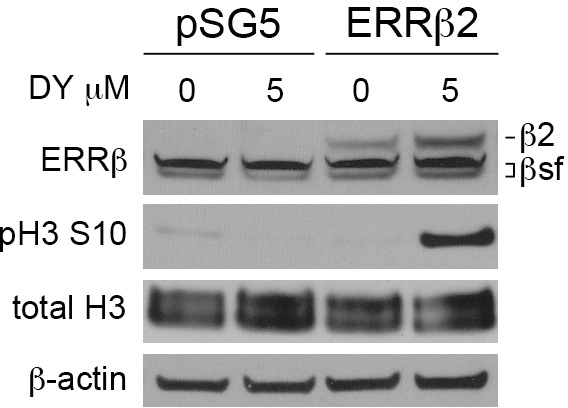
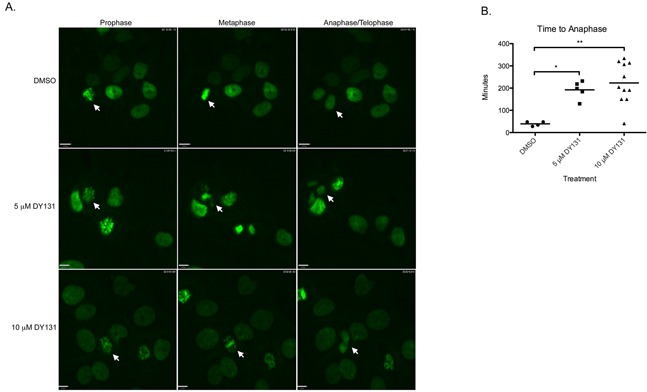
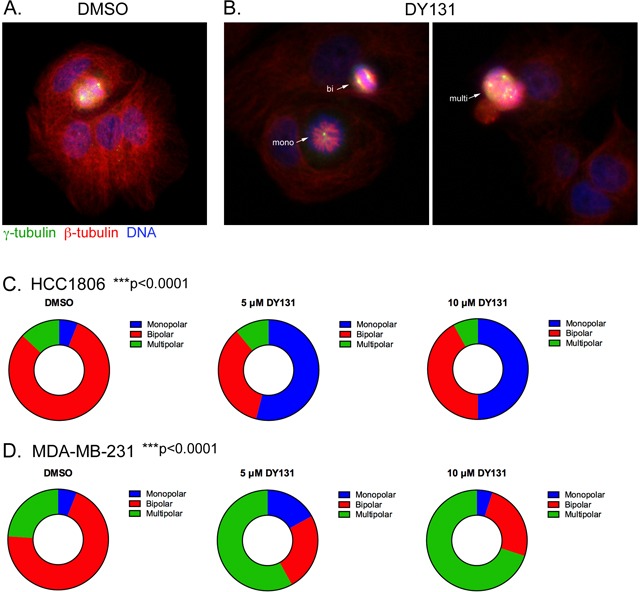
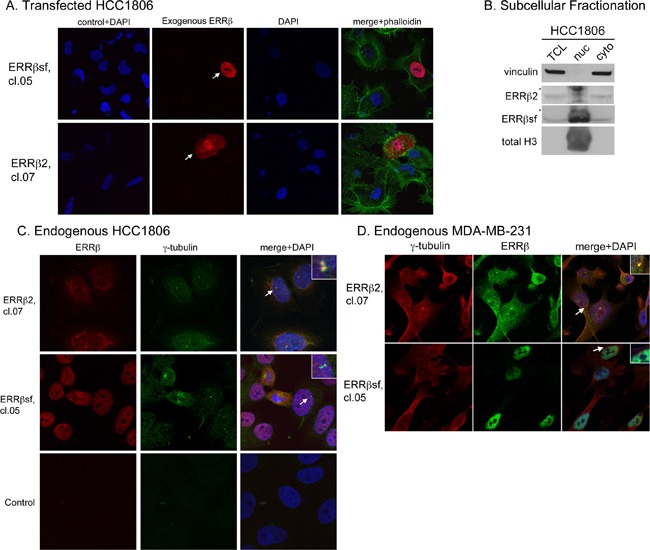
Breast cancer remains a leading cause of cancer-related death in women, and triple negative breast cancer (TNBC) lacks clinically actionable therapeutic targets. Death in mitosis is a tumor suppressive mechanism that occurs in cancer cells experiencing a defective M phase. The orphan estrogen-related receptor beta (ERRβ) is a key reprogramming factor in murine embryonic and induced pluripotent stem cells. In primates, ERRβ is alternatively spliced to produce several receptor isoforms. In cellular models of glioblastoma, short form (ERRβsf) and beta2 (ERRβ2) splice variants differentially regulate cell cycle progression in response to the synthetic agonist DY131, with ERRβ2 driving arrest in G2/M.The goals of the present study are to determine the cellular function(s) of ligand-activated ERRβ splice variants in breast cancer and evaluate the potential of DY131 to serve as an antimitotic agent, particularly in TNBC. DY131 inhibits growth in a diverse panel of breast cancer cell lines, causing cell death that involves the p38 stress kinase pathway and a bimodal cell cycle arrest. ERRβ2 facilitates the block in G2/M, and DY131 delays progression from prophase to anaphase. Finally, ERRβ2 localizes to centrosomes and DY131 causes mitotic spindle defects. Targeting ERRβ2 may therefore be a promising therapeutic strategy in breast cancer.

Keywords: ERRbeta; ESRRB; cell death; mitosis; p38 MAPK.


Conflict of interest statement

The authors have no potential conflicts of interest to disclose.

Figures

Figure 1
Figure 1. ERRβ2 has no transcription factor activity in breast cancer cells
MDA-MB-231 A. and MCF7 cells B. transiently co-transfected with the indicated promoter-reporter luciferase constructs and receptor cDNA, then treated with either DY131 (DY), GSK4716 (GSK), or DMSO control (18-20 h) as shown. N = 3 for a representative assay peformed in triplicate, two-way ANOVA with Bonferroni post-test. **** denote post-hoc Bonferroni comparison for each drug treatment vs. DMSO control. C, MCF7 cells transiently co-transfected with ERRE-luciferase and ERRβ2, ERRβsf, or a 1:1 ratio of the two cDNAs, then treated with DY131 or DMSO control for 18-20 h. N = 3 for a representative assay performed in triplicate, two-way ANOVA with Bonferroni post-test. D, MCF7 cells transiently co-transfected with ERRE-luciferase and AIB1, ERRβsf, ERRβ2, or a 1:1 ratio of AIB1:ERRβsf or AIB1:ERRβ2 for ~24 h. N = 3 for a representative assay shown in triplicate, two-way ANOVA with Bonferroni post-test.
Figure 2
Figure 2. ERRβ/γ agonist DY131 is growth-inhibitory in breast cancer cells
A. Crystal violet staining of breast cancer and non-transformed breast epithelial cell lines in the presence or absence of the indicated concentrations of DY131 or DMSO control over time. N = 6 for a representative assay performed in sextuplicate, two-way ANOVA with Bonferroni post-tests in each cell line vs. DMSO control at Day 10/11. B. Clonogenic survival assay for MCF7 and MDA-MB-231 cells seeded at low density and cultured for 13 d after a single, 24 h exposure to the indicated concentrations of DY131. C-D. Representative Western blot analysis of basal ERRβsf, ERRβ2, and ERRγ expression in non-transformed mammary epithelial and breast cancer cells. β2 and βsf positive controls are from MDA-MB-231 cells transiently transfected with the indicated cDNA. γ positive control is purified protein.
Figure 3
Figure 3. DY131 induces apoptotic cell death
A. Percent of cells exhibiting fragmented DNA (subG1 DNA content as measured by propidium iodide staining of fixed cells) after exposure to DY131 for 24 h as determined by flow cytometry. N = 3 – 5 independent assays, one-way ANOVA with Tukey's post-test. B. Effect of Smoothened inhibitors cyclopamine and vismodegib on subG1 DNA content in MDA-MB-231 cells after 24 h exposure. N = 3 independent assays, one-way ANOVA with Tukey's post-test. C-E. Percent of cells staining positive for cell-surface Annexin V and/or propidium iodide uptake by live cells after exposure to DY131 for 12-24 h as determined by flow cytometry. N = 3 – 5 independent assays, one-way ANOVA with Tukey's post-test. F. Representative Western blot analysis of PARP, γH2AX, and total H2AX in DY131-treated cells (24 h). + denotes doxorubicin positive control (24 h). Arrowhead indicates PARP cleavage product.
Figure 4
Figure 4. DY131 does not induce a conventional DNA damage response or bind DNA directly
A. Representative time course Western blot analysis of DNA damage response kinases and γH2AX in response to DY131 in MCF7 and MDA-MB-231 cells. + denotes doxorubicin positive control (24 h). B. Representative Western blot analysis of ATM signaling pathway activation and γH2AX in MDA-MB-231 cells in response to DY131 following a 1 h pre-treatment with ATM inhibitor KU-55933. C-D. Surface plasmon resonance (BIAcore) sensogram of DY131, GSK4716, or mitoxantrone positive control binding to dsDNA or ssDNA. E. Table summarizing results of BIAcore binding studies. Values shown are the peak Relative Unit (RU) values after 60 s injection of compound. ND1 = not detectable. Data shown are from a representative experiment, performed twice.
Figure 5
Figure 5. DY131 induces G1 and G2/M cell cycle arrest
A. Percent of cells in the G1 phase of the cell cycle after exposure to DY131 for 24 h as determined by flow cytometry. N = 3 – 5 independent assays, one-way ANOVA with Tukey's post-test. B. Percent of cells in S phase of cell cycle after exposure to DY131 for 24 h as determined by flow cytometry. N = 3 – 5 independent assays, one-way ANOVA with Tukey's post-test., C. Representative Western blot analysis of p21 in DY131-treated cells (24 h). D. Effect of Smoothened inhibitors cyclopamine and vismodegib on the cell cycle profile of MDA-MB-231 cells after 24 h exposure. Data shown are from a representative experiment, performed three times. E. Percent of cells in the G2/M phase of the cell cycle after exposure to DY131 for 24 h as determined by flow cytometry. N = 3 – 5 independent assays, one-way ANOVA with Tukey's post-test. F. Representative Western blot analysis of phosphorylated Serine 10 and total Histone H3 in DY131-treated cells (24 h).
Figure 6
Figure 6. DY131-induced p38 MAPK activity is required for cell death, but not cell cycle arrest
A. Representative Western blots for activating phosphorylation of p38 in DY131-treated cells. B. Densitometry analysis of the ratio of phosphorylated to total p38 relative to β-actin are normalized to the level of the DMSO control for each cell line. N = 3 independent assays, one-way ANOVA with Tukey's post-test. C. Percent of cells exhibiting fragmented DNA (subG1 DNA content as measured by propidium iodide staining of fixed cells) after a 1 h pre-treatment with p38 inhibitor SB203580 before exposure to DY131 for an additional 24 h as determined by flow cytometry. N = 3 independent assays, two-way ANOVA with Bonferroni post-test. D., Percent of cells in the G2/M phase of the cell cycle after a 1 h pre-treatment with p38 inhibitor SB203580 before exposure to DY131 for an additional 24 h as determined by flow cytometry. N = 3 independent assays, two-way ANOVA with Bonferroni post-test.
Figure 7
Figure 7. ERRβ2 promotes DY131-induced histone H3 phosphorylation
Representative Western blot analysis of ERRβ2, phosphorylated Serine 10 and total Histone H3 in MCF7 cells transiently transfected with either ERRβ2 or pSG5 empty vector, then treated with DY131 or DMSO control for 18-20 h. Exogenous ERRβ2 expression was detecting using H6705 (cl.05) in order to also visualize endogenous ERRβsf.
Figure 8
Figure 8. DY131 delays chromosome segregation in mitosis
A. Individual frames representative of prophase, metaphase, and anaphase/telophase from live-cell confocal microscopy of MCF7 cells stably expressing GFP-H2B. Cells were accumulated in G2 by exposure to nocodazole, then released into DY131 or DMSO control. Arrows denote cells of interest. B. Quantitation of time elapsed from chromatin condensation (prophase) to anaphase in MCF7 cells stably expressing GFP-H2B after release from nocodazole block into DY131 or DMSO control. N = 4 – 11 cells, one-way ANOVA with Tukey's post-test.
Figure 9
Figure 9. DY131 causes monopolar and multipolar spindles
A. and B. HCC1806 were treated with DMSO and DY131 (5 uM) for 24 h. The cells were fixed and stained for the centrosomal marker γ-tubulin, β-tubulin and DAPI. C. and D. Graphical representation of the fraction of mono-, bi- and multipolar spindles for HCC1806 and MDA-MB-231 cells treated with DY131 or DMSO control for 24 h. N = 3 independent assays, chi squared test.
Figure 10
Figure 10. Endogenous ERRβ2 localizes to the cytosol and centrosomes
A. Subcellular localization of exogenous ERRβsf (cl.05, top) and ERRβ2 (cl.07, bottom) together with DNA (DAPI) in HCC1806 cells transfected with the appropriate cDNA. Arrowheads denote transfected cells. Control + DAPI indicates cells stained only with secondary antibodies plus DAPI. Phall = phalloidin. B. REAP fractionation of HCC1806 cells followed by Western blot analysis of vinculin, ERRβ2, ERRβsf, and total Histone H3. * denotes nonspecific band in nuclear extracts. Lanes were loaded as follows: TCL, 40 μl; nuc, 20 μl; cyto, 40 μl. C. Subcellular localization of endogenous ERRβ2 (top panels) or ERRβsf (bottom panels) together with the centrosome marker γ-tubulin and DNA (DAPI) in HCC1806 cells. Insets show an expanded view of centrosomes identified by arrows. Control indicates cells stained only with secondary antibodies plus DAPI. D. MDA-MB-231 cells, same as in C.

Similar articles

Cited by

References

    1. DeSantis C, Siegel R, Bandi P, Jemal A. Breast cancer statistics, 2011. CA Cancer J Clin. 2011;61:409–418. - PubMed
    1. Jemal A, Bray F, Center MM, Ferlay J, Ward E, Forman D. Global cancer statistics. CA Cancer J Clin. 2011;61:69–90. - PubMed
    1. Kohler BA, Sherman RL, Howlader N, Jemal A, Ryerson AB, Henry KA, Boscoe FP, Cronin KA, Lake A, Noone AM, Henley SJ, Eheman CR, Anderson RN, Penberthy L. Annual report to the nation on the status of cancer, 1975-2011, featuring incidence of breast cancer subtypes by race/ethnicity, poverty, and state. J Natl Cancer Inst. 2015;107:djv048. - PMC - PubMed
    1. Le Du F, Eckhardt BL, Lim B, Litton JK, Moulder S, Meric-Bernstam F, Gonzalez-Angulo AM, Ueno NT. Is the future of personalized therapy in triple-negative breast cancer based on molecular subtype? Oncotarget. 2015;6:12890–12908. doi: 10.18632/oncotarget.3849. - DOI - PMC - PubMed
    1. Galluzzi L, Vitale I, Abrams JM, Alnemri ES, Baehrecke EH, Blagosklonny MV, Dawson TM, Dawson VL, El-Deiry WS, Fulda S, Gottlieb E, Green DR, Hengartner MO, et al. Molecular definitions of cell death subroutines: Recommendations of the nomenclature committee on cell death 2012. Cell Death Differ. 2012;19:107–120. - PMC - PubMed